博文
R绘图一则 (2017年1月9日修订)
||||
R绘图一则
(2017年1月9日修订)
张金龙
jinlongzhang01@gmail.com
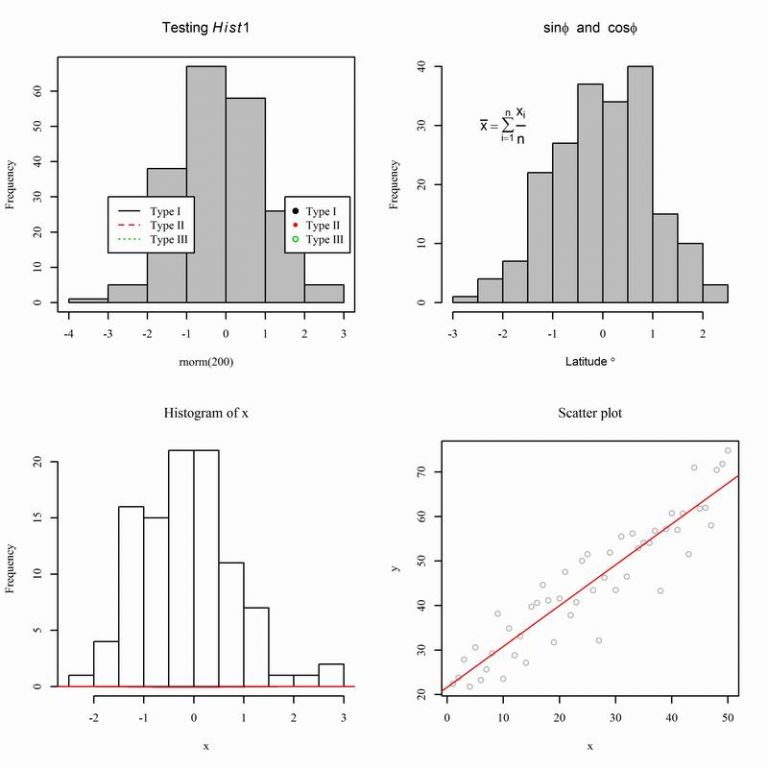
这里给出R常见绘图用到的参数。供生成出版质量的TIFF图。
调整R绘图的字体,一页多图, 分辨率600dpi, tiff, 压缩方式lzw
tiff(filename = "test.tif",
width = 3600, height = 3600, units = "px", pointsize = 8,
compression = "lzw", res = 600) ## 打开绘图器
par(mfrow = c(2,2), font.lab = 6, font.main = 6,font.axis = 6, font = 6) ## 分割成2行2列,共四个图
## 图1
## 标题部分斜体
hist(rnorm(200), main = expression(paste("Testing ", italic(Hist1))), col = "gray")
# 添加边框
box()
## 图中添加图例
legend.label <- c("Type I", "Type II", "Type III")
legend(1.5, 30, legend = legend.label, pch = c(19, 20, 21), col = c(1, 2, 3))
legend(-3.0, 30, legend = legend.label, lty = c(1, 2, 3), col = c(1, 2, 3))
## 图2
## 标题中显示度等特殊字符,标题中显示希腊字母
hist(rnorm(200), main = expression(paste(plain(sin) * phi, " and ", plain(cos) * phi)), xlab = expression(paste("Latitude ", degree)), col = "gray")
## 图中添加公式
text(-2, 30, expression(bar(x) == sum(frac(x[i], n), i==1, n)), cex = 1.2)
## 图3
x <- rnorm(100)
m=mean(x)
sd=sd(x)
hist(x)
x00 <- seq(-10, 10, 0.01)
lines(x00, m*dnorm(x00,m,sd), lty=1, col="red")
### 图4
y = 1:50 + (5*rnorm(50) + 20)
x = 1:50
plot(y ~ x, main = "Scatter plot", col = "gray")
abline(lm(y ~ x), col = 2)
dev.off() ## 关闭绘图器
getwd() ## 查看图保存的位置
https://m.sciencenet.cn/blog-255662-621286.html
上一篇:LyX生成中文pdf文档
下一篇:两棵进化树一致性的校对