博文
计算ICC,Rwg,多层次,多水平变量,汇聚,团队变量,组织变量(草稿)
||||
研究中经常会碰到数据需要上升到团队,使用团队层面数据进行分析的情况。如果要加总,大部分的研究都会报告三个数据:rwg、ICC(1)、ICC(2)。即要加总,要符合3个条件,rwg>0.7、ICC(1)>0.05、ICC(2)>0.5。
有直接计算的excel表,只要将数据代入即可,可以发邮件kuanghongda@163.com
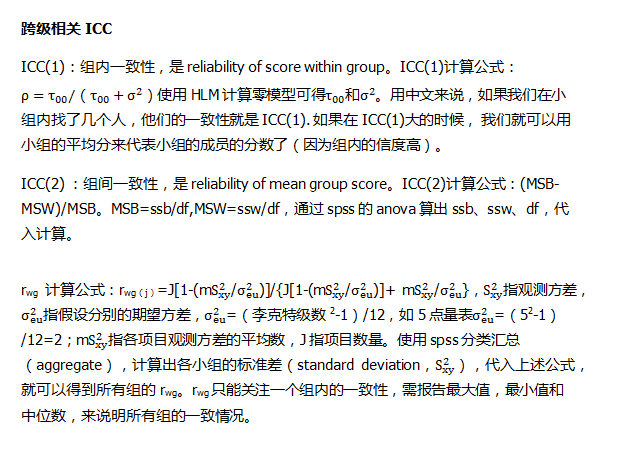
ICC(1) 组内一致性,是 reliability of score within group; 用中文来说,如果我们在小组内找了几个人,他们的一致性就是 ICC(1). 如果在ICC(1)大的时候, 我们就可以用小组的平均分来代表小组的成员的分数了(因为组内的信度高)。
但是这个新的指标(组的平均数)的信度高吗?
ICC(2) 组间一致性,是 reliability of mean group score。什么叫平均数的信度呢?现在不像组内的情形,可以用 internal consistency reliability。但是我们可以借用 test-retest reliability的观念。那就是如果我们再从原来的母体随机的抽样,抽出同样的这么多个小组,然后再计算每个小组的平均。那么,我们得到同样的(或是相近的)小组平均分的机会是多少。这就可以叫做“小组平均数”的信度了。那就是ICC(2)。
所以如果要加总,要符合两个条件。第一、组内要合一。第二、是小组的平均数要稳定。前者是.ICC(1),后者是ICC(2)。
对于ICC(1):多大才能加总?
“We encourage researchers to adopt traditional conventions used when interpreting effect sizes (i.e., percentage of variance explained). Specifically, a value of .01 might be considered a ‘small’ effect, a value of .10 might be considered a ‘medium’ effect, and a value of .25 might be considered a ‘large’ effect“
对于ICC(2):
So in most instances, ICC(K) and ICC(A,K) values >.90 are likely unnecessary. However, depending on the quality of the measures being used in multilevel analysis, researchers will probably want to choose between .70 and .85 to justify aggregation.”0
Rwg 组内一致性,管理类,大于0.7,
Reference:1 b: k& r1 T' G0 C; @$ x' P
LeBreton, J.M. & Senter, J.L. (2008). Answers to 20 questions about interrater reliability and interrater agreement. Organizational Research Methods, 11(4), 838-839.
视频讲解教程http://www.tudou.com/programs/view/O1UkwZ8gGwI/?spm=a2h0k.8191414.O1UkwZ8gGwI.A
计算
在spss中可以通过方差分析得到组间方差、组内方差、组内自由度、组间自由度,那么MSB=组间方差/组间自由度,MSW=组内方差/组内自由度,
ICC(1)= (MSB-MSW)/{MSB+[(K-1)*MSW]},k为组数
icc(2)=MSB-MSW/MSB
In each dataset, you then need to open the Analyze menu, select Scale, and click onReliability Analysis. Move all of your rater variables to the right for analysis. Click Statisticsand check Intraclass correlation coefficient at the bottom. Specify your model (One-Way Random, Two-Way Random, or Two-Way Mixed) and type (Consistency or Absolute Agreement). Click Continue and OK. You should end up with something like this:
Results of a Two-Way Random Consistency ICC Calculation in SPSS
In this example, I computed an ICC(2) with 4 raters across 20 ratees. You can find the ICC(2,1) in the first line – ICC(2,1) = .169. That means ICC(2, k), which in this case is ICC(2, 4) = .449. Therefore, 44.9% of the variance in the mean of these raters is “real”.
So here’s the summary of this whole process:
1. Decide which category of ICC you need.
i. Determine if you have consistent raters across all ratees (e.g. always 3 raters, and always the same 3 raters). If not, use ICC(1), which is “One-way Random” in SPSS.
ii. Determine if you have a population of raters. If yes, use ICC(3), which is “Two-Way Mixed” in SPSS.
iii. If you didn’t use ICC(1) or ICC(3), you need ICC(2), which assumes a sample of raters, and is “Two-Way Random” in SPSS.
Determine which value you will ultimately use.
. If a single individual, you want ICC(#,1), which is “Single Measure” in SPSS.
i. If the mean, you want ICC(#,k), which is “Average Measures” in SPSS.
Determine which set of values you ultimately want the reliability for.
. If you want to use the subsequent values for other analyses, you probably want to assess consistency.
i. If you want to know the reliability of individual scores, you probably want to assess absolute agreement.
Run the analysis in SPSS.
. Analyze>Scale>Reliability Analysis.
i. Select Statistics.
ii. Check “Intraclass correlation coefficient”.
iii. Make choices as you decided above.
iv. Click Continue.
v. Click OK.
vi. Interpret output.
Intraclass Correlations (ICC) and Interrater Reliability in SPSS http://neoacademic.com/2011/11/16/computing-intraclass-correlations-icc-as-estimates-of-interrater-reliability-in-spss/
用SPSS来计算Rwg的程序
2005年11月3日
李超平
李超平教授学术网站 » 用SPSS来计算Rwg的程序 http://www.lichaoping.com/obhrresearchmethods/statistics/10.html
https://m.sciencenet.cn/blog-3383728-1195485.html
上一篇:三年前,我的入学
下一篇:[转载]培养独立思考的教育-阿尔伯特•爱因斯坦