博文
万能转换:R图和统计表转成发表级的Word、PPT、Excel、HTML、Latex、矢量图等
|||
R包export可以轻松的将R绘制的图和统计表输出到Microsoft Office(Word,PowerPoint和Excel),HTML和Latex中,其质量可以直接用于发表。
特点
可以用命令将交互式R图或
ggplot2,Lattice或base R保存到Microsoft Word,Powerpoint或其他各种位图或矢量格式。完全可编辑的简报矢量格式输出,支持手动整理绘图布局。
将统计分析的输出保存为的Excel,Word,PowerPoint中,乳胶或HTML文档的表格形式。
自定义ř输出格式。
安装
export包可以在Windows中,Ubuntu的和苹果机上跨平台运行不过有些Mac的发行版默认情况下没有安装开罗设备,需要自行安装如果Mac的用户已安装XQuartz,这个问题就解决了,它可以从HTTPS:// www.xquartz.org/免费获得。
官方CRAN发布
install.packages("export")该包主要包括以下几种转换
graph2bitmap
graph2office
graph2vector
rgl2bitmap转换3D图
table2office
table2spreadsheet
table2tex
graph2bitmap:将当前R图保存到bmp文件中graph2png:将当前R图保存到png文件中graph2tif:将当前R图保存到TIF文件中graph2jpg:将当前R图保存为JPEG文件
使用帮助信息如下:
graph2bitmap(x = NULL, file = "Rplot", fun = NULL, type = c("PNG","JPG", "TIF"),
        aspectr = NULL, width = NULL, height = NULL, dpi = 300,scaling = 100,
        font =ifelse(Sys.info()["sysname"] == "Windows", "Arial",
        "Helvetica")[[1]], bg = "white", cairo = TRUE,
        tiffcompression = c("lzw", "rle", "jpeg", "zip", "lzw+p", "zip+p"),
jpegquality = 99, ...)aspectr:期望纵横比。如果设置为空,则使用图形设备的纵横比。width:所需宽度(英寸);可以与期望的纵横比aspectr组合。height:所需高度(英寸);可以与期望的纵横比aspectr组合。scaling:按一定比例缩放宽度和高度。font:PNG和TIFF输出中标签所需的字体; 的Windows系统默认为宋体,其他系统默认为黑体。bg:所需的背景颜色,例如“白色”或“透明”。cairo:逻辑,指定是否使用Cairographics导出。tiffcompression:用于TIF文件的压缩。jpegquality:JPEG压缩的质量。
准备开始
完安装 export包后,先调用该包
library(export)
用ggplot2绘图
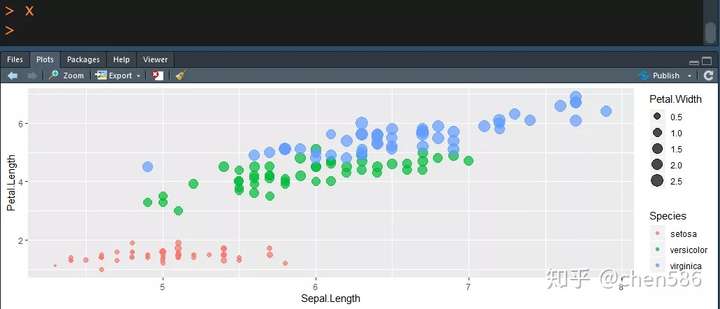
library(ggplot2)
library(datasets)

x=qplot(Sepal.Length, Petal.Length, data = iris,
        color = Species, size = Petal.Width, alpha = I(0.7))
qplot()的意思是快速作图,利用它可以很方便的创建各种复杂的图形,其他系统需要好几行代码才能解决的问题,用qplot只需要一行就能完成。
使用半透明的颜色可以有效减少图形元素重叠的现象,要创建半透明的颜色,可以使用alpha图形属性,其值从0(完全透明)到1(完全不透明)。更多ggplot2绘图见ggplot2高效实用指南(可视化脚本,工具,套路,配色) (往期教程更有很多生物信息相关的例子)。
鸢尾花(iris)是数据挖掘常用到的一个数据集,包含150个鸢尾花的信息,每50个取自三个鸢尾花种之一(setosa,versicolour或virginica)。每个花的特征用下面的5种属性描述萼片长度(Sepal.Length),萼片宽度(Sepal.Width),花瓣长度(Petal.Length),花瓣宽度(Petal.Width),类(Species)。
在console里展示数据图(长宽比自己调节):
导出图形对象
# 需运行上面的ggplot2绘图
# Create a file name
# 程序会自动加后缀
filen <- "output_filename" # or
# filen <- paste("YOUR_DIR/ggplot")
# There are 3 ways to use graph2bitmap():
### 1. Pass the plot as an object
graph2png(x=x, file=filen, dpi=400, height = 5, aspectr=4)
graph2tif(x=x, file=filen, dpi=400, height = 5, aspectr=4)
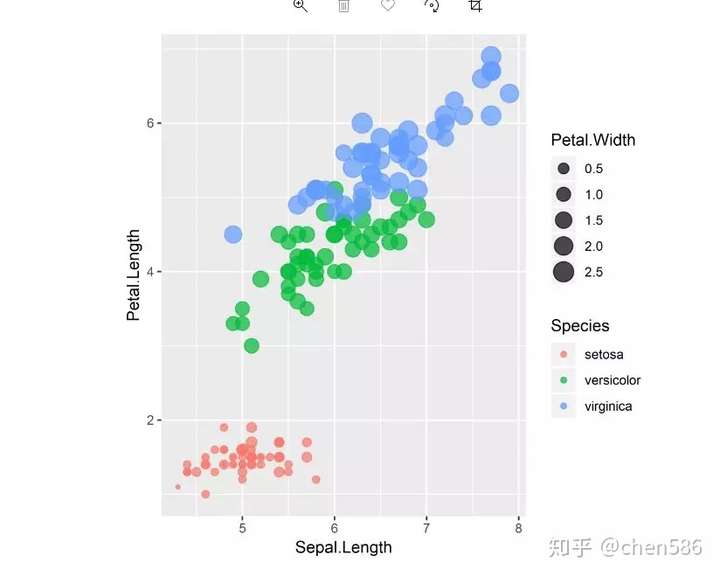
graph2jpg(x=x, file=filen, dpi=400, height = 5, aspectr=4)导出当前绘图窗口展示的图
### 2. Get the plot from current screen device

# 注意这个x,是运行命令,展示图像
x
graph2png(file=filen, dpi=400, height = 5, aspectr=4)
graph2tif(file=filen, dpi=400, height = 5, aspectr=4)
graph2jpg(file=filen, dpi=400, height = 5, aspectr=4)
导出自定义函数输出的一组图
### 3. Pass the plot as a functio
plot.fun <- function(){
  print(qplot(Sepal.Length, Petal.Length, data = iris,
              color = Species, size = Petal.Width, alpha = 0.7))
}
graph2png(file=filen, fun=plot.fun, dpi=400, height = 5, aspectr=4)
graph2tif(file=filen, fun=plot.fun, dpi=400, height = 5, aspectr=4)
graph2jpg(file=filen, fun=plot.fun, dpi=400, height = 5, aspectr=4)
转换后的图形:
与办公室系列的交互
大部分图的细节修改都是用代码完成的,不需要后续的修饰;但如果某一些修改比较特异,不具有程序的通用性特征,或实现起来比较困难,就可以考虑后期修改比如用AI 文章用图的修改和排版。熟悉PPT的,也可以用PPT,这时ř的图导出PPT,用到就要graph2office系列函数了。
graph2ppt:将当前R图保存到Microsoft Office PowerPoint / LibreOffice Impress演示文稿中。
graph2doc:将当前的R图保存到Microsoft Office Word / LibreOffice Writer文档中。
函数参数展示和解释
graph2office(x = NULL, file = "Rplot", fun = NULL, type = c("PPT", "DOC"),
        append = FALSE, aspectr = NULL, width = NULL, height = NULL,scaling = 100,
        paper = "auto", orient = ifelse(type[1] == "PPT","landscape", "auto"),
        margins = c(top = 0.5, right = 0.5, bottom = 0.5, left= 0.5),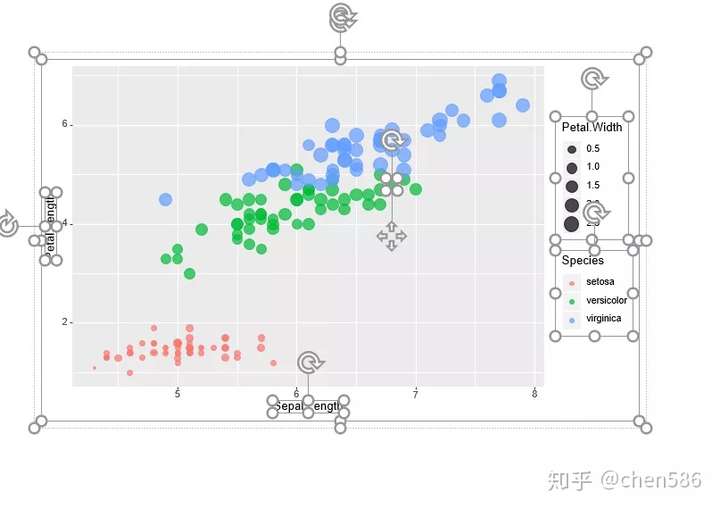
center = TRUE, offx = 1, offy = 1, upscale = FALSE, vector.graphic = TRUE, ...)margins:预设留白边距向量。paper:纸张尺寸 - “A5”至“A1”用于Powerpoint导出,或“A5”至“A3”用于Word输出;默认“auto”自动选择适合您的图形的纸张大小。如果图太大,无法在给定的纸张大小上显示,则按比例缩小。orient:所需的纸张方向 - “自动”,“纵向”或“横向”; 字输出默认为“自动”,简报默认为“横向”。vector.graphic:指定是否以可编辑的向量DrawingML格式输出。默认值为TRUE,在这种情况下,编辑Powerpoint或Word中的图形时,可以先对对图形元素进行分组。如果设置为FALSE,则将该图以300 dpi的分辨率栅格化为PNG位图格式。(栅(shān)格化,是PS中的一个专业术语,栅格即像素,栅格化即即矢量图形转化为位图。)
同样有3种导出方式
# 需运行上面的ggplot2绘图
# Create a file name
filen <- "output_filename" # or
# filen <- paste("YOUR_DIR/ggplot")
# There are 3 ways to use graph2office():
### 1. Pass the plot as an object
# 导出图形对象
graph2ppt(x=x, file=filen)
graph2doc(x=x, file=filen, aspectr=0.5)
### 2. Get the plot from current screen device
# 导出当前预览窗口呈现的图
x
graph2ppt(file=filen, width=9, aspectr=2, append = TRUE)
graph2doc(file=filen, aspectr=1.7, append =TRUE)
### 3. Pass the plot as a function
# 导出自定义函数输出的一系列图
graph2ppt(fun=plot.fun, file=filen, aspectr=0.5, append = TRUE)
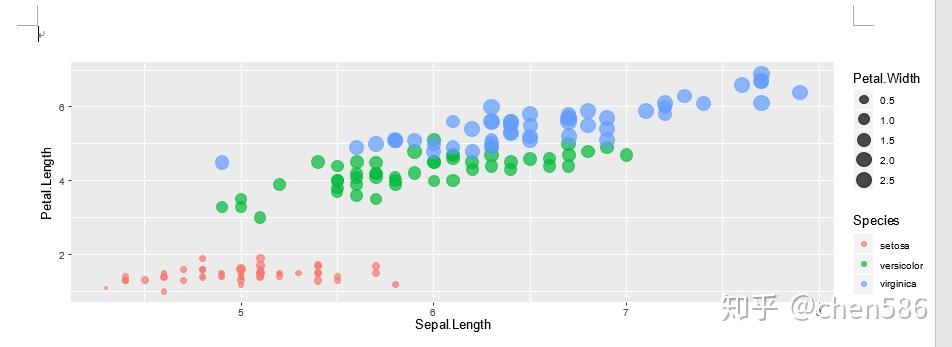
graph2doc(fun=plot.fun, file=filen, aspectr=0.5, append = TRUE)导出到办公室(PPT和字)中的图形,是可编辑的:
其它导出到PPT的例子(设置长宽比)
graph2ppt(file="ggplot2_plot.pptx", aspectr=1.7)
增加第二张同样的图,9英寸宽和A4长宽比的幻灯片(append = T,追加)
graph2ppt(file="ggplot2_plot.pptx", width=9, aspectr=sqrt(2), append=TRUE)
添加相同图形的第三张幻灯片,宽度和高度固定
graph2ppt(file="ggplot2_plot.pptx", width=6, height=5, append=TRUE)
禁用矢量化图像导出
graph2ppt(x=x, file=filen, vector.graphic=FALSE, width=9, aspectr=sqrt(2), append = TRUE)
用图填满幻灯片
graph2ppt(x=x, file=filen, margins=0, upscale=TRUE, append=TRUE)
输出矢量图
graph2svg:将当前的R图保存为SVG格式graph2pdf:将当前的R图保存为PDF格式graph2eps:将当前的R图保存为EPS格式
函数参数解释
graph2vector(x = NULL, file = "Rplot", fun = NULL, type = "SVG",aspectr = NULL,
        width = NULL, height = NULL, scaling = 100,
        font = ifelse(Sys.info()["sysname"] == "Windows",
        "Arial","Helvetica")[[1]], bg = "white", colormodel = "rgb",
        cairo = TRUE,fallback_resolution = 600, ...)
fallback_resolution:dpi中的分辨率用于栅格化不支持的矢量图形。
#需运行上面的ggplot2绘图
# Create a file name
filen <- "output_filename" # or
# filen <- paste("YOUR_DIR/ggplot")
# There are 3 ways to use graph2vector():
### 1. Pass the plot as an object
# 导出图形对象
graph2svg(x=x, file=filen, aspectr=2, font = "Times New Roman",
height = 5, bg = "white")
graph2pdf(x=x, file=filen, aspectr=2, font = "Arial",
height = 5, bg = "transparent")
graph2eps(x=x, file=filen, aspectr=2, font = "Arial",
height = 5, bg = "transparent")
# 导出当前预览窗口呈现的图
### 2. Get the plot from current screen device
x
graph2svg(file=filen, aspectr=2, font = "Arial",
height = 5, bg = "transparent")
graph2pdf(file=filen, aspectr=2, font = "Times New Roman",
height = 5, bg = "white")
graph2eps(file=filen, aspectr=2, font = "Times New Roman",
height = 5, bg = "white")
# 导出自定义函数输出的一系列图
### 3. Pass the plot as a function
graph2svg(file=filen, fun = plot.fun, aspectr=2, font = "Arial",
height = 5, bg = "transparent")
graph2pdf(file=filen, fun=plot.fun, aspectr=2, font = "Arial",
height = 5, bg = "transparent")
graph2eps(file=filen, fun=plot.fun, aspectr=2, font = "Arial",
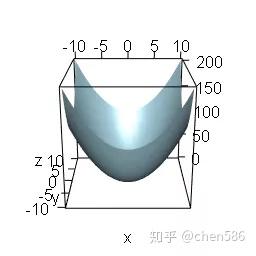
height = 5, bg = "transparent")转换3D图形
rgl2png:将当前的rgl 3D图形保存为PNG格式。
rgl2bitmap(file = "Rplot", type = c("PNG"))
# Create a file name
filen <- tempfile("rgl") # or
# filen <- paste("YOUR_DIR/rgl")
# Generate a 3D plot using 'rgl'
x = y = seq(-10, 10, length = 20)
z = outer(x, y, function(x, y) x^2 + y^2)
rgl::persp3d(x, y, z, col = 'lightblue')
# Save the plot as a png
rgl2png(file = filen)
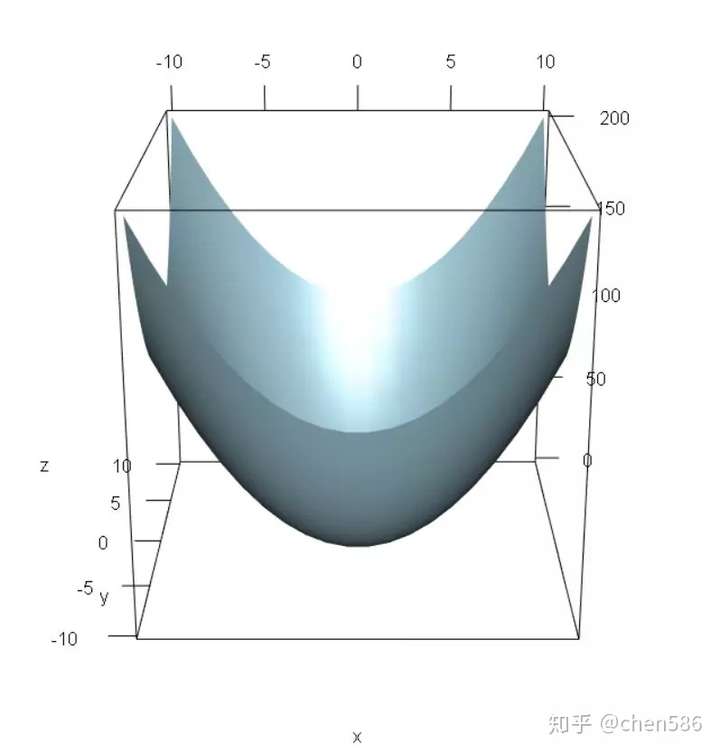
# Note that omitting 'file' will save in current directory生成的3D图形:
将生成的3D图形保存为PNG格式:
输出统计结果到表格 table2spreadsheet
table2excel:导出统计输出到Microsoft Office Excel / LibreOffice Calc电子表格中的一个表。table2csv:将统计输出以CSV格式导出到表中(“”“”,表示值分隔,表示小数)table2csv2:将统计输出以CSV格式导出到表中(“;”表示值分隔,“,”表示小数)
table2spreadsheet(x = NULL, file = "Rtable", type = c("XLS", "CSV",
  "CSV2"), append = FALSE, sheetName = "new sheet", digits = 2,
digitspvals = 2, trim.pval = TRUE, add.rownames = FALSE, ...)sheetName:一个字符串,给出创建的新工作表的名称(仅针对类型==“XLS”)。它必须是惟一的(不区分大小写),不受文件中任何现有工作表名称的影响。digits:除具有p值的列外,要显示所有列的有效位数的数目。digitspvals:具有p值的列要显示的有效位数的数目。
# Create a file name
filen <- "table_aov" # or
# filen <- paste("YOUR_DIR/table_aov")
# Generate ANOVA output
fit=aov(yield ~ block + N * P + K, data = npk) # 'npk' dataset from base 'datasets'
x=summary(fit)
# Save ANOVA table as a CSV
### Option 1: pass output as object
# 输出对象
table2csv(x=x,file=filen, digits = 1, digitspvals = 3, add.rownames=TRUE)
# 屏幕输出导出到文件
### Option 2: get output from console
summary(fit)
table2csv(file=filen, digits = 2, digitspvals = 4, add.rownames=TRUE)
# Save ANOVA table as an Excel
# Without formatting of the worksheet
x
table2excel(file=filen, sheetName="aov_noformatting", digits = 1, digitspvals = 3, add.rownames=TRUE)
# 更多参数
# With formatting of the worksheet
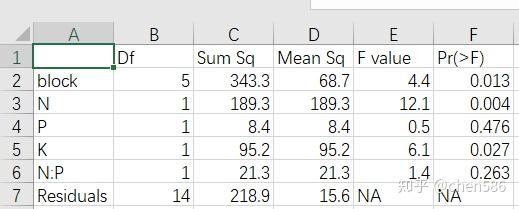
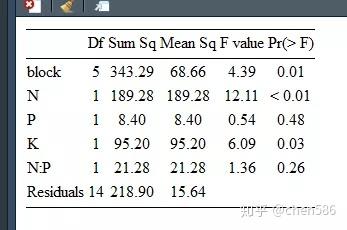
table2excel(x=x,file=filen, sheetName="aov_formated", append = TRUE, add.rownames=TRUE, fontName="Arial", fontSize = 14, fontColour = rgb(0.15,0.3,0.75), border=c("top", "bottom"), fgFill = rgb(0.9,0.9,0.9), halign = "center", valign = "center", textDecoration="italic")原始数据的表格:
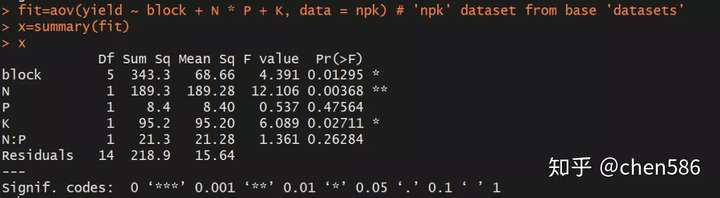
转换格式之后的,在控制台中的数据:
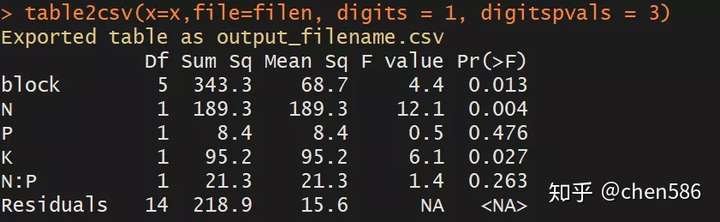
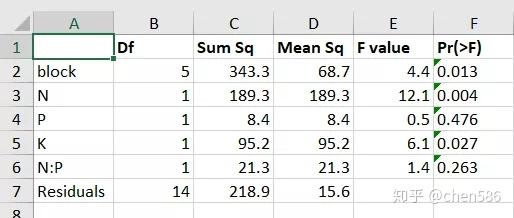
文件(CSV和EXCEL)中表格数据:
导出为字中的表,再也不用复制粘贴调格式了 table2office
table2ppt:导出统计输出到Microsoft Office PowerPoint / LibreOffice Impress演示文稿中的表
table2doc:将统计输出导出到Microsoft Office Word / LibreOffice Writer文档中的表
table2office(x = NULL, file = "Rtable", type = c("PPT", "DOC"),
  append = FALSE, digits = 2, digitspvals = 2, trim.pval = TRUE,
  width = NULL, height = NULL, offx = 1, offy = 1,
  font = ifelse(Sys.info()["sysname"] == "Windows", "Arial",
  "Helvetica")[[1]], pointsize = 12, add.rownames = FALSE)

# Create a file name
filen <- "table_aov"
# filen <- paste("YOUR_DIR/table_aov")

# Generate ANOVA output
fit=aov(yield ~ block + N * P + K, data = npk) # 'npk' dataset from base 'datasets'
# Save ANOVA table as a PPT
### Option 1: pass output as object
x=summary(fit)
table2ppt(x=x,file=filen, digits = 1, digitspvals = 3, add.rownames =TRUE)

### Option 2: get output from console
summary(fit)
table2ppt(x=x,file=filen, width=5, font="Times New Roman", pointsize=14, digits=4, digitspvals=1, append=TRUE, add.rownames =TRUE) # append table to previous slide

# Save ANOVA table as a DOC file
table2doc(x=x,file=filen, digits = 1, digitspvals = 3, add.rownames =TRUE)
summary(fit)
table2doc(file=filen, width=3.5, font="Times New Roman", pointsize=14,  digits=4, digitspvals=1, append=TRUE, add.rownames =TRUE) # append table at end of document
将表格数据导出到PPT和词中:
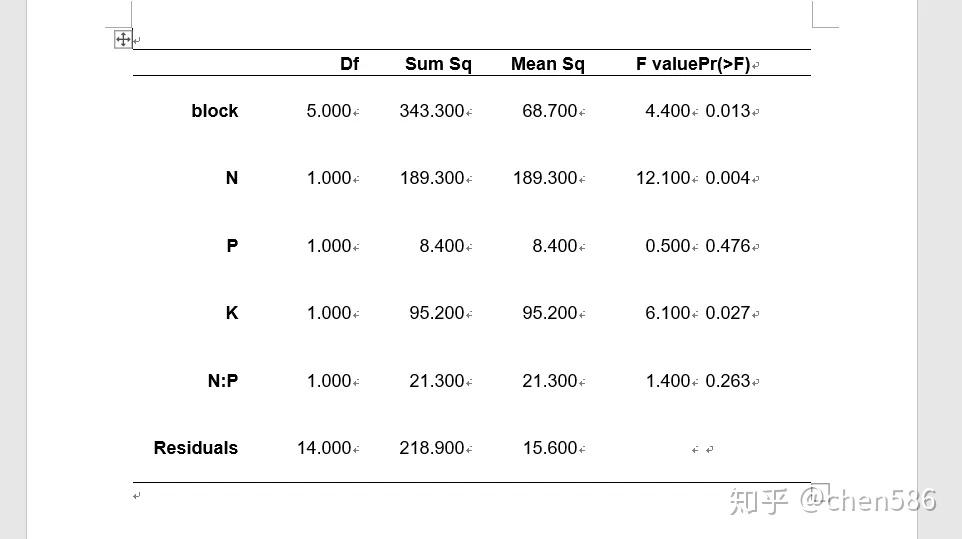
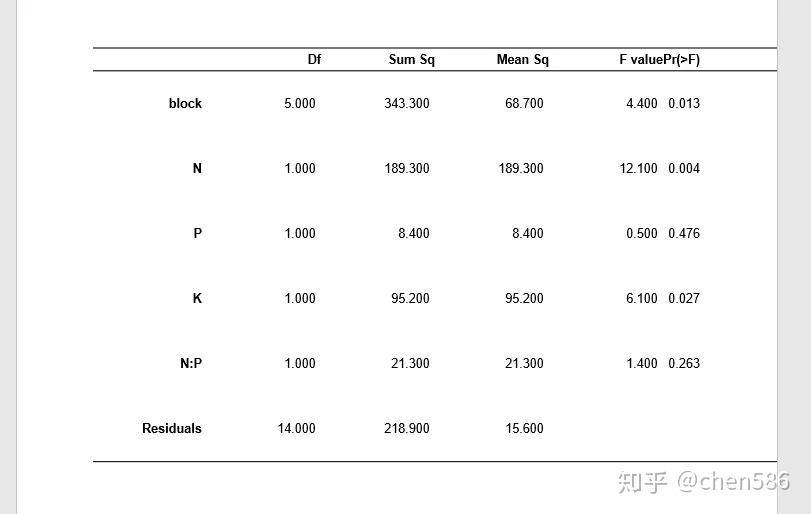
table2tex
table2html:导出统计输出到HTML表。
table2tex(x = NULL, file = "Rtable", type = "TEX", digits = 2,
  digitspvals = 2, trim.pval = TRUE, summary = FALSE, standAlone = TRUE,
  add.rownames = FALSE, ...)
summary:是否汇总数据文件。
standAlone:导出的乳胶代码应该是独立可编译的,还是应该粘贴到另一个文档中。
add.rownames:是否应该将行名添加到表中(在第一列之前插入一列)。
# Create a file name
filen <- tempfile(pattern = "table_aov") # or
# filen <- paste("YOUR_DIR/table_aov")

# Generate ANOVA output
fit=aov(yield ~ block + N * P + K, data = npk) # 'npk' dataset from base 'datasets'
x=summary(fit)

# Export to Latex in standAlone format
table2tex(x=x,file=filen,add.rownames = TRUE)
# Export to Latex to paste in tex document
summary(fit) # get output from the console
table2tex(file=filen, standAlone = FALSE,add.rownames = TRUE)

# Export to HTML
table2html(x=x,file=filen) # or
summary(fit) # get output from the console
table2html(file=filen,add.rownames = TRUE)
导出到HTML或TEX中的表格数据:
https://m.sciencenet.cn/blog-118204-1204530.html
上一篇:这些基因的名字太有才了,研究一下都可以发10分文章
下一篇:知乎阅读三百万的生信学习指南