博文
Visualization of trigonometric functions with gnuplot
|||
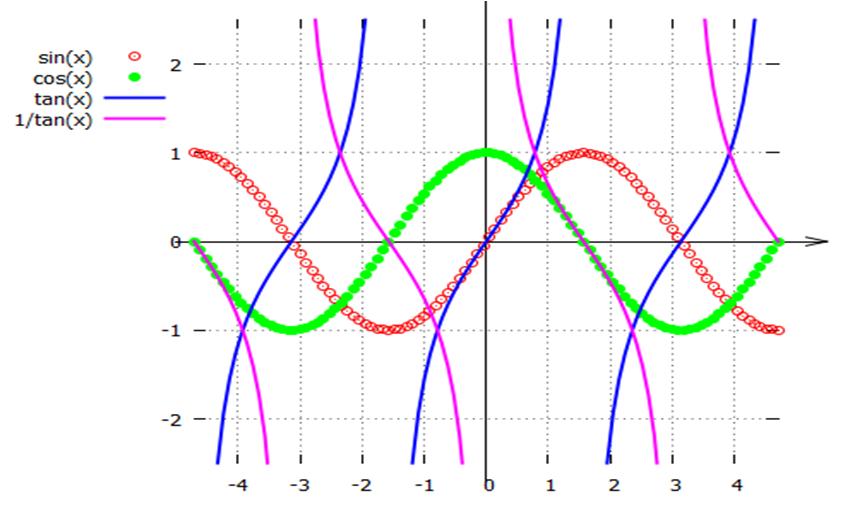
gnuplot script used to generate the above plot:
set yrange [-2.5:2.5]
set xrange [-4.7124:4.7124]
unset border
set arrow from -5,0 to 5.5,0
set arrow from 0,-2.7 to 0,2.8
set key at -5,2.2
set grid
set size square
plot sin(x) w p pt 6, cos(x) w p pt 7, tan(x) lw 2, 1/tan(x) lw 2
==============
Note that there are no cosecant, secant, and cotangent functions in gnuplot - but you can create them yourself by writing:
gnuplot> cosec (x) = 1 / sin (x)
gnuplot> sec (x) = 1 / cos (x)
gnuplot> cot (x) = 1 / tan (x)
More information about gnuplot avaliable at:
http://faraday.elec.uow.edu.au/subjects/spring/ecte212/gnuplot.pdf
https://m.sciencenet.cn/blog-298567-698332.html
上一篇:数学物理方法 -- 资料小结
扫一扫,分享此博文