博文
12月太阳黑子将比11月大幅度增加:有利于疫情高峰结束
||
12月太阳黑子将比11月大幅度增加:有利于疫情高峰结束
吉林大学:杨学祥,杨冬红
2022年11月太阳黑子日均相对数为全年第二低值65.1
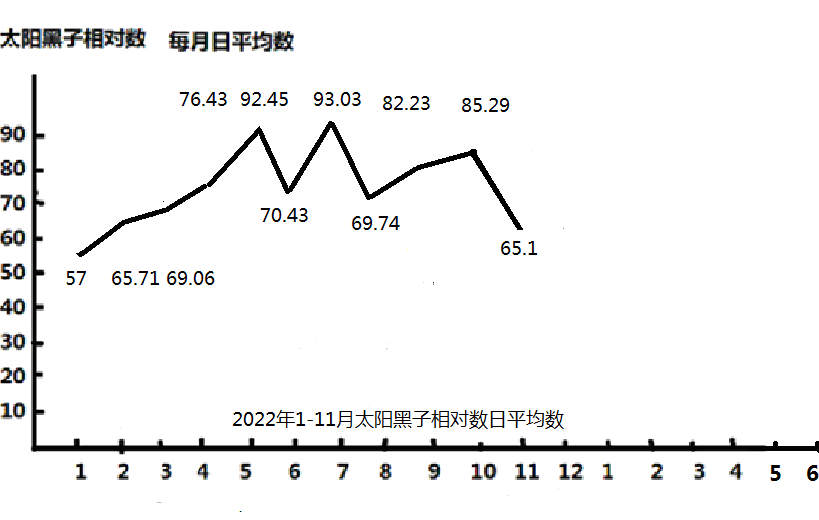
图2 2022年1月至11月太阳黑子相对数日平均数
https://blog.sciencenet.cn/blog-2277-1357609.html
https://blog.sciencenet.cn/blog-2277-1361820.html
https://blog.sciencenet.cn/blog-2277-1366895.html
2022年11月太阳黑子日均相对数最低值为12,最高值为85。2022年12月1-6日太阳黑子日均相对数最低值为49,最高值123(比11月最高值多38)。这预示12月太阳黑子将大幅增多,有利于疫情高峰结束。
https://blog.sciencenet.cn/blog-2277-1366895.html
请关注近三天太阳黑子峰值变化。
:Product: Daily Solar Data DSD.txt
:Issued: 0225 UT 01 Dec 2022
#
# Prepared by theU.S.Dept. of Commerce, NOAA, Space Weather Prediction Center
# Please send comments and suggestions to SWPC.Webmaster@noaa.gov
#
# Last 30 Days Daily Solar Data
#
# Sunspot Stanford GOES15
# Radio SESC Area Solar X-Ray ------ Flares ------
# Flux Sunspot 10E-6 New Mean Bkgd X-Ray Optical
# Date 10.7cm Number Hemis. Regions Field Flux C M X S 1 2 3
#---------------------------------------------------------------------------
2022 11 01 128 63 360 2 -999 * 2 0 0 2 0 0 0
2022 11 02 130 49 280 0 -999 * 3 0 0 4 0 0 0
2022 11 03 125 65 340 1 -999 * 2 0 0 7 0 0 0
2022 11 04 118 81 510 2 -999 * 5 0 0 3 0 0 0
2022 11 05 131 82 480 0 -999 * 0 0 0 0 0 0 0
2022 11 06 131 78 690 1 -999 * 6 1 0 1 0 0 0
2022 11 07 135 80 860 1 -999 * 2 0 0 0 0 0 0
2022 11 08 132 85 730 0 -999 * 1 0 0 2 0 0 0
2022 11 09 138 81 685 1 -999 * 3 0 0 5 0 0 0
2022 11 10 139 79 750 1 -999 * 5 0 0 5 0 0 0
2022 11 11 138 57 750 0 -999 * 15 2 0 15 1 0 0
2022 11 12 138 65 750 0 -999 * 6 1 0 7 2 0 0
2022 11 13 137 74 540 1 -999 * 14 0 0 8 2 0 0
2022 11 14 142 77 890 0 -999 * 12 0 0 13 1 0 0
2022 11 15 134 69 810 0 -999 * 16 1 0 5 1 0 0
2022 11 16 133 85 850 2 -999 * 8 0 0 4 0 0 0
2022 11 17 119 64 370 1 -999 * 8 0 0 8 0 0 0
2022 11 18 116 55 410 1 -999 * 9 0 0 8 0 0 0
2022 11 19 115 59 440 0 -999 * 7 1 0 9 0 0 0
2022 11 20 119 72 520 0 -999 * 1 0 0 10 0 0 0
2022 11 21 117 83 410 1 -999 * 5 0 0 5 0 0 0
2022 11 22 116 61 410 0 -999 * 10 0 0 5 0 0 0
2022 11 23 113 68 440 1 -999 * 3 0 0 3 0 0 0
2022 11 24 110 61 410 0 -999 * 0 0 0 6 0 0 0
2022 11 25 109 55 210 0 -999 * 1 0 0 2 0 0 0
2022 11 26 107 60 350 0 -999 * 0 0 0 0 0 0 0
2022 11 27 107 56 150 0 -999 * 0 0 0 0 0 0 0
2022 11 28 107 52 170 0 -999 * 0 0 0 4 0 0 0
2022 11 29 108 25 100 0 -999 * 3 0 0 7 0 0 0
2022 11 30 111 12 10 0 -999 * 8 0 0 1 0 0 1
:Product: Daily Solar Data DSD.txt
:Issued: 0225 UT 07 Dec 2022
#
# Prepared by theU.S.Dept. of Commerce, NOAA, Space Weather Prediction Center
# Please send comments and suggestions to SWPC.Webmaster@noaa.gov
#
# Last 30 Days Daily Solar Data
#
# Sunspot Stanford GOES15
# Radio SESC Area Solar X-Ray ------ Flares ------
# Flux Sunspot 10E-6 New Mean Bkgd X-Ray Optical
# Date 10.7cm Number Hemis. Regions Field Flux C M X S 1 2 3
#---------------------------------------------------------------------------
2022 11 07 135 80 860 1 -999 * 2 0 0 0 0 0 0
2022 11 08 132 85 730 0 -999 * 1 0 0 2 0 0 0
2022 11 09 138 81 685 1 -999 * 3 0 0 5 0 0 0
2022 11 10 139 79 750 1 -999 * 5 0 0 5 0 0 0
2022 11 11 138 57 750 0 -999 * 15 2 0 15 1 0 0
2022 11 12 138 65 750 0 -999 * 6 1 0 7 2 0 0
2022 11 13 137 74 540 1 -999 * 14 0 0 8 2 0 0
2022 11 14 142 77 890 0 -999 * 12 0 0 13 1 0 0
2022 11 15 134 69 810 0 -999 * 16 1 0 5 1 0 0
2022 11 16 133 85 850 2 -999 * 8 0 0 4 0 0 0
2022 11 17 119 64 370 1 -999 * 8 0 0 8 0 0 0
2022 11 18 116 55 410 1 -999 * 9 0 0 8 0 0 0
2022 11 19 115 59 440 0 -999 * 7 1 0 9 0 0 0
2022 11 20 119 72 520 0 -999 * 1 0 0 10 0 0 0
2022 11 21 117 83 410 1 -999 * 5 0 0 5 0 0 0
2022 11 22 116 61 410 0 -999 * 10 0 0 5 0 0 0
2022 11 23 113 68 440 1 -999 * 3 0 0 3 0 0 0
2022 11 24 110 61 410 0 -999 * 0 0 0 6 0 0 0
2022 11 25 109 55 210 0 -999 * 1 0 0 2 0 0 0
2022 11 26 107 60 350 0 -999 * 0 0 0 0 0 0 0
2022 11 27 107 56 150 0 -999 * 0 0 0 0 0 0 0
2022 11 28 107 52 170 0 -999 * 0 0 0 4 0 0 0
2022 11 29 108 25 100 0 -999 * 3 0 0 7 0 0 0
2022 11 30 111 12 10 0 -999 * 8 0 0 1 0 0 1
2022 12 01 119 49 330 3 -999 * 5 1 0 0 1 0 0
2022 12 02 124 66 1010 1 -999 * 5 0 0 1 0 0 0
2022 12 03 134 68 1170 1 -999 * 11 1 0 1 0 0 0
2022 12 04 144 93 1620 1 -999 * 6 0 0 3 0 0 0
2022 12 05 150 89 1160 0 -999 * 10 0 0 12 0 0 0
2022 12 06 144 123 1060 2 -999 * 2 0 0 0 0 0 0
https://m.sciencenet.cn/blog-2277-1366933.html
上一篇:12月7日晚报:厄尔尼诺指数减速变慢与12月8-12日强潮汐组合精准对应
下一篇:12月7日夜报:厄尔尼诺指数减速变慢与12月8-12日强潮汐组合精准对应