ВЉЮФ
Ъ§ОнећРэКЭЦДЭМаЁР§
|
library("lubridate")
library("tidyverse")
ec2 <- economics %>%
as_tibble() %>%
transmute(year=year(date),month=month(date),rate=uempmed) %>%
filter(year>2005) %>%
spread(year,rate)
ec2 <- gather(ec2,key=year,value = unemp, '2006':'2015',convert = TRUE,na.rm = TRUE)
p1 <- ggplot(ec2,aes(year+(month-1)/12,unemp))+
geom_line()
p2 <- ggplot(ec2,aes(month,unemp,group=year))+
geom_line(aes(colour=year),size=1)
library(ggpubr)
ggarrange(p1, p2,labels = c("A", "B"),
ncol = 2, nrow = 1)
ggsave("11.tiff",width = 16,height = 10,units=c("cm"),dpi=300)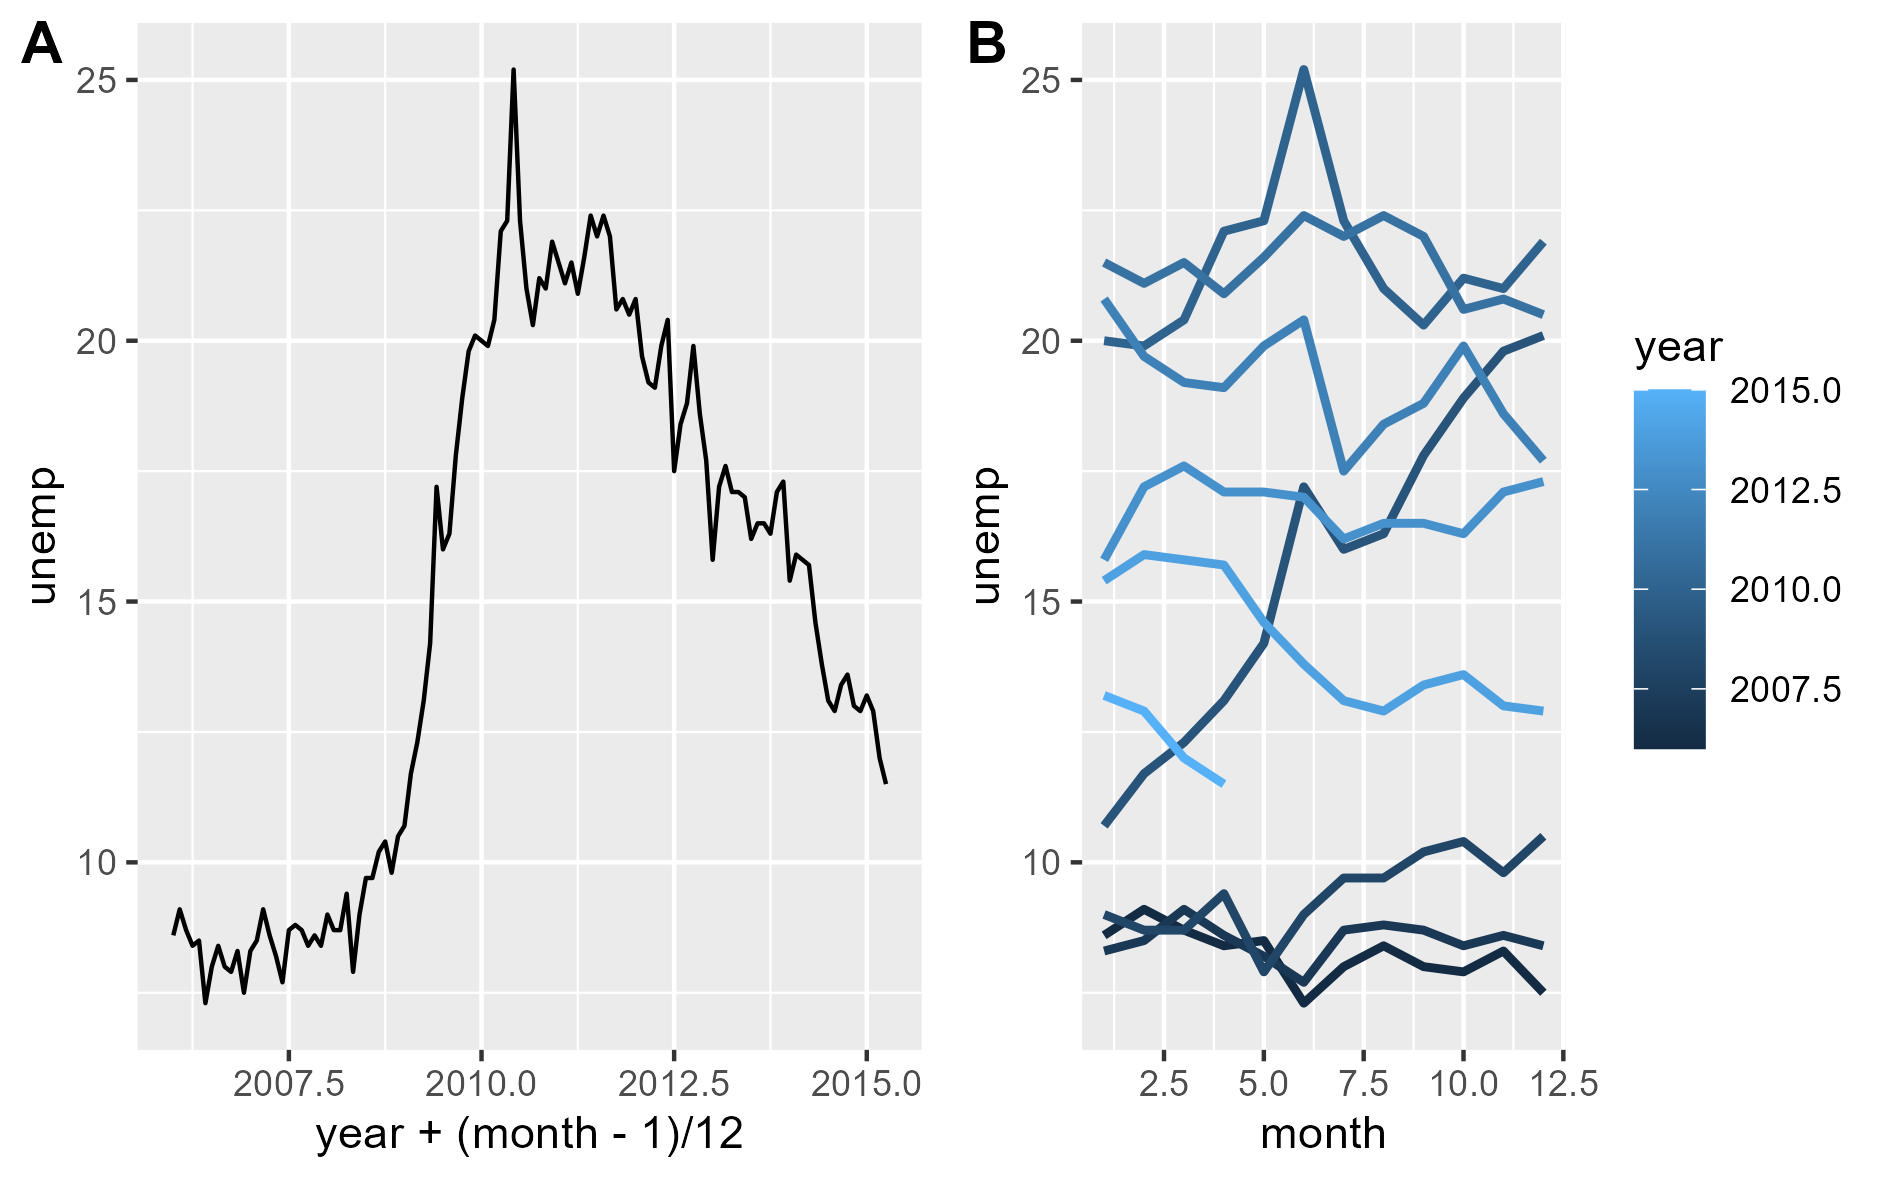
https://m.sciencenet.cn/blog-3509182-1366418.html
ЩЯвЛЦЊЃКggplot2ЕФКЏЪ§ЪНБрГЬ
ЩЈвЛЩЈЃЌЗжЯэДЫВЉЮФ