博文
[转载]Placing Colorbars
|||
Colorbar
Colorbars indicate the quantitative extent of image data. Placing in a figure is non-trivial because room needs to be made for them.
The simplest case is just attaching a colorbar to each axes:
import matplotlib.pyplot as pltimport numpy as np# Fixing random state for reproducibilitynp.random.seed(19680801)fig, axs = plt.subplots(2, 2)cmaps = ['RdBu_r', 'viridis']for col in range(2):
    for row in range(2):
        ax = axs[row, col]
        pcm = ax.pcolormesh(np.random.random((20, 20)) * (col + 1),
                            cmap=cmaps[col])
        fig.colorbar(pcm, ax=ax)plt.show()

The first column has the same type of data in both rows, so it may
be desirable to combine the colorbar which we do by callingFigure.colorbar with a list of axes instead of a single axes.
fig, axs = plt.subplots(2, 2)cmaps = ['RdBu_r', 'viridis']for col in range(2):
    for row in range(2):
        ax = axs[row, col]
        pcm = ax.pcolormesh(np.random.random((20, 20)) * (col + 1),
                            cmap=cmaps[col])
    fig.colorbar(pcm, ax=axs[:, col], shrink=0.6)plt.show()

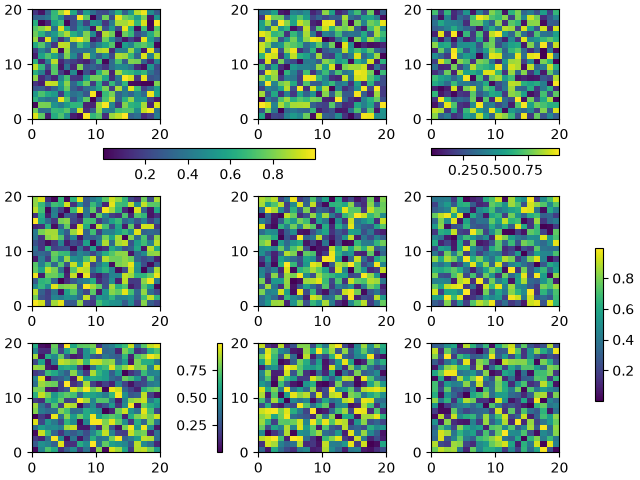
Relatively complicated colorbar layouts are possible using this
paradigm. Note that this example works far better withconstrained_layout=True
fig, axs = plt.subplots(3, 3, constrained_layout=True)for ax in axs.flat:
    pcm = ax.pcolormesh(np.random.random((20, 20)))fig.colorbar(pcm, ax=axs[0, :2], shrink=0.6, location='bottom')fig.colorbar(pcm, ax=[axs[0, 2]], location='bottom')fig.colorbar(pcm, ax=axs[1:, :], location='right', shrink=0.6)fig.colorbar(pcm, ax=[axs[2, 1]], location='left')plt.show()

Colorbars with fixed-aspect-ratio axes
Placing colorbars for axes with a fixed aspect ratio pose a particular challenge as the parent axes changes size depending on the data view.
fig, axs = plt.subplots(2, 2,  constrained_layout=True)cmaps = ['RdBu_r', 'viridis']for col in range(2):
    for row in range(2):
        ax = axs[row, col]
        pcm = ax.pcolormesh(np.random.random((20, 20)) * (col + 1),
                            cmap=cmaps[col])
        if col == 0:
            ax.set_aspect(2)
        else:
            ax.set_aspect(1/2)
        if row == 1:
            fig.colorbar(pcm, ax=ax, shrink=0.6)plt.show()

One way around this issue is to use an Axes.inset_axes to locate the
axes in axes coordinates. Note that if you zoom in on the axes, and
change the shape of the axes, the colorbar will also change position.
fig, axs = plt.subplots(2, 2, constrained_layout=True)cmaps = ['RdBu_r', 'viridis']for col in range(2):
    for row in range(2):
        ax = axs[row, col]
        pcm = ax.pcolormesh(np.random.random((20, 20)) * (col + 1),
                            cmap=cmaps[col])
        if col == 0:
            ax.set_aspect(2)
        else:
            ax.set_aspect(1/2)
        if row == 1:
            cax = ax.inset_axes([1.04, 0.2, 0.05, 0.6], transform=ax.transAxes)
            fig.colorbar(pcm, ax=ax, cax=cax)plt.show()
Total running time of the script: ( 0 minutes 4.387 seconds)
Download Python source code: colorbar_placement.py
Download Jupyter notebook: colorbar_placement.ipynb
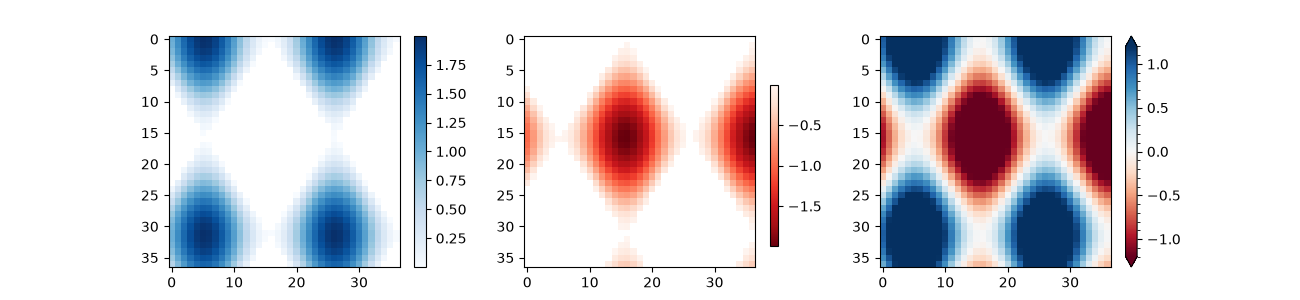
import numpy as npimport matplotlib.pyplot as plt# setup some generic dataN = 37x, y = np.mgrid[:N, :N]Z = (np.cos(x*0.2) + np.sin(y*0.3))# mask out the negative and positive values, respectivelyZpos = np.ma.masked_less(Z, 0)Zneg = np.ma.masked_greater(Z, 0)fig, (ax1, ax2, ax3) = plt.subplots(figsize=(13, 3), ncols=3)# plot just the positive data and save the# color "mappable" object returned by ax1.imshowpos = ax1.imshow(Zpos, cmap='Blues', interpolation='none')# add the colorbar using the figure's method,# telling which mappable we're talking about and# which axes object it should be nearfig.colorbar(pos, ax=ax1)# repeat everything above for the negative data# you can specify location, anchor and shrink the colorbarneg = ax2.imshow(Zneg, cmap='Reds_r', interpolation='none')fig.colorbar(neg, ax=ax2, location='right', anchor=(0, 0.3), shrink=0.7)# Plot both positive and negative values between +/- 1.2pos_neg_clipped = ax3.imshow(Z, cmap='RdBu', vmin=-1.2, vmax=1.2,
                             interpolation='none')# Add minorticks on the colorbar to make it easy to read the# values off the colorbar.cbar = fig.colorbar(pos_neg_clipped, ax=ax3, extend='both')cbar.minorticks_on()plt.show()
References
The use of the following functions, methods, classes and modules is shown in this example:
https://m.sciencenet.cn/blog-587102-1321864.html
上一篇:[转载]python plots share common axis
下一篇:[转载]python Mathtext Examples