博文
[转载]python Fonts demo (object-oriented style)
|||
Set font properties using setters.
See Fonts demo (keyword arguments) to achieve the same effect using keyword arguments.
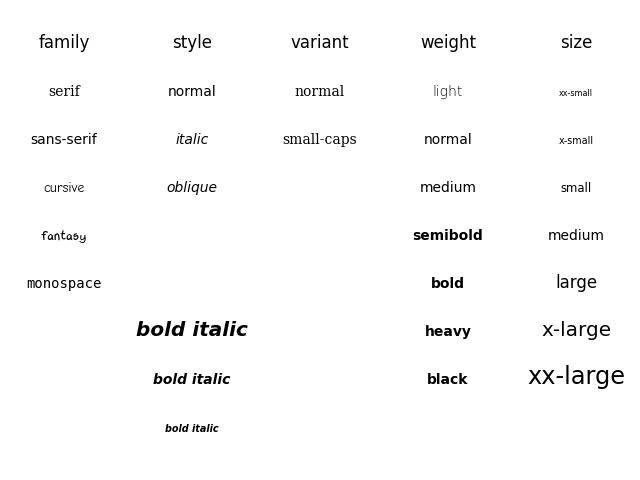
from matplotlib.font_manager import FontPropertiesimport matplotlib.pyplot as pltfont0 = FontProperties()alignment = {'horizontalalignment': 'center', 'verticalalignment': 'baseline'}# Show family optionsfamilies = ['serif', 'sans-serif', 'cursive', 'fantasy', 'monospace']font1 = font0.copy()font1.set_size('large')t = plt.figtext(0.1, 0.9, 'family', fontproperties=font1, **alignment)yp = [0.8, 0.7, 0.6, 0.5, 0.4, 0.3, 0.2]for k, family in enumerate(families):
    font = font0.copy()
    font.set_family(family)
    t = plt.figtext(0.1, yp[k], family, fontproperties=font, **alignment)# Show style optionsstyles = ['normal', 'italic', 'oblique']t = plt.figtext(0.3, 0.9, 'style', fontproperties=font1, **alignment)for k, style in enumerate(styles):
    font = font0.copy()
    font.set_family('sans-serif')
    font.set_style(style)
    t = plt.figtext(0.3, yp[k], style, fontproperties=font, **alignment)# Show variant optionsvariants = ['normal', 'small-caps']t = plt.figtext(0.5, 0.9, 'variant', fontproperties=font1, **alignment)for k, variant in enumerate(variants):
    font = font0.copy()
    font.set_family('serif')
    font.set_variant(variant)
    t = plt.figtext(0.5, yp[k], variant, fontproperties=font, **alignment)# Show weight optionsweights = ['light', 'normal', 'medium', 'semibold', 'bold', 'heavy', 'black']t = plt.figtext(0.7, 0.9, 'weight', fontproperties=font1, **alignment)for k, weight in enumerate(weights):
    font = font0.copy()
    font.set_weight(weight)
    t = plt.figtext(0.7, yp[k], weight, fontproperties=font, **alignment)# Show size optionssizes = ['xx-small', 'x-small', 'small', 'medium', 'large',
         'x-large', 'xx-large']t = plt.figtext(0.9, 0.9, 'size', fontproperties=font1, **alignment)for k, size in enumerate(sizes):
    font = font0.copy()
    font.set_size(size)
t = plt.figtext(0.9, yp[k], size, fontproperties=font, **alignment)# Show bold italicfont = font0.copy()font.set_style('italic')font.set_weight('bold')font.set_size('x-small')t = plt.figtext(0.3, 0.1, 'bold italic', fontproperties=font, **alignment)font = font0.copy()font.set_style('italic')font.set_weight('bold')font.set_size('medium')t = plt.figtext(0.3, 0.2, 'bold italic', fontproperties=font, **alignment)font = font0.copy()font.set_style('italic')font.set_weight('bold')font.set_size('x-large')t = plt.figtext(-0.4, 0.3, 'bold italic', fontproperties=font, **alignment)plt.show()https://m.sciencenet.cn/blog-587102-1321882.html
上一篇:[转载]python Text watermark
下一篇:[转载]python Labelling subplots
扫一扫,分享此博文