博文
[转载]python Labelling subplots
|||
Labelling subplots
Labelling subplots is relatively straightforward, and varies, so Matplotlib does not have a general method for doing this.
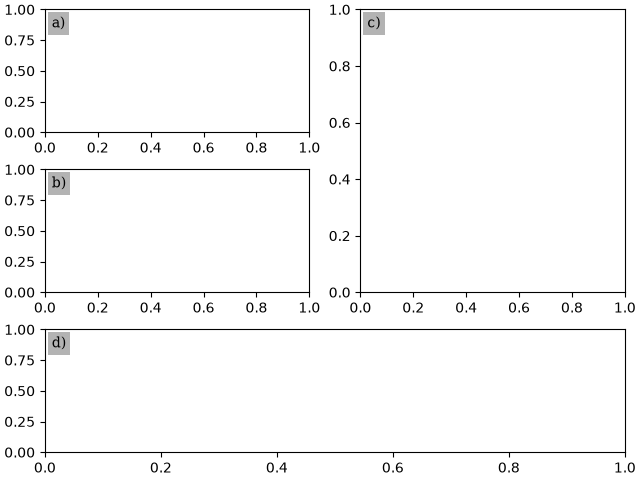
Simplest is putting the label inside the axes. Note, here
we use pyplot.subplot_mosaic, and use the subplot labels
as keys for the subplots, which is a nice convenience. However,
the same method works with pyplot.subplots or keys that are
different than what you want to label the subplot with.
import matplotlib.pyplot as pltimport matplotlib.transforms as mtransformsfig, axs = plt.subplot_mosaic([['a)', 'c)'], ['b)', 'c)'], ['d)', 'd)']],
                              constrained_layout=True)for label, ax in axs.items():
    # label physical distance in and down:
    trans = mtransforms.ScaledTranslation(10/72, -5/72, fig.dpi_scale_trans)
    ax.text(0.0, 1.0, label, transform=ax.transAxes + trans,
            fontsize='medium', verticalalignment='top', fontfamily='serif',
            bbox=dict(facecolor='0.7', edgecolor='none', pad=3.0))plt.show()
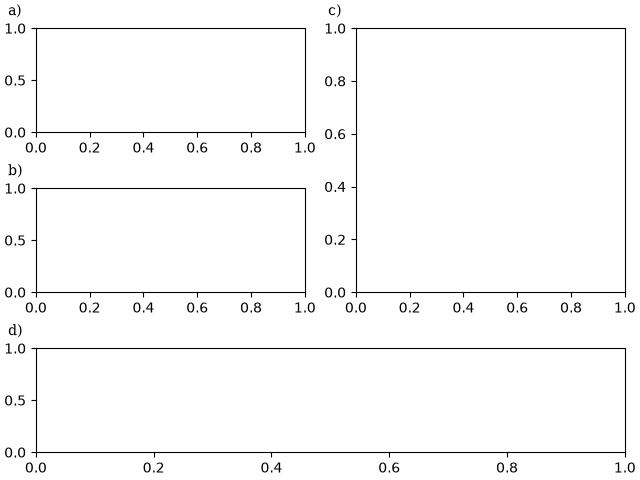
We may prefer the labels outside the axes, but still aligned with each other, in which case we use a slightly different transform:
fig, axs = plt.subplot_mosaic([['a)', 'c)'], ['b)', 'c)'], ['d)', 'd)']],
                              constrained_layout=True)for label, ax in axs.items():
    # label physical distance to the left and up:
    trans = mtransforms.ScaledTranslation(-20/72, 7/72, fig.dpi_scale_trans)
    ax.text(0.0, 1.0, label, transform=ax.transAxes + trans,
            fontsize='medium', va='bottom', fontfamily='serif')plt.show()
If we want it aligned with the title, either incorporate in the title or use the loc keyword argument:
fig, axs = plt.subplot_mosaic([['a)', 'c)'], ['b)', 'c)'], ['d)', 'd)']],
                              constrained_layout=True)for label, ax in axs.items():
    ax.set_title('Normal Title', fontstyle='italic')
    ax.set_title(label, fontfamily='serif', loc='left', fontsize='medium')plt.show()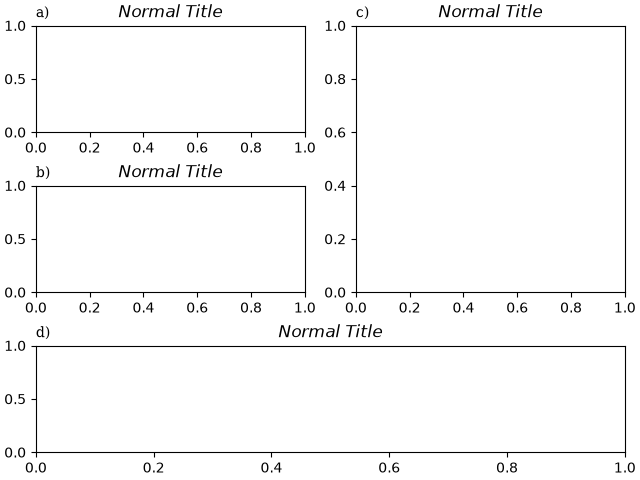
References
The use of the following functions, methods, classes and modules is shown in this example:
Total running time of the script: ( 0 minutes 1.792 seconds)
Download Python source code: label_subplots.py
Download Jupyter notebook: label_subplots.ipynb
Keywords: matplotlib code example, codex, python plot, pyplot
https://m.sciencenet.cn/blog-587102-1321883.html
上一篇:[转载]python Fonts demo (object-oriented style)
下一篇:[转载]python Bayesian Methods for Hackers style sheet