博文
matplotlib scatter画空心彩色marker
||
import numpy as np
import matplotlib.pyplot as plt
from matplotlib import cm
import matplotlib as mpl

def plot01():

    dat0=np.loadtxt('data01_forplt.txt', delimiter=',')
    tt, xx, yy, dx, dy = dat0.T

    fig = plt.figure()
    ax = fig.add_subplot(111)
    ax.scatter(xx, dx, marker='x', c=tt, cmap='jet', label='dx')
    #使用tt作为color数据。


    tt_cc = cm.ScalarMappable(norm=mpl.colors.Normalize(), cmap='jet')
    #根据ScalarMappable参数要求,norm输入为mpl.colors.Normalize的一实例,cmap可以通过字符串指定。
    #tt_cf = tt_cc.to_rgba
    #tt_cm = tt_cf(tt)
    tt_cm = tt_cc.to_rgba(tt)
    #ScalarMappable的to_rgba方法,即可把输入的tt转换成[r,g,b,a]列表。


    ax.scatter(xx, dy, color=[1,1,1,0], label='dy', marker='o', s=80, edgecolors=tt_cm)
    #color=[1,1,1,0] 将face颜色设为全透明, 使用edgecolors控制边缘颜色。
    #不同于c参数,edgecolors不能直接接受一位数组,需要[r,g,b,a]为元素的数组。
    #使用上面ScalarMappable,基于tt生成一个edgecolors可接受的list。

    fig.colorbar(tt_cc, ax=ax, label='Time (second)')
    #画colorbar,第一个参数要求输入一ScalarMappable。

    ax.set_ylim([-50,50])

    ax.legend()
    plt.show()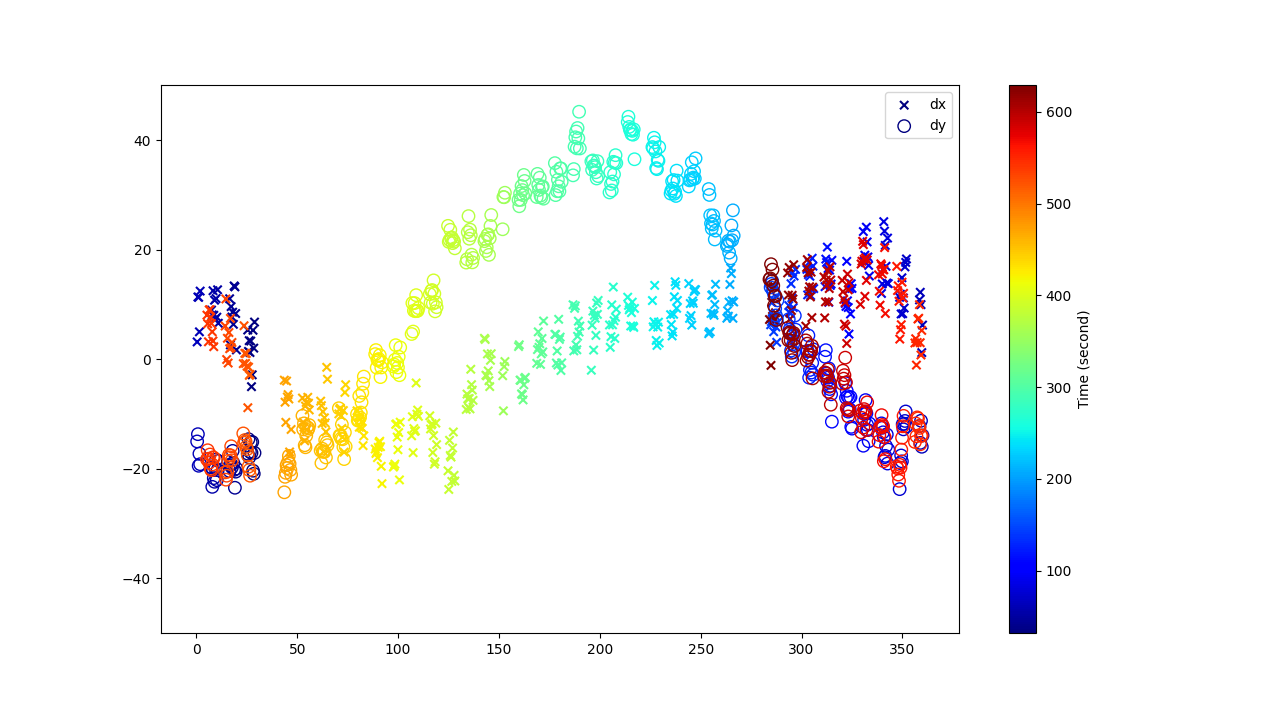
https://m.sciencenet.cn/blog-840751-1343377.html
上一篇:opencv python cv2的cv2.xfeatures2d.SIFT_create()版本问题
扫一扫,分享此博文