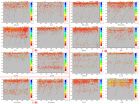
Mantle decadal oscillation (MDO) Chen Lijun The Pacific (inter-)decadal oscillation was named by Steven R. Hare, who noticed it while studying salmon production pattern results in 1997. From http://en.wikipedia.org/wiki/Pacific_decadal_oscillation The Pacific Decadal Oscillation is a climate index based upon patterns of variation in sea surface temperature of the North Pacific from 1900 to the present ( Mantua etal. 1997 ). While derived from sea surface temperature data, the PDO index is well correlated with many records of North Pacific and Pacific Northwest climate and ecology, including sea level pressure, winter land–surface temperature and precipitation, and stream flow. The index is also correlated with salmon landings from Alaska, Washington, Oregon, and California. From http://www.nwfsc.noaa.gov/research/divisions/fed/oeip/ca-pdo.cfm The concept and its working methods of The Pacific Decadal Oscillation is applied in terms of meteorology and earthquake prediction in China. (See the references) A large number of similar to The Pacific Decadal Oscillation is also found by the author who worked in the disposal of earthquake data and made the time-deep sequence diagram of the earthquake focal depth in Seismic Cylinders on the Earth since 2011.To a certain depth of upper mantle or deep mantle, the clusters of deep earthquake source in different time periods is found and it will render the mantle oscillation pattern just like the Pacific Decadal Oscillation , as shown in fig. 1 ~ fig. 5. The fig. 1 ~ fig. 5 shows that the mantle oscillation of interior of seismic cylinders is with a "- + -" pattern of seismic activity in some time domain, the depth of each different, but all of them are jumping up and down (roll) within the scope of certain depth. Mantle oscillation time domain is decadal perhaps, such as the Philippines cylinder, the East Tonga cylinder, the Solomon cylinder etc., the advantage is about 18 years, also maybe 10 years or so, such as Japan cylinder, Taiwan and the Ryukyu cylinder, etc. Mantle oscillation time domain is also interannual, such as in the upper mantle of the Solomon cylinder, in the upper mantle of the Southern Chile cylinder and so on. The oscillation time domain within 100 ~ 150 km depth of upper mantle of the Southern Chile cylinder is about 6 months (fig. 5). From fig. 1 ~ fig. 5 can be seen, the activity of shell strong earthquake and volcanic in cylinders are lagging behind the mantle oscillation process, characterized by a bottom-up driven step by step. And activity of shell earthquake and volcanic seems sometimes strong and sometimes gentle, so mantle oscillation is may divided into “cold” or “warm” phase. The phenomenon can be called the Mantle Decadal Oscillation (MDO). The Pacific Decadal Oscillation (PDO) is a climate index based upon patterns of variation in sea surface temperature of the North Pacific, so the Mantle Decadal Oscillation perhaps are the source of the Pacific Decadal Oscillation. Fig.1 The Mantle Oscillation in some cylinders on the Earth(Chen Lijun,2011) Fig.2 The Mantle Decadal Oscillation in the Philippines cylinder (Chen Lijun,2012) Fig.3 The Mantle Decadal Oscillation in the East Tonga cylinder (Chen Lijun,2012) Fig.4 The Mantle Decadal Oscillation in the Solomon cylinder (Chen Lijun,2013) Fig.5 The Mantle Moonthly Oscillation in upper mantle in the Southern Chile cylinder (Chen Lijun,2013) (2013.2.27) References 陈立军 . 地震地热说原理与应用(下) . http://blog.sciencenet.cn/blog-552558-493782.html, 2011.10.6 陈立军 . 地震与火山预测验证记录 003 号 20120831 菲律宾地震 7.9 地震 . http://blog.sciencenet.cn/blog-552558-607936.html, 2012.8.31 陈立军 . 地震与火山预测验证记录 004 号 20121121 新西兰火山喷发 . http://blog.sciencenet.cn/blog-552558-635098.html , 2012.11.22 陈立军 . 地震与火山预测验证记录 005 号 20130206 所罗门 8 级地震 . http://blog.sciencenet.cn/blog-552558-660316.html, 2013.2.7 陈立军 . 壳下地震活动的研究 (5) 全球 8.5 级以上地震的震源体粗略估计 . http://blog.sciencenet.cn/blog-552558-662888.html,2013.2.18 陈立军 . 壳下地震活动的研究 (6) 拉马德雷现象:地幔的年代际振荡和年际振荡 . http://blog.sciencenet.cn/home.php?mod=spaceuid=552558do=blogid=664926 , 2013.2.25 百科名片 . 拉马德雷 . http://baike.baidu.com/view/168387.htm,2013.1.19 卞洁,何金海,李双林 . 近 50 年来长江中下游汛期暴雨变化特征 . 气候与环境研究, 2012 , Vo1.17 , No.1 , 68-80 罗焕娟 . 拉马德雷冷位相第三周期主要灾害链与湖南省天气气候灾害 . 防灾科技学院学报 ,2008, Vo1.10 , No.4 , 49-52,70 杨学祥 . 拉马德雷造访中国:科技创新殊途同归 . http://blog.sciencenet.cn/blog-2277-659578.html , 2013.2.5 杨冬红, 杨学祥 . “拉马德雷”冷位相时期的全球强震和灾害 . 西北地震学报, 2006 , Vo1.28 , No.1 , 95-96 杨冬红 , 杨学祥 . 地球自转速度变化规律的研究和计算模型 ,地球物理学进展, 2013 , Vo1.28 , No.1 , 0058-0070 张瑞,汪亚平,潘少明 . 近 50 年来长江入海径流量对太平洋年代际震荡变化的响应 . 海洋通报 ,2011, Vo1.30 , No.5 , 572-577 张肖剑,靳立亚,陈春珠 , 等 . 北大西洋涛动活动中心空间位移年际年代际变化 . 科学通报, 2011 , Vo1.56 , No.32 , 2717-2724 N. Mantua . The Pacific Decadal Oscillation . http://www.atmos.washington.edu/~mantua/REPORTS/PDO/PDO_egec.htm , 2013.2.22 Wikipedia. Pacific Decadal Oscillation . http://en.wikipedia.org/wiki/Pacific_decadal_oscillation, 2013.2.22 http://www.nwfsc.noaa.gov/research/divisions/fed/oeip/ca-pdo.cfm, 2013.2.22 C.C. Wang. Pacific Decadal Oscillation(PDO) 最新研究結果 . http://sciscape2.org/2011/02/07/393.htm, 2013.2.22 http://www.sciencedaily.com/releases/2000/08/000802074737.htm, 2013.2.24 http://jisao.washington.edu/pdo/ , 2013.2.22
研究焦点:美国黄石热点——到底是不是地幔柱? (翻译 周春银;原文作者 Matthew J. Fouch ;来源: Geology ) ( from Wikipedia : Yellowstone hotspot ) 板内热点( intraplate hotspots ),通常表现为随地质年代递进喷发的中心,长期以来被认为起源于深部上升的炽热而具浮力的地幔物质所组成的圆柱状的地幔柱,它甚至深达核幔边界( e.g. Morgan,1971 ;译者注: Morgan 于 1971 年正式提出 plume 的概念,见 Nature 原文)。从地幔动力学的角度来看,沿大洋岩石圈分布的热点具有一个深部地幔柱源是显而易见的,因为对流失稳( instability )产生于边界层位置(即核幔边界),大洋岩石圈相对于大陆岩石圈更薄更容易穿透,而且巨大的板块内部下面的上地幔流应该比板块边界处的简单得多。因此地幔柱模型非常适用于大洋热点的追踪,如夏威夷 - 皇帝海山( Hawaiian-Emperor )、马克萨斯( Marquesas )、佛得角( Cape Verde )体系,尤其是在了解了它们延伸至更深部的热地幔的地震学特征之后( e.g. Wolfe et al.,2009 )。 但是,将深部地幔柱简单解释为大陆热点的源头却面临更大的挑战。一个显著的例子就是黄石 - 蛇河平原( Yellowstone-Snake River Plain , YSRP )体系,部分观测得出的结论认为 YSRP 起源于一个深部地幔柱正在不断上升的柱尾 (e.g. Armstrong et al.,1975; Smith and Braile,1994; Camp,1995; Pierce and Morgan,2009) 。 YSRP 是一个呈地质年代递进的流纹质火山岩组合,其年龄至少可以追溯至 12 百万年以前( Shervais and Hanan,2008 ),并且其运动和北美板块现今的移动速度是一致的( e.g. Pierce and Morgan,1992 )。而且,连续相伴生的玄武质火山作用具有高 3 He/ 4 He 比值( e.g. Graham et al.2009 )以及较高的区域大地水准面( e.g. Smith and Braile,1994 )也指示着深部地幔源。 关于 YSRP 体系起源的各种争论持续了几十年,但是已有的大量数据并非都支持深部地幔源之说,在某些情况下甚至与其相反。岩石学证据指示了上地幔源( e.g. Carlson and Hart,1987; leeman et al.,2009 )。构造和动力学模型包括对流卷曲模型( convective roll, Humphreys et al.2000 )、递进裂谷模型( propagating rift, Christiansen et al.,2002 )、边缘驱动对流模型( edge-driven convection, King,2007 )、岩石圈控制模型( lithospheric control, Tikoff et al.,2008 )以及俯冲板片控制的上升流模型( subducted slab-controlled upwelling, Faccenna et al.,2010 )。然而当每个模型来解释 YSRP 体系的各个方面时,要对该地区建立起一个综合概念模型则仍然非常困难。 Kelbert 等( 2012 )展示了非常重要而有趣的结果,为 YSRP 体系下的深部岩浆上升体系提供了重要的新证据。 Kelbert 等( 2012 )的 3-D 电导模型是由 EarthScope USArray Transportable Array ( TA )( http://www.usarray.org )的大地电磁 (MT) 数据而建立的。他们的图像显示高导电地壳和上地幔区,其中导电性最高的是中央蛇河平原下面的上地幔顶部并一直延伸至大约 100 km 深度。但是 Kelbert 及其同事们发现在黄石下面是低导值,因此他们认为与蛇河平原地区相关的黄石火山口下面的下地壳和上地幔顶部中部分熔融程度要小很多。 USArray TA 地震体的孔径可以为完成 Kelbert 等的新 3-D MT 模型提供足够的分辨率,同时也在更深的深度探测了地幔( e.g. Lin et al.,2010; Obrebski et al.,2010; Schmandt and Humphreys,2010; Wagner et al.,2010; James et al.,2011; Sigloch,2011; Burdick et al.,2012 )。这些模型显示在整个 YSRP 下面存在一个明显的地震波速强烈减小的地带,与 YSRP 地壳和延伸至大约 125 km 深度甚至更深的上地幔中的部分熔融区一致,和广泛分布的区域性第四纪玄武质火山作用也一致。但是,与 Kelbert 等( 2012 )所发现的黄石下面的深部地壳和上地幔顶部中的低导相反,地震波速在黄石下面最低说明部分熔融程度高。显然,还没有任何深部采样体波成像模型显示,在黄石下面具有可以延伸至深部下地幔的由地幔柱而导致地震波速减小的连续管道的确凿证据。 深部地幔柱模型所面临的一个巨大挑战就是 YSRP 热点正好分布于一个长期活动的俯冲体系中。地幔柱如何能在一个具有极大的动力学复杂性的区域中存在呢?部分概念模型提出存在直接的板片 - 地幔柱相互作用,其中当深部地幔柱遇到俯冲板片的某个裂缝时,会在板片上形成一个弱化区域甚至穿过板片( e.g. Obrebski et al.,2010 )。还有一种情况,上升的地幔柱会遇到俯冲的 Juan de Fuca 板片暴露的南端,或者卷入东边海沟向西的后退和 Farallon 板片的解体。这些模型都难于解释板片的固有强度和由于俯冲作用而整体强烈下降的地幔流域。 或者,复杂的俯冲驱动的地幔动力学过程可能在产生热点和其他区域性火山作用中具有重要的作用。有一个并不含有深部地幔柱的概念模型,地幔流在 Juan de Fuca 板块的一个近水平的、滞留的断块附近流动,该板块的东缘正在黄石下面,这与层析成像模型是一致的。深部地幔在该下沉板片残余附近的流动将形成整个 YSRP 下面的上升地幔,并且还可以解释哥伦比亚河洪流玄武岩的构造岩浆作用以及和 YSRP 火山作用同时代的 High Lava Plains 的连续火山活动( e.g. James et al.,2011; Sigloch,2011 )。连续的板块驱动形成的上升流将消耗黄石玄武岩高 3 He/ 4 He 比值源区的下地幔岩石,并形成更深部的强地温梯度,该地温梯度可以解释大约 900 km 深度甚至更深深度的低地震波速。该模型或许还可以解释高区域大地水准面,如果这是由动力学作用( e.g. Moucha et al.2009 )而非深部正浮力源所形成的。这一概念模型的某些部分可以直接由数值模拟而得出( e.g. Faccenna et al.,2010 )。 在较浅的深度, Kelbert 等的结果为板内热点的上升体系提供了重要的新证据。其中一种可能性就是 Eagar 等( 2011 )针对 High Lava Plains/central Cascades 地区所提出的模型。在该地区可观测到东 Cascades 下地壳和上地幔顶部具有高导体,但是在 Newberry 热点附近导电性降低,这里是 High Lava plains 的最西段( Patro and Egbert,2008 )。高导地区还具有高 Vp/Vs ,而 Newberry 下的低导区也具有较低的地壳 Vp/Vs ( Eagar et al.,2011 )。综合而言,这些地球物理证据与一个远离相对活跃的火山作用的壳内部分熔融区是一致的,这说明现今的热点火山作用代表了一个缺乏地壳熔融的区域。 Kelbert 等的结果也说明地壳和上地幔中熔体的大量横向运输作用可能是大陆岩石圈热点相关的岩浆上升体系演化的一个重要部分。 总之,哥伦比亚河洪流玄武岩、 High Lava Plains 以及黄石 - 蛇河平原体系在地表所形成的大量而广泛的构造岩浆体系需要一个地幔动力学的整体构架来解释,而不是由一个简单的深部地幔柱来解释。一些前沿的成果可以帮助我们来建立一个改进的关于该地区的概念模型: (1) 提供关于高 3 He/ 4 He 比值玄武岩源区深度的进一步证据; (2) 得出区域尺度的地壳 Vp/Vs 和电导模型,这些模型可以解释文中所提的 High Lava Plains/Cascadia 地区观测结果。 (3) 增进对高区域大地水准面的进一步认识。 USArray 的新层析成像模型应该在其中具有意义。 (4) 加强对区域性地幔流区的约束。一部分地幔流动图像可以利用大陆尺度的地震各向异性数据来观测( e.g. Lin et al.,2010; Zandt and Humphreys,2008 ),但是它们只能提供地幔上部大约 400 km 范围的流动的粗略信息。 (5) 综合各种成像技术,包括地震学的、重力的以及大地电磁数据,不论是通过直接的联合解释还是正 / 反演模拟方法。一个主要的挑战在于物理参数(如密度,传导率,地震波速)间的转换。 (6) 继续努力开发下一代地球动力学数值模型,这些模型会将 EarthScope 数据和区域构造与火山历史综合起来。目前这一方向的研究已经展开( e.g. Liu and Stegman,2011 )。 综合以上这些新的地球物理的、地质学的以及地球化学数据,将提高我们对黄石热点及其与区域构造岩浆体系的关系的认识,以及对世界范围内大陆热点的形成和演化的认识。 原文引用: Matthew J. Fouch, The Yellowstone Hotspot: Plume or Not? Geology, May 2012; v. 40; no. 5; p. 479–480; doi: 10.1130/focus052012.1. 地址: http://geology.geoscienceworld.org/content/40/5/479.full ( open access article !!) 参考文献(略):以下仅列文章中所介绍的 Morgan ( 1971 )提出地幔柱( mantle plume )的论文以及本文所重点介绍的 Kelbert 等( 2012 )的文章 Kelbert, A., Egbert, G.D., and deGroot-Hedlin, C., 2012, Crust and upper mantle electrical conductivity beneath the Yellowstone Hotspot Track: Geology, v. 40, p. 447–450, doi:10.1130/G32655.1. Morgan, W.J., 1971, Convection plumes in the lower mantle: Nature, v. 230, p. 42–43, doi:10.1038/230042a0.
地幔转换带不连续面地震成像结果指示夏威夷西部存在热地幔 Seismic imaging of transition zone discontinuities suggests hot mantle west of Hawaii Q. Cao 1 , * , R. D. van der Hilst 1 , * , M. V. de Hoop 2 , and S.-H. Shim 1 太平洋中部夏威夷热点通常都被认为是来自深部地幔物质穿越上地幔在地表形成的,但是要在地震学上对plume进行严格的约束却是比较困难的事情。来自美国麻省理工大学(MIT)的van der Hilst研究小组( http://quake.mit.edu/hilstgroup/robspage/ ),通过地球物理方法,对夏威夷周围地区地幔转换带的结构(不连续面深度,转换带厚度)进行了研究,并对转换带边界的异常进行了讨论分析,他们认为这些异常是由于高温条件下的地幔矿物相变(橄榄石和石榴石体系相变)形成的,但是这些热物质并不是来自于下地幔,这与传统地球化学研究观点是不同的。这一研究成果发表在2011年5月27日最新一期Science杂志上。 (延伸阅读): Hawaii heat source debated : http://www.sciencenews.org/view/generic/id/74845/title/Hawaii_heat_source_debated Science原文链接: http://www.sciencemag.org/content/332/6033/1068.full Supporting Online Material : www.sciencemag.org/cgi/content/full/332/6033/1068/DC1 PDF文档: http://quake.mit.edu/hilstgroup/robspage/PapersPDF/2011Science_Hawaii_I.pdf 全文翻译:周春银 夏威夷热点 (hotspot) 通常被认为是由来自地幔深部的热物质形成的,但是要通过地震学方法来探测这样一个热柱却是很困难的。为了研究这样的热异常,我们利用 SS 波逆散射方法对太平洋中部之下的地震不连续面进行了成像,这些不连续面我们可以用地幔岩成分的地幔中的橄榄石和石榴石的相变来解释。 在夏威夷西部地幔转换带中出现的 800-2000 km 的热异常 (ΔT max ~300-400 K) ,说明这些热物质并不是从下地幔通过较细的垂直热柱 (plume) 上升上来的,而是在其进入流向夏威夷或者其他岛屿地区的热流之前就已堆积在转换带底部。这说明夏威夷熔岩的地球化学特征并不能直接约束下地幔(地球化学)域。 地幔柱 (mantle plume) 仍然是地球深部研究 (studies of Earth’s deep interior, SEDI) 中尚未完全解决的问题,作为与地幔柱有关的热点活动的原型,夏威夷长期以来都是争论的焦点。在运动的太平洋板块下面有一个来自下地幔的细细的热柱 (1-5) ,这样的经典观点已经被广泛运用于夏威夷熔岩 (6-7) 、地幔柱 - 板块相互作用 (8) 以及对流地幔风对地幔柱形态和海山链发育的影响作用 (9,10) 等方面的研究。深源地幔柱的经典一直都受到质疑,但是,仍有一些其他的代表性的解释,如来自转换带底部附近热边界处的上升流 (11) 和浅部地幔过程 (12) 。有关传说中的地幔柱的存在、定位和起源深度的层析成像证据仍然是比较模糊的 (13-17)(SOM text 1) 。 与深源地幔柱相关的温度异常会影响到矿物相边界 ( 压力引起的 ) 的深度,这可以通过地震波的反射或转换来确定 (18) 。非常重要的成像目标为在 410km 和 660km 深度附近 (Mg,Fe) 2 SiO 4 体系的橄榄石 - 瓦兹利石相变和后尖晶石相变 (19) 。由于他们具有相反的克拉伯龙斜率 (Clapeyron slope) ,高温将会使前者下降而使后者抬升 (SOM text 2) 。接收函数方法研究 (P-S 转换 ) 显示在夏威夷西南部 (20-22) 以及夏威夷岛链 (23) 之下存在较薄的地幔转换带。这表明存在高温环境,但是这些异常在侧向上的范围还难于确定,因为在岛屿及其周围地区地震台网还不够。 在超出接收函数方法之外,转换带不连续面可以利用下面的 S d S 反射 (d 是反射深度 ) 来成像确定,它在远离研究区域之外作为接收器面反射 SS 波的前驱波 (precursors) 而到达 (Fig.1) 。传统方法通过沿大范围 (10 -20 ) 区域叠加镜像 ( 像镜子一样 )SS 反射来提高较弱的信号 (24-28) 。这样的平均化会导致较低的空间分辨率,但是还并未得到夏威夷之下明显的 410 和 660km 不连续面 (SOM text 1) 。本文我们使用了 SS 波场的三维 (3D) 逆散射方法,以及被称为 GRT(generalized Radon transform)(29)(SOM text 3) 的方法 ( 改自碳氢化合物勘探方法 ) 。这也会产生数据冗余,但是不再在立体空间 (bins) 内叠加静态相,它结合了与单一成像点散射波相关的信号。利用 SS 前驱波进行 GRT 成像的可行性最早是在一个远离已知的热上涌和下降的大洋区域得到证明的 (30) 。 Fig. 1 Left: (Top) Map of study region (175° to 214°E; 12° to 26°N; Mercator projection, perspective view); (middle) geographical distribution of ~170,000 surface mid-points of SS waves (the darker the shading, the denser the coverage (SOM text 3.2); (bottom) path geometry of underside reflections at the surface ( SS ) and an upper-mantle discontinuity ( S 410 S or S 660 S ); precursor stack showing signal associated with S 660 S , S 410 S , and SS waves . Right: (Top) Geographical distribution of ~4800 sources (red symbols) and ~2250 receivers (blue) from which data are used, and which produces the data coverage shown on the left; (bottom) schematic view of ray geometry of SS , S 410 S, and S 660 S sampling the upper-mantle transition zone below the imaging area (UM, upper mantle; TZ, transition zone; LM, lower mantle). 我们利用 SS 波场 ~170000 宽频带 (20-50s) 记录来对夏威夷及其附近区域的转换带进行成像,这些记录来自于太平洋地区附近总共 ~2250 地震台站 ~4800 次地震记录 ( 震级 m b 5.2, 震源深度 75km)(Fig.1, SOM text 3.1) 。数据覆盖在大多数研究区域都是足够的,但是向西南方向会降低 (SOM fig.S6, C and F) 。在 250-950 km 深度范围、 0.5×0.5 经纬度格子内 GRT 得到弹性差异的 1D 剖面 (SOM text 3.2 and 3.3) 。这些图像,经过 3D 地幔不均一性 ( 利用不同的层析成像模型 ) 和 SS 反射点深度区域变化的校正,可以在与接收函数方法相当的辐射分辨率条件下确定边界。这些紧密隔开的反射剖面显示了 410km 和 660km 不连续面的深度变化 (topography) ,并阐明了在其他深度可能会被当作噪声而处理的构造。我们利用抽样分析来了解这些成像结果的可靠性 (SOM text 3.5) 。 3D 成像的横截剖面如穿过夏威夷的剖面 (Fig.2) 显示了多个散射水平面。除了 410km 附近和 650-700km 深度范围内的反射体之外,在大约 350 、 500 、 550 以及 800-900km 深度附近也有散射产生。大多数都是连续的并具有明显的 topography ,但是有些仍然是断断续续的或者分散的。我们这里主要关注转换带的通常边界。在 Fig.2B 中我们追踪横截剖面中的 410km 和 660km 不连续面,从所有网格点选取的深度得出不连续面深度 (Fig.3A and B) 、转换带厚度 (Fig.3C) 和深度相关性 (Fig.3D) 图像。 Fig. 2 Seismic section (E-W) across Hawaii (see Fig. 3 for section location). ( A ) Seismic image superimposed on tomographically inferred wave-speed variations ( 13 ). ( B ) Enlargement of image between 370- and 760-km depth, with interpretation of 410 (dashed green line), 520 (blue), and 660 (red) discontinuities. The depth profiles are corrected for 3D mantle heterogeneity (from tomography) and for the depth to the ocean floor where SS reflections occur. Inverse scattering does not assume contiguous reflectors (SOM text 3.2), but alignment suggests lateral continuity. Interfaces appear as a pulse with sidelobes, the width of which depends on frequency of the data and the angle at which image points are sampled ( 30 ). Horizontal resolution (which depends on illumination) is estimated to be on the order of a few hundred kilometers in the center of the study region (degrading to ~500 km toward the southwest owing to reduced sampling). I, II, and III mark regions discussed in the main text. The image gathers at 190°E and 200°E (highlighted in section on the right) are discussed in SOM text 3.3 and fig. S7). 410km 不连续面深度变化于 395-430km 之间 ( 侧向范围 500-750km) , 660km 不连续面深度变化于 640-705km 之间 ( 侧向上更平滑一些 ) 。夏威夷下面之下及以东 ( 区域 I) , 660km 不连续面比全球平均值 (~650km) 略浅一点。夏威夷和 165 W 之间 ( 区域 II) , 660km 不连续面更加异常 (~640km) ,这证实了 P-S 转换的观测结果 (20-23) ,但是将异常延伸到比原来更向西的区域。 167 W-179 W 之间 ( 区域 III) , 410km 不连续面达到了 430km 而 660km 不连续面出现在异常深度 (~700km) 。 180 以西区域界面接近全球平均深度 (29) 。 410km 和 660km 不连续面的区域平均深度分别为 413km 和 665km ,后者在区域 III 中具有较大值。转换带在夏威夷之下以及西北部较薄而在区域 III 中较厚 (Fig.3C) 。 410km 和 660km 不连续面在区域 I 和 II 中呈负相关关系,而在区域 III 中呈正相关关系 (Fig.3D) 。 Fig. 3 Discontinuity depths, transition zone thickness, and depth correlations in the study region. ( A ) Topographic map of 410 (regional average 413 km) and ( B ) 660 (regional average 665 km). Thick black solid line depicts location of E-W cross section in Fig. 2 , and thin black line in (B) indicates the location (at 700-km depth) of the mantle plume identified in ( 16 ); see also fig. S2B. I, II, and III mark the regions discussed in the main text. ( C ) The difference between 410 and 660 depths suggests that a relatively thin transition zone (passing through Hawaii) surrounds a thick transition (between 180° and 195°E, Region III). ( D ) Correlation between 410 and 660 depth variations (in regions where 410 and 660 topography exceeds 2.5 and 5 km, respectively). Interface depths are (weakly) negatively correlated beneath Hawaii, but conspicuous positive correlation appears in region III. In (A) to (C), regions where the 410 or 660 could not be identified unambiguously are left blank, and light shading indicates areas of relatively poor data coverage. 有两种类型的人为因素会影响成像的质量和准确性。首先,如果体积波速与我们用来作走时计算的值不同时,边界深度就会出现偏离 (Something text 3.4) 。这一效应非常小而难于解释区域 II 和 III 内较大的深度变化,但也可能存在某种平衡 (trade-off) 。在空间上连续的深度变化达 10km 或以上则被认为是有意义的 (30) ,但是作为保守的解释,对界面深度的估计被当作上限。其次,较稀疏的采样 ( 如夏威夷西部 ) 会降低降噪作用和空间分辨率。目测显示收集的图像 (Something text 3.3) 在大多数研究区域都是可靠的,抽样表明在区域 I 、 II 和 III 内一级观测在 95%(2σ) 自信度条件下都是可靠的 (SOM text 3.5) 。但是夏威夷西部部分深部构造处于在目前有效数据条件下可分辨的边缘。 即使存在这些不确定性因素,一级观测仍表明,夏威夷位于一个由异常较深的 410km 和 660km 不连续面以及很厚的转换带 ( 区域 III) 所构成区域东缘之上,周围是较浅的 660km 不连续面和减薄的转换带 ( 区域 I,II) 。这一预料之外的结构复杂性表明,夏威夷及其周缘地区下地幔上部边界处存在着较大的温度变化 ( 以及可能的成分变化 ) 。为了估算转换带顶部 (ΔT 410 ) 和底部 (ΔT 660 ) 的原位 (in situ) 地幔温度,我们使用的是地幔岩成分地幔中橄榄石和石榴石相变的压力 - 温度关系 ( 即克拉伯龙斜率 Γ)(SOM text 2) 。在这里并不需要非地幔岩成分来解释一级观测结果。 我们首先利用 (Mg,Fe) 2 SiO 4 橄榄石相变来解释观测结果,即橄榄石 - 瓦兹利石相变 (31) ,瓦兹利石 - 林伍德石相变 (32) ,林伍德石 - 钙钛矿 + 铁方镁石相变 ( 后尖晶石相变 ) (33) 。根据这些斜率所得到的温度地图显示,在夏威夷下面及以东地区 ( 区域 I) 存在较弱的扰动 (ΔT 410 ≈ΔT 660 ≈150K) ,但是更远的西部存在较大的异常。如果认为区域 II 较浅的 660km 不连续面是后尖晶石相变边界的上拱引起的,那么可以得到 ΔT 660 ≈300K ,与前人估计 (20,21) 一致,而较低的 ΔT 410 则说明比较明显的异常仅仅局限于转换带底部。但是 3D 结构却是很复杂的,更北地区较深的 410km 不连续面和较浅的 660km 不连续面则说明夏威夷岛链下面上地幔中具有很高的温度 (23) 。 较深的 660km 不连续面 ( 区域 III) 仍然是难于解释的谜团。对于上述 Γ p-sp 来说, 640-700km 之间的后尖晶石相变深度变化意味着温差达 ~850K 。在远离板块边缘的地区存在这样巨大的梯度是不现实的。如果 660km 不连续面之上 ( 或下 ) 波速比 3D 地幔校正中根据层析成像所推测的值要更低 ( 或高 ) ,那么 660km 不连续面可能会被高估。也有可能存在某些平衡,但是用这种方法来解释所有信号特征则需要一些似是而非的地震波和 ( 可能 ) 热异常 (SOM text 3.4) 。对于 Γ p-sp 、 ΔT 660 和上地幔波速真实值来说,后尖晶石相变并不能很好的解释 700km 深度附近的界面。 较大的 410km 和 520km 不连续面深度说明区域 III 转换带温度升高。多顶砧 (multi-anvil) 实验结果 (34-36) 证明,在高温条件下存在不同的相关系以及 Al 分配作用会增加后石榴石相变 (post-garnet transitions) 时的 ( 地震波 ) 突变。这类实验都是非常具有挑战性的,但是相关系的一些重要方面,如该正克拉伯龙斜率 (Γ p-gt ) 的大小、化学成分对其位置的影响以及 ( 相对于后尖晶石相变而言 ) 后石榴石相变的地震学可探测性 (seismic detectability) ,仍然不是特别清楚 (SOM text 2) 。后石榴石相变可能存在于热地幔中比正常地幔后尖晶石相变更深的位置,这已经被用来解释深部 660km 不连续面的发现 (24,27) 。我们的图像则描述了从后尖晶石相变 ( 区域 II) 到后石榴石 ( 区域 III) 的侧向变化。考虑到可能存在的某种平衡 (trade-off) 以及克拉伯龙斜率和 ( 地幔岩中 )Al 2 O 3 含量的不确定性,对后石榴石相变的 ΔT 660 的估计仍然带有很多不确定性,但是 Γ p-gt =3.0 MPa/K (37) 将会产生一个 450K 的上限 ( 下限由区域 II 后尖晶石相变温度所确定 ) 。 夏威夷西部地幔 660km 深度附近是很热的,该区域至少有 800km 宽 ( 如果局限于区域 II) ,但是也可能宽达 2000km ( 如果包括区域 III) ,该界面说明热物质在下地幔顶部堆积并扩散开来,热点火山作用可以由转换带底部的次级上升流 (5,38)(SOM text 5) 提供物质来源 (Fig.4) 。这与夏威夷西南下地幔地幔柱的层析成像观点 (16,17) 是不同的,但是目前还没有可用的走时数据来解释地幔中连续的地幔柱似的结构和不同深度的分散的异常 (SOM text 1) 。 Fig. 4 Cartoon of broad anomaly near base of the transition zone west of Hawaii, superimposed on a scattering image ( Fig. 2 ). Green, blue, and red lines depict interfaces near depths of 410, 520, and 660 km. The deep 410 and 520 west of Hawaii suggest higher-than-average temperatures (Δ T 410 ≈ 200 K) in the upper mantle and transition zone, but with current data coverage we cannot distinguish between a large single anomaly and multiple smaller ones. Updoming of the 660 beneath region II is consistent with elevation of post-spinel transition in hot mantle regions (with Δ T 660 ≈ 300 K), whereas deepening to ~700 km beneath III (red dashed line) may indicate change of dominant transition system to garnet (with Δ T 660, max ≈ 450 K). The positive Clapeyron slope of the latter may aid flux of lower mantle material into the transition zone (thin red arrows). Pathways of flow from the deep anomaly to Earth’s surface are not resolved by the data used, but Hawaii volcanism may result from upwellings from the (edge of the) broad anomaly (for instance, just east of Hawaii, region I, Fig. 3 ). 不连续面层析成像反应的是局部环境,其自身并不能确定热异常的来源、寿命和深度范围。但是温度差异以及地表火山作用所需要的持续热流 ( 如果他们的确是相关的话 ) 表明这并不是一个孤立的、短暂的结构,它可以从下面如通过热柱或者大尺度 ( 热化学的 ) 地幔穹窿来更新 (5) 。如果存在联系,由转换带产生的短暂的失稳特征将有助于解释夏威夷 - 皇帝海山链演化 ( 随年代推进 ) 过程中的不规则性 (10) 。此外,主要相变体系在侧向上的变化可以影响上下地幔之间的物质交换。根据后石榴石相变的宽度、每个高温相变的密度差异 ( 即尖晶石相 ↔ 石榴石 + 镁方铁矿 ↔ 钙钛矿 + 镁方铁矿 ) 、 Γ p-gt 的值和化学成分的综合作用,后石榴石相变可以促进次级上升流的形成,因而也有助于形成区域 III 上地幔温度的提高、正大地水准面异常以及可能的远离海山链的深海测量特征的富集。最后,任何在 660km 不连续面处的下地幔流动临时富集都表明存在管流或者说地幔柱的成带分布 (7,39-41) 肯定是浅部地幔现象,而地表熔岩的同位素特征并不能用来构建下地幔中的地球化学域。 References and Notes 1. J. T. Wilson , Can. J. Phys. 42 , 893 (1963). 2. W. J. Morgan, Convection plumes in the lower mantle. Nature 230 , 42 (1971). doi:10.1038/230042a0 CrossRef 3. G. F. Davies, Ocean bathymetry and mantle convection 1. Large-scale flow and hotspots. J. Geophys. Res. 93 , 10467 (1988). doi:10.1029/JB093iB09p10467 CrossRef 4. N. H. Sleep, Hotspots and mantle plumes: Some phenomenology. J. Geophys. Res. 95 , 6715 (1990). doi:10.1029/JB095iB05p06715 CrossRef 5. V. Courtillot , A. Davaille , J. Besse , J. Stock, Three distinct types of hotspots in the Earth’s mantle. Earth Planet. Sci. Lett. 205 , 295 (2003). doi:10.1016/S0012-821X(02)01048-8 CrossRef Web of Science 6. S. R. Hart , E. H. Hauri , L. A. Oschmann , J. A. Whitehead, Mantle plumes and entrainment: I sotopic evidence. Science 256 , 517 (1992). doi:10.1126/science.256.5056.517 pmid:17787949 Abstract/FREE Full Text 7. D. Hanano , D. Weis , J. S. Scoates , S. Aciego , D. J. DePaolo, Horizontal and vertical zoning of heterogeneities in the Hawaiian mantle plume from the geochemistry of consecutive postshield volcano pairs: Kohala-Mahukona and Mauna Kea–Hualalai. Geochem. Geophys. Geosyst. 11 , Q01004 (2010). doi:10.1029/2009GC002782 CrossRef 8. N. M. Ribe , U. R. Christensen, The dynamical origin of Hawaiian volcanism. Earth Planet. Sci. Lett. 171 , 517 (1999). doi:10.1016/S0012-821X(99)00179-X CrossRef Web of Science 9. B. Steinberger , R. J. O’Connell , Advection of plumes in mantle flow: Implications for hotspot motion, mantle viscosity and plume distribution. Geophys. J. Int. 132 , 412 (1998). doi:10.1046/j.1365-246x.1998.00447.x CrossRef Web of Science 10. J. Tarduno , H.-P. Bunge , N. Sleep , U. Hansen , The bent Hawaiian-Emperor hotspot track: Inheriting the mantle wind. Science 324 , 50 (2009). doi:10.1126/science.1161256 pmid:19342579 Abstract/FREE Full Text 11. C. J. Allègre, The evolution of mantle mixing. Philos. Trans. R. Soc. Lond. A 360 , 2411 (2002). doi:10.1098/rsta.2002.1075 CrossRef Medline Web of Science 12. D. L. Anderson, Geophys. Res. Lett. 27 , 3623 (2000). CrossRef Web of Science 13. S. P. Grand, Mantle shear-wave tomography and the fate of subducted slabs. Philos. Trans. R. Soc. Lond. A 360 , 2475 (2002). doi:10.1098/rsta.2002.1077 Abstract/FREE Full Text 14. C. Li , R. D. van der Hilst , E. R. Engdahl , S. Burdick , A new global model for P wave speed variations in Earth’s mantle. Geochem. Geophys. Geosyst. 9 , Q05018 (2008). doi:10.1029/2007GC001806 CrossRef 15. R. Montelli et al ., Finite-frequency tomography reveals a variety of plumes in the mantle. Science 303 , 338 (2004). doi:10.1126/science.1092485 pmid:14657505 Abstract/FREE Full Text 16. C. J. Wolfe et al ., Mantle shear-wave velocity structure beneath the Hawaiian hot spot. Science 326 , 1388 (2009). doi:10.1126/science.1180165 pmid:19965755 Abstract/FREE Full Text 17. C. J. Wolfe et al ., Mantle P-wave velocity structure beneath the Hawaiian hotspot. Earth Planet. Sci. Lett. 303 , 267 (2011). doi:10.1016/j.epsl.2011.01.004 CrossRef 18. G. Helffrich, Topography of the transition zone seismic discontinuities. Rev. Geophys. 38 , 141 (2000). doi:10.1029/1999RG000060 CrossRef 19. T. Katsura , E. Ito, The system Mg 2 SiO 4 -Fe 2 SiO 4 at high pressures and temperatures: Precise determination of stabilities of olivine, modified spinel, and spinel. J. Geophys. Res. 94 , 15663 (1989). doi:10.1029/JB094iB11p15663 CrossRef 20. X. Li et al ., Mapping the Hawaiian plume conduit with converted seismic waves. Nature 405 , 938 (2000). doi:10.1038/35016054 pmid:10879532 CrossRef Medline 21. J. A. Collins , F. L. Vernon , J. A. Orcutt , R. A. Stephen, Upper mantle structure beneath the Hawaiian swell: Constraints from the ocean seismic network pilot experiment. Geophys. Res. Lett. 29 , 1522 (2002). doi:10.1029/2001GL013302 CrossRef 22. I. Wlbern et al ., Deep origin of the Hawaiian tilted plume conduit derived from receiver functions. Geophys. J. Int. 166 , 767 (2006). doi:10.1111/j.1365-246X.2006.03036.x CrossRef Web of Science 23. Y. Shen , C. J. Wolfe , S. C. Solomon , Seismological evidence for a mid-mantle discontinuity beneath Hawaii and Iceland. Earth Planet. Sci. Lett. 214 , 143 (2003). doi:10.1016/S0012-821X(03)00349-2 CrossRef 24. A. Deuss , S. A. T. Redfern , K. Chambers , J. H. Woodhouse, The nature of the 660-kilometer discontinuity in Earth’s mantle from global seismic observations of PP precursors. Science 311 , 198 (2006). doi:10.1126/science.1120020 pmid:16410518 Abstract/FREE Full Text 25. J. Lawrence , P. M. Shearer, Imaging mantle transition zone thickness with SdS - SS finite-frequency sensitivity kernels. Geophys. J. Int. 174 , 143 (2008). doi:10.1111/j.1365-246X.2007.03673.x CrossRef 26. A. Deuss, Global observations of mantle discontinuities using SS and PP precursors. Surv. Geophys. 30 , 301 (2009). doi:10.1007/s10712-009-9078-y CrossRef 27. C. Houser , Q. Williams, Reconciling Pacific 410 and 660km discontinuity topography, transition zone shear velocity patterns, and mantle phase transitions. Earth Planet. Sci. Lett. 296 , 255 (2010). doi:10.1016/j.epsl.2010.05.006 CrossRef 28. N. Schmerr , E. Garnero , A. McNamara , Deep mantle plumes and convective upwelling beneath the Pacific Ocean. Earth Planet. Sci. Lett. 294 , 143 (2010). doi:10.1016/j.epsl.2010.03.014 CrossRef 29. Materials and Methods are available on Science Online. 30. Q. Cao , P. Wang , R. D. van der Hilst , M. V. de Hoop , S.-H. Shim , Imaging the upper mantle transition zone with a generalized Radon transform of SS precursors. Phys. Earth Planet. Inter. 180 , 80 (2010). doi:10.1016/j.pepi.2010.02.006 CrossRef 31. H. Morishima et al ., The phase boundary between agr- and beta-Mg 2 SiO 4 determined by in situ x-ray observation. Science 265 , 1202 (1994). doi:10.1126/science.265.5176.1202 pmid:17787583 Abstract/FREE Full Text 32. The Clapeyron slope of the wadsleyite to ringwoodite transition is positive ( 42 ) but not well constrained experimentally. 33. T. Irifune et al ., The postspinel phase boundary in Mg2SiO4 determined by in situ X-ray diffraction. Science 279 , 1698 (1998). doi:10.1126/science.279.5357.1698 pmid:9497283 Abstract/FREE Full Text 34. D. J. Weidner , Y. Wang , Chemical- and Clapeyron-induced buoyancy at the 660 km discontinuity. J. Geophys. Res. 103 , (B4), 7431 (1998). doi:10.1029/97JB03511 CrossRef 35. K. Hirose, Phase transitions in pyrolitic mantle around 670-km depth: Implications for upwelling of plumes from the lower mantle. J. Geophys. Res. 107 , (B4), 2078 (2002). doi:10.1029/2001JB000597 CrossRef 36. N. Nishiyama , T. Yagi, Phase relation and mineral chemistry in pyrolite to 2200°C under the lower mantle pressures and implications for dynamics of mantle plumes. J. Geophys. Res. 108 , 2255 (2003). doi:10.1029/2002JB002216 CrossRef 37. M. Akaogi , E. Ito, Calorimetric study on majorite–perovskite transition in the system Mg 4 Si 4 O 12 –Mg 3 Al 2 Si 3 O 12 : Transition boundaries with positive pressure–temperature slopes. Phys. Earth Planet. Inter. 114 , 129 (1999). doi:10.1016/S0031-9201(99)00039-4 CrossRef Web of Science 38. L. Cserepes , D. A. Yuen, On the possibility of a second kind of mantle plume. Earth Planet. Sci. Lett. 183 , 61 (2000). doi:10.1016/S0012-821X(00)00265-X CrossRef Web of Science 39. D. J. DePaolo , E. M. Stolper, Models of Hawaiian volcano growth and plume structure: Implications of results from the Hawaii Scientific Drilling Project. J. Geophys. Res. 101 , (B5), 11643 (1996). doi:10.1029/96JB00070 CrossRef 40. J. Blichert-Toft , F. Albarède , Mixing of isotopic heterogeneities in the Mauna Kea plume conduit. Earth Planet. Sci. Lett. 282 , 190 (2009). doi:10.1016/j.epsl.2009.03.015 CrossRef Web of Science 41. C. G. Farnetani , A. W. Hofmann , Dynamics and internal structure of a lower mantle plume conduit. Earth Planet. Sci. Lett. 282 , 314 (2009). doi:10.1016/j.epsl.2009.03.035 CrossRef Web of Science 42. A. Suzuki et al ., Geophys. Res. Lett. 27 , 803 (2000). CrossRef Web of Science 43. E. R. Engdahl , R. D. Van der Hilst , R. P. Buland, Bull. Seismol. Soc. Am. 88 , 722 (1998). Abstract/FREE Full Text 44. B. L. N. Kennett , E. R. Engdahl , R. P. Buland , Constraints on seismic velocities in the Earth from traveltimes. Geophys. J. Int. 122 , 108 (1995). doi:10.1111/j.1365-246X.1995.tb03540.x CrossRef
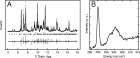
科学家发现碳在地球深部新的赋存状态 New host for carbon in the deep Earth 最近法国科学家在研究中发现一种新的含C高压相,这种含C高压相具有相当的稳定性,与理论计算所预测的结构非常一致,这对于认识C在地球深部的赋存状态以及地球内部的碳循环具有一定的意义。这一成果发表在2011年3月29日美国科学院院报PNAS上: http://www.pnas.org/content/108/13/5184 PDF下载: 2011-PNAS-New host for carbon in the deep Earth.pdf 以下是全文翻译:(原文中有太多的化学式,难于在编辑器中一一编辑,请见谅;所有化学式以公式请参考原文。) 全球地球化学碳循环包含地球内部和表层碳的交换。碳通过俯冲作用主要以碳酸盐形式再循环进入地幔中,通过火山作用主要以 CO2 形式释放到大气中。所以碳酸盐的稳定性以及脱碳酸盐化作用和熔融作用对于认识全球碳循环具有重要意义。由此,我们需要认识一直到核幔边界条件下这些矿物的热动力学性质和相图。但是含 C 矿物在这些条件下的性质仍然不太清楚。本文我们报道了在 1800km 以下条件下存在一种新的 Mg-Fe 含 C 化合物。它具有由共角 (CO4)4- 四面体所构成的三元环结构,与第一性原理量子计算所预测的结构 (Oganov et al.,2008) 非常接近。该碳酸盐高压相可以通过如下 Fe(II) 和 (CO3)2- 的晶内反应: 4FeO + CO2 → 2Fe2O3 + C ,来聚集大量的 Fe(III) 。这将会形成由新的高压相 + 磁铁矿 + 纳米金刚石所组成的矿物组合。 关键词: diamond, Earth mantle, phase transition, experimental petrology, redox interaction 碳酸盐是主要的含 C 矿物,能够通过大洋岩石圈深俯冲作用进入到地幔中 (1) 。俯冲下去的成分与原始的 C 一同被认为对下地幔 C 储库具有重要作用 (2,3) 。因为在深部地幔矿物中 C 的溶解度极低 (4,5) ,因此 C 有可能以单独的相存在,如碳酸盐或者金刚石。有些研究表明碳酸镁 ( 菱镁矿 ) 是方解石和白云石消失之后 C 在深部的主要赋存方式 (6-8) 。另外一些模型认为与橄榄岩达到平衡以后的碳酸盐将会在下地幔被还原成金刚石 (9) 。但是,如同在上地幔所观测到的,下地幔氧化还原状态的不均匀性很有可能也存在:例如,俯冲带是由能够在很长时间尺度都保持稳定的更加氧化的矿物所组成的 (10) 。也有观点认为氧化和还原矿物可以在地球深部共存,如富 CO2 的金伯利岩浆可以将金刚石携带至地表来 (11,12) ,并且在来自下地幔的金刚石中发现了碳酸盐包裹体 (13,14) 。有关碳酸盐稳定性的高压实验表明菱形结构的 MgCO3 菱镁矿可以稳定至 115 GPa 、 2000-3000K ,而它在高压下会形成一种新的结构 (8) 。但是,第一性原理计算预测菱镁矿在 82 GPa 会转变成由 (CO4)4- 四面体所构成的新相,在 160 GPa 会转变成类似辉石的结构。考虑到地幔中平均 Fe/Mg 摩尔比为 0.12 ,那么碳酸盐的成分可能是介于菱镁矿和 FeCO3 菱铁矿之间,这两相可以形成连续的固熔体。目前含铁碳酸盐的相变研究很少。菱铁矿可以稳定至至少 47 GPa 和 2000K(18) ,在常温下可以稳定至 90 GPa(19) 。总之,菱铁矿和菱镁矿端元的结构特征是相似的,因为 Fe(II) 和 Mg 原子之间大小不匹配可以由 Fe(II) 中的自旋态转换来补偿 (19,20) 。 结果 Result 对于 MgCO3 和 MgO+CO2 组合,高压含 C 化合物的稳定性是一致的。在两种情况下,在类似温压条件下 ( 大约 80 GPa , 2400K) 所获取的 X 光衍射 (XRD) 图像中出现了新的峰,这些峰并不是已知的 MgO 和 CO2 氧化物或者菱镁矿结构的峰。这些峰指示在该压力范围内一种新的稳定结构。 MgO+CO2 组合在 82 GPa 、 2350 ± 150K 条件下典型的 XRD 图像如图 1A 所示。淬火到室温之后该高压相会转变回低压菱镁矿结构。对回收样品的 EELS (Electron energy loss spectroscopy) 分析结果与原位 (in situ) 观测结果是一致的。图 1B 显示自 MgO+CO2 组合回收样品在碳 K-edge 所获取的 EELS 图谱。 290.3 eV 处尖锐的峰指示 (CO3)2-(21) 。另外,根据 EELS 分析所得出的化学成分指示为 MgCO3 成分。所以,该高压相是菱镁矿的一种等化学多晶体。 图 1. (A) X-ray diffraction pattern of a sample obtained from the transformation of periclase in CO2 confining medium at 82 GPa and 2,350 ± 150 K. Crosses represent observed data after subtraction of the background and the solid line represents the profile refinement. For this refinement we used an assemblage of untransformed periclase (Upper), platinum (Middle), and the new high-pressure phase (Lower). Residual between observations and fit is shown below the spectrum. (B) C K-edge EELS spectrum done on the recovered sample. 大于 80 GPa 时,天然富菱铁矿样品在 1850-2300 K 会发生相变,生成与上述 MgCO3 样品类似的 XRD 图像,同时还有一种铁氧化物 ( 图 2A) 。这表示形成了一种 Mg-Fe 系列的含 C 高压相。与 MgCO3 端元不同地是,该高压含铁结构是可淬火的 (quenchable) 。随后对回收样品的 TEM 分析显示有三种不同相对存在:未相变的 (Fe0.75Mg0.25)CO3 菱铁矿、高压相和一种铁氧化物 ( 图 2B) 。图 2C 中显示在铁 L2,3 dege 所获取的 EELS 图像;部分图谱与残余菱铁矿晶体结构比较吻合,与在相同能量分辨率条件下所获取的含 Fe(II) 相的图谱比较相似 (22) 。菱镁矿的出现同样也由 EELS 分析所确认。该高压相 Fe L2,3 edge 处的结构显示处理含 Fe(III) 矿物的明显结构 (22,23) ,并且根据参考文献 24 所作的定量分析表明至少 3/4 的铁是以 Fe(III) 氧化态形式存在的。根据碳 K-edge 的 EELS 数据 ( 图 2D) 确认残余菱铁矿的存在,并显示未相变的碳酸盐的峰偏移到 290.7 eV 处的特征。 287.5 eV 处的小峰指示一氧化碳 (CO)(25) 可能以包裹体 / 纳米泡形式存在,形成了该高压相的独特显微结构 ( 图 2B) 。如下面所讨论的,这些包裹体是在碳酸盐高压相形成过程中生成的。 EELS 测量表明元素比值与初始碳酸盐有所不同: Fe/C ~0.61 ± 0.07 , Fe/O ~0.22 ± 0.02 。 图 2. (A) X-ray diffraction pattern collected at 80 GPa and room temperature of siderite transformed at 1,850–2,300 K. Crosses represent observed diffraction data after subtraction of the background and solid line the profile refinement. For the refinement we used an assemblage of high-pressure polymorph of magnetite (37) (Upper), untransformed siderite (space group R-3c) (Middle), and the new high-pressure phase (Lower). Residual between observations and fit is shown below the spectrum. (B) STEM high-angle annular dark field showing the untransformed siderite (Sid), the iron oxide (Mt for magnetite), and the transformed carbonate (HP carb.) appearing as a dark gray uniform matrix in the left side of the image. (C) EELS spectra collected on the recovered sample. These spectra provide qualitative information on the Fe(III)/ Σ Fe ratio of each phase (23, 24) and noticeable features have been indicated by small bars and can be compared with reference siderite, magnetite, and Fe(III) oxide (22). Spectrum collected on the untransformed carbonate shows a high intensity peak of 707.7 eV that indicates the main iron speciation to be Fe(II). In the case of the iron oxide, the broad L3 peak at 707–709 eV with no splitting is characteristic of magnetite, whereas the L2 shows many subsplitting and an intermediate energy position between pure ferric and ferrous iron that is typical of a mixed valence of magnetite (23). The spectrum collected in the new phase shows a L3 line at higher energy loss than in carbonate groups with a fine structure indicating the main iron speciation to be Fe(III). (D) C K-edge spectra collected in the untransformed and transformed carbonate phases. In the case of siderite relic, the peak at 290.3 eV corresponds to planar (CO3)2- carbonate groups. In the spectrum collected in the transformed carbonate, the slightly broader peak at 290.7 eV is attributed to the tetrahedral (CO4)4- forming rings of (C3O9)6-. Presence of CO can also be detected in intimate association with the new phase. (Mg0.6,Fe0.4)O+CO2 在 105 GPa 、 ~2850 K 条件下的相变会形成一个由未反应的 (Mg0.6,Fe0.4)O 、菱镁矿的高压相和相同的新高压相所组成的组合。这一组合已经由 XRD 所观测到并进一步由 ATEM 所确认 ( 图 3A) 。纳米金刚石也由电子衍射和碳 K-edge EELS 图谱所鉴别出来 ( 图 3B) 图 3. (A) TEM image of the recovered sample from the ferropericlase + CO2 experiment. Magnetite (Mt), high-pressure carbon-bearing phase (HP carb.), ferropericlase (FP), and nanodiamonds (D) are present. (B) C K-edge EELS spectrum of nanodiamonds observed in the recovered sample. The spectrum presents the absorption edge at 289 eV and the dip at 303 eV is characteristic of diamond C K-edge (38, 39). 讨论 Discussion 对高温高压下 XRD 图像分析可以鉴定高压含 C 结构。 XRD 图像与在该压力范围内理论计算所得到的菱镁矿的 phase II 相 ( 空间群为 C2/m) 是一致的 (15) 。但是当使用另一个晶体对称性更低一些的 P21/c 空间群时,拟合的质量会得到明显提高。这一结构见图 4 所示,它由共角的三个 (CO4)4- 四面体组所构成,这样组成了 (C3O9)6- 环。晶格常数为: MgO+CO2 在 P=82 GPa 、 T=2350 ±150K 条件下: a=8.39 , b=6.41 , c=6.82 , β =105.49 (V=354.7 3 ) ; MgCO3 在 P=85 GPa 、 T=2400 ±150K 条件下: a=8.37 , b=6.37 , c=6.80 , β =104.57 (V=351.7 3 ) 。对于后者,假设每个晶胞化学式单位为 12 (15) ,得到的密度为 4.76 g/cm3 ,与相同 P-T 条件下的低压结构具有 +10% 的密度差异。因为有相对较小的 Fe(III) 原子的加入,这种新的含铁相的晶格体积比富镁端元的要小 10% : (Mg0.6Fe0.4)O+CO2 在 P=105 GPa 、 T=2850 ±150K 条件下: a=7.72 , b=6.41 , c=6.57 , β =101.31 (V=319.0 3 ) ; (Mg0.25Fe0.75)CO3 在 P=80 GPa 、室温 条件下: a=7.83 , b=6.37 , c=6.73 , β =101.97 (V=328.9 3 ) 。 图 4. Structure of the new high-pressure phase in space group P21/c related to phase II of magnesite proposed by theoretical calculation (15). (CO4)4- tetrahedra appear in green and magnesium atoms are shown as violet spheres. 对于这种新的高压相由于没有现成的 EELS 图谱做参考,我们对该未知的电子态密度进行了密度泛函理论 (DFT) 计算。 Mg 态密度显示在大约 5 eV 费米能级之上有个很窄的峰,对应着碳的 K-edge 以及它的“分子”类型 (CO3)2-( 图 5) 。由这种高压含 C 新相所得到的态密度并没有任何 (CO3)2- 峰,但是在高能区 (7-11 eV) 有一个很宽的带 (band) 。晶体密度在 80 GPa 时为 4.79 g/cm3 。 (C3O9)6- 环的几何形态见图 5 右边所示。 为了解四面体 (C3O9)6- 环在减压时是如何变化的,在常温常压条件下该结构得到松弛。结果如下图所示 ( 密度为 3.60 g/cm3),C-O 键会变长。从 80 GPa 到 0 GPa C-O-C 角从大约 10-112 变到 115-118 ,这些值与已知的四面体的畸变 (distortion) 是一致得 (15) 。这些结构变化对于态密度具有重要影响。的确,正如对低密度结构的预测,整体态密度会向低能方向偏移。这些出现的窄峰对应着四面体 (C3O9)6- 环,其分子结构特征与高压实验样品的 EELS 分析结果非常相似 ( 即 290.7 eV 附近的峰 ) 图 5. DFT calculations for electronic density of state of the carbon atoms (p orbital symmetry). This unoccupied density of state roughly corresponds to the excitation probed by EELS at the C K-edge (excitonic effects are neglected in the calculation). 在含铁实验中,大量的 Fe(III) 进入到这种新结构中。实验中未见 Pt 的出现,因此 Pt 对该氧化还原反应没有影响。 Fe(III) 形成的氧化还原配对 (partner) 最终可能是 Fe(0) ,就像在高压硅酸盐如钙钛矿中观测到的一样 (9) 。但是 Fe(0) 可能只是一个过渡配对,因为在回收样品中并未观测到 Fe(0) 的存在证据。我们认为 Fe(III) 的加入更可能是由于一个氧化碳配对。我们由此认为铁的氧化是通过下面的化学反应由如 (CO3)2- 或 CO2 这样的含 C 分子结构的部分还原作用来平衡的: 20(Mg0.25Fe(II)0.75)CO3 = 20Mg0.25Fe(III)0.3(C3O9)0.2333 + 3Fe3O4 + 6CO 该反应指示含 Fe(III) 新相中的元素比值为 Fe/C ~0.43 , Fe/O ~0.14 ,与对回收样品的 EELS 估算值非常吻合。 结论 Conclusion 我们的研究证明,在近于下地幔地温 P-T 条件下 CO2 和其他氧化物的重新作用可以形成一种新的高压含 C 相。这表明这种新相具有较高的稳定性而不会分解为简单氧化物。同样,新高压相中 Fe(III) 的出现指示部分 C 的还原,如以上化学反应。这表明在下地幔条件下 C 的氧化态和还原态可以共存。这种性质可能是由于该含 C 相具有较强的热动力学稳定性。但是若这种新相真在下地幔深部存在的话,那么碳酸盐必须能够在深俯冲中保存下来。尽管根据下地幔矿物组合推测下地幔为还原条件 (9) ,但是如果与周围地幔隔离开来碳酸盐是可以在深部保持稳定的,例如在相对低温的俯冲板片中,由局部矿物组合所控制的氧逸度会相对较高一些 (10,26) 。残留的部分碳酸盐可以被搬运到 1800 km 深度以下,并转变成这种新的含 Fe(III) 相。 参考文献: ↵ Sleep NH, Zahnle K (2001) Carbon dioxide cycling and implications for climate on ancient Earth. J Geophys Res-Planet 106:1373–1399. CrossRef ↵ Javoy M (1997) The major volatile elements of the Earth: Their origin, behavior, and fate. Geophys Res Lett 24:177–180. CrossRef Web of Science ↵ Lecuyer C, Simon L, Guyot F (2000) Comparison of carbon, nitrogen and water budgets on Venus and the Earth. Earth Planet Sci Lett 181:33–40. CrossRef ↵ Keppler H, Wiedenbeck M, Shcheka SS (2003) Carbon solubility in olivine and the mode of carbon storage in the Earth’s mantle. Nature 424:414–416. CrossRef ↵ Shcheka SS, Wiedenbeck M, Frost DJ, Keppler H (2006) Carbon solubility in mantle minerals. Earth Planet Sci Lett 245:730–742. CrossRef ↵ Biellmann C, Gillet P, Guyot F, Peyronneau J, Reynard B (1993) Experimental evidence for carbonate stability in the Earth’s lower mantle. Earth Planet Sci Lett 118:31–41. CrossRef ↵ Fiquet G, et al. (2002) Structural refinements of magnesite at very high pressure. Am Mineral 87:1261–1265. Abstract/FREE Full Text ↵ Isshiki M, et al. (2004) Stability of magnesite and its high-pressure form in the lowermost mantle. Nature 427:60–63. CrossRef ↵ Frost DJ, McCammon CA (2008) The redox state of Earth’s mantle. Annu Rev Earth Planet Sci 36:389–420. CrossRef Web of Science ↵ Ballhaus C, Berry RF, Green DH (1990) Oxygen fugacity controls in the Earth’s upper mantle. Nature 348:437–440. CrossRef ↵ Haggerty SE (1999) Earth and planetary sciences—A diamond trilogy: Superplumes, supercontinents, and supernovae. Science 285:851–860. Abstract/FREE Full Text ↵ Torsvik TH, Burke K, Steinberger B, Webb SJ, Ashwal LD (2010) Diamonds sampled by plumes from the core-mantle boundary. Nature 466:352–355. CrossRef Medline Web of Science ↵ Brenker FE, et al. (2007) Carbonates from the lower part of transition zone or even the lower mantle. Earth Planet Sci Lett 260:1–9. CrossRef ↵ Stachel T, Harris JW, Brey GP, Joswig W (2000) Kankan diamonds (Guinea) II: Lower mantle inclusion parageneses. Contrib Mineral Petr 140(1):16–27. CrossRef ↵ Oganov AR, Ono S, Ma YM, Glass CW, Garcia A (2008) Novel high-pressure structures of MgCO3, CaCO3 and CO2 and their role in Earth’s lower mantle. Earth Planet Sci Lett 273:38–47. CrossRef ↵ Panero WR, Kabbes JE (2008) Mantle-wide sequestration of carbon in silicates and the structure of magnesite II. Geophys Res Lett 35:L14307, 10.1029/2008GL034442 . CrossRef ↵ Skorodumova NV, Belonoshko AB, Huang L, Ahuja R, Johansson B (2005) Stability of the MgCO3 structures under lower mantle conditions. Am Mineral 90:1008–1011. Abstract/FREE Full Text ↵ Santillan J, Williams Q (2004) A high-pressure infrared and X-ray study of FeCO3 and MnCO3: Comparison with CaMg(CO3)2-dolomite. Phys Earth Planet In 143–144:291–304. ↵ Lavina B, et al. (2009) Siderite at lower mantle conditions and the effects of the pressure-induced spin-pairing transition. Geophys Res Lett 36:L23306, 10.1029/2009GL039652 . CrossRef ↵ Mattila A, et al. (2007) Pressure induced magnetic transition in siderite FeCO3 studied by x-ray emission spectroscopy. J Phys Condens Matt 19:386206, 10.1088/0953-8984/19/38/386206 . CrossRef ↵ Hofer F, Golob P (1987) New examples for near-edge fine-structures in electron-energy loss spectroscopy. Ultramicroscopy 21:379–383. CrossRef Web of Science ↵ Gloter A, Douiri A, Tence M, Colliex C (2003) Improving energy resolution of EELS spectra: An alternative to the monochromator solution. Ultramicroscopy 96:385–400. CrossRef Medline Web of Science ↵ Paterson JH, Krivanek OL (1990) ELNES of 3d transition-metal oxides. 2. Variations with oxidation state and crystal structure. Ultramicroscopy 32(4):319–325. CrossRef Web of Science ↵ van Aken PA, Liebscher B, Styrsa VJ (1998) Quantitative determination of iron oxidation states in minerals using Fe L-2,L-3-edge electron energy-loss near-edge structure spectroscopy. Phys Chem Miner 25:323–327. CrossRef ↵ Hitchcock AP, Brion CE (1980) K-Shell excitation spectra of CO, N2 and O2. J Electron Spectrosc 18:1–21, Database of core excitation spectra: http://unicorn.mcmaster.ca/corex.html . CrossRef ↵ Dasgupta R, Hirschmann MM, Whiters AC (2004) Deep global cycling of carbon constrained by the solidus of anhydrous, carbonated eclogite under upper mantle conditions. Earth Planet Sci Lett 227:73–85. CrossRef ↵ Mezouar M, et al. (2005) Development of a new state-of-the-art beamline optimized for monochromatic single-crystal and powder X-ray diffraction under extreme conditions at the ESRF. J Synchrotron Radiat 12:659–664. CrossRef Medline Web of Science ↵ Mao HK, Xu J, Bell PM (1986) Calibration of the ruby pressure gauge to 800-kbar under quasi-hydrostatic conditions. J Geophys Res-Solid 91:4673–4676. CrossRef ↵ Fei YW, et al. (2007) Toward an internally consistent pressure scale. Proc Natl Acad Sci USA 104:9182–9186. Abstract/FREE Full Text ↵ Benedetti LR, Loubeyre P (2004) Temperature gradients, wavelength-dependent emissivity, and accuracy of high and very-high temperatures measured in the laser-heated diamond cell. High Pressure Res 24:423–445. CrossRef ↵ Hammersley AP, Svensson SO, Hanfland M, Fitch AN, Hausermann D (1996) Two-dimensional detector software: From real detector to idealised image or two-theta scan. High Pressure Res 14:235–248. CrossRef ↵ Larson AC, Von Dreele RB (1994) General structure analysis system (GSAS) Los Alamos National Laboratory Report LAUR, pp 86–748. ↵ Heaney PJ, Vicenzi EP, Giannuzzi LA, Livi KJT (2001) Focused ion beam milling: A method of site-specific sample extraction for microanalysis of Earth and planetary materials. Am Mineral 86:1094–1099. Abstract/FREE Full Text ↵ Gonze X, et al. (2009) ABINIT: First-principles approach to material and nanosystem properties. Comput Phys Commun 180:2582–2615. CrossRef Web of Science ↵ Gonze X, et al. (2002) First-principles computation of material properties: The ABINIT software project. Comp Mater Sci 25:478–492. CrossRef ↵ Egerton RF , ed (1996) Electron Energy-Loss Spectroscopy in the Electron Microscope (Springer, Berlin), p 500. ↵ Haavik C, Stolen S, Fjellvag H, Hanfland M, Hausermann D (2000) Equation of state of magnetite and its high-pressure modification: Thermodynamics of the Fe-O system at high pressure. Am Mineral 85:514–523. Abstract/FREE Full Text ↵ Batson PE, Bruley J (1991) Dynamic screening of the core exciton-energy-loss scattering. Phys Rev Lett 67:350–353. CrossRef Medline Web of Science ↵ Morar JF, Himpsel FJ, Hollinger G, Hughes G, Jordan JL (1985) Observation of a C 1 s core exciton in diamond. Phys Rev Lett 54:1960–1963. CrossRef Medline Web of Science
 标签: mantle