“Wiley在线讲堂”由Wiley旗下期刊专业的编辑团队、期刊出版经理与资深科研人员担任主讲,与您分享科研工作、论文写作、投稿出版和提升科研影响力等相关的各种问题。只需一台电脑/手机/平板,即可参与。所有课程完全免费开放! 讲堂内容 Wiley国际出版集团出版的国际领先药理学期刊 British Journal of Pharmacology (简称BJP,IF: 7.73) 主编 Amrita Ahluwalia 教授 与期刊高级编辑 季勇教授 将担任主讲嘉宾,与中国科研群体分享在优质的国际药理学期刊发表论文的技巧与诀窍。 英国药理学会期刊BJP的发展历史与简介 分析BJP上关于天然产物相关研究的特点和论文接收率 解读关于天然产物研究的BJP指南(2020版) BJP编辑给中国作者的建议与互动交流 讲堂时间 2020年10月17日(周六),16:00-17:00 免费注册 扫描二维码 或 点击链接免费注册 https://www.diaochapai.com/survey3092731 主讲人简介 Amrita Ahluwalia 教授 ■ British Journal of Pharmacology 主编,英国药理学会妇女药理学委员会首任主席 ■ 巴斯大学威廉哈维研究所担任所长及心血管药理学教授 Amrita Ahluwalia教授在英国巴斯大学获得药理学学士学位,并在威廉哈维研究所从事博士阶段的学习。上世纪90年代中期开始,她任职于英国圣乔治医学院,现在回到了母校巴斯大学威廉哈维研究所担任所长及心血管药理学教授,主要研究领域是针对心血管疾病找到改善心血管功能的治疗方法和策略。Amrita Ahluwalia是英国药理学会妇女药理学委员会的第一任主席,并创立了阿斯利康妇女药理学奖。 季勇 教授 ■ 南京医科大学副校长,江苏省心脑血管药物重点实验室主任 ■ British Journal of Pharmacology 亚州高级编辑(Asia Senior Editor);Member of British Pharmacological Society(BPS) 季勇教授主要从事气体分子H2S和NO及其对蛋白质修饰在心血管系统中的作用及药物防治研究,主持国家重点基础研究发展计划项目、国家自然科学基金重点项目、国家自然科学基金重大研究计划重点项目、国家自然科学基金重点国际(地区)合作研究项目等课题,获教育部自然科学奖一等奖、江苏科学技术一等奖及中华医学科技奖二等奖。季教授还担任中国病理生理学会动脉粥样硬化专业委员会副主任委员;中国药理学会心血管药理专业委员会常委;国际动脉粥样硬化学会中国分会常务理事;中国病理生理学会心血管专业委员会委员;国际心脏研究会中国执委会委员;中国生物化学与分子生物学会脂质与脂蛋白专业委员会委员; British Journal of Pharmacology 亚州高级编辑;Member of British Pharmacological Society(BPS)等. 关于BJP The British Journal of Pharmacology is the leading international general pharmacology journal published by the British Pharmacological Society. It publishes high-quality original research and authoritative reviews, addresses topical pharmacology issues, and is committed to transparency and scientific rigor.BJP hosts the highly regarded Concise Guide to Pharmacology.
审稿人的意见我们无法左右,但回复意见的技巧却可以总结掌握。 1. 痛定思痛 几乎很少有文章在不用修改的情况下就能被直接接受。所以,作者一般都会在同行评议后收到来自审稿专家和编辑的或多或少的修改意见,指出文章存在的问题。虽然这可能会打击到作者,但也是为了确保你的论文可靠,真实,清晰,完整。 当你收到审稿意见后,需要克服自己的挫败感,调整情绪修改文章并及时回复审稿人。这时需要理智的判断,不然会对自己不利。辩驳往往会使审稿人和编辑对你的意见两极分化。 2. 理解编辑的反馈信 反馈信示例: 例1: 拒绝,不接受重新提交。 Your paper has been examined by 2 expert reviewers. Unfortunately, we must decline this manuscript for publication. The reasons for this decision are indicated in the reviewers' comments. 例2:目前拒绝,以后可能接收 Your paper has been examined by 2 expert reviewers. For the reasons explained in the comments, we cannot accept this manuscript for publication in Clinical Chemistry. We would consider a revised version that takes these criticisms into account but cannot offer assurance that submission of a revised manuscript will lead to acceptance. 例3:修改后可能接收 Your paper has been examined by 2 expert reviewers. As you will see in their comments, each reviewer finds merit in the work but makes constructive suggestions. Please consider the suggestions carefully, as the changes will produce an article that better serves you and our readers. 第一种,在表示拒绝的反馈信中,编辑通常会说期待再次来稿。这种情况下,作者最好考虑另外的期刊进行投稿。 第二种,有一些拒绝信提供了重新提交的机会。可以继续尝试投稿,但你需要仔细考虑是否能够通过修改达到审稿人的要求。如果审稿人发现文章中有太多问题,那么他们在读到一半过后就不再继续发表意见了。如果你决定重新提交,那么会有两种可能:(1)审稿人对你的论文已经有了很差的印象;(2)审稿人针对上次没有看到的内容提出更多修改意见。 第三种情况就是常见的“修改后提交”这种反馈。这种情况下,只要你按照意见进行修改,再次提交的文章一般都会被接受。所以你应该尽早修改并提交。 3. 审稿意见预处理 当你阅读了编辑的反馈信以及审稿人的意见之后,至少要花一天的时间来消化,以确保你真正理解了审稿人的修改建议。你可以将这些意见分类,然后制定修改计划。例如:(1)要求进一步阐明内容,填补论文中的漏洞,或者增加实验细节;(2)要求重新分析、表达或解释现有数据;(3)要求进行更多实验或进一步证明概念;(4)无法满足的要求。确定范围后可以帮助你提高效率。如果要求进行额外的数据分析或统计分析,那么你需要考虑自己是否有这方面的资源或是否需要咨询专业统计师。如果要求进行额外的实验,那么就需要设计实验方案并开始实施。如果有的修改要求你不能满足,那么也需要提出别的想法。总之要让审稿人满意。 4. 审稿人错的反面并不是你对 有时审稿人会忽视一些内容,然后在评论中询问;有时审稿人并不是该领域专家,因此他们可能会让你删掉一些比较重要的内容;有时审稿人可能误解某些结论,从而提出质疑。 总而言之,审稿人是可能出错的。 但即使审稿人错了,也不意味着你就是对的。你应该首先考虑如何对你的文章进行改进,因为有时也许是你误导了审稿人,或者某些内容没有阐释清楚或充分强调。在找到 强有力的证据 证明自己正确、审稿人错误的时候,以学术交流的口吻向审稿人阐述而不是直接指出审稿人的错误。 5. 辩驳要明智 通常情况下,审稿人会要求你进行多次修改。其中有些建议你会认为是有价值的,而有些则显得无关紧要,甚至有一些你并不认同。但即使在某些问题上你不完全同意审稿人的意见,你也需要明智地进行辩驳。如果审稿人要求的修改内容并不影响整体效果,那么请尽量修改。因为这对你并无坏处,还能表现出你在认真对待审稿意见。然而,如果你认为要求的修改会对论文产生负面影响,那么请有礼貌地提出你的不同意见。千万不要毫不留情面地指出审稿人是错误的。应该耐心地解释审稿人可能误解了某部分内容,以及你希望保持文本的完整性。然而这时候你可能会发现,这些解释的话如果添加到你的文章中,或许就可以避免读者的误解。 6. 不要以一位审稿人的意见来否定另一位审稿人 在回复审稿人时,绝对不要使用的一种观点就是,针对一位审稿人提出的质疑,以另一位审稿人的意见来否定。编辑在选择审稿人时,往往是因为他们有不同的专业领域,从而可以从不同的角度提出意见。这种方法有助于对文章进行全面的评价。所以,不要认为没有批评就等于默认了你的观点。在回复每一位审稿人的时候都不要以其他审稿人的意见为理由。 在某些情况下,审稿人会提出截然相反的建议。例如,一位审稿人可能会建议对某个数据增加更多信息,而另一位审稿人则建议将该数据删除。这时你必须自己判断采纳哪种意见更有利于你的论文。但也不要忽视任何一位审稿人,你需要解释你最后做出选择的理由。 7. 感谢审稿人和编辑 审稿人是自愿牺牲时间来评审论文的。尽管有些意见看上去很犀利,但大部分审稿人本身也是作者,他们希望指出改进论文的方法。所以,应该对他们的工作心存感激。重新提交论文时要尽量对他们的意见都做出回复。 回复要经过深思熟虑,并且有礼有节。如果审稿人赞扬了你论文的某些方面,你应该表示感谢。如果审稿人提出了一个很好的观点是你没有考虑到的,你也应该表示感谢,即使你认为这个观点可能与文章相关度不高。 8. 回复时要复述审稿意见 编辑和审稿人或许不会记得他们给出的具体意见,所以你应该首先复述修改建议,再描述你据此做出的修改,这样更方便他们理解(即以问答形式:每一条审稿人意见为题目,每一条回复作为解答)。此外,修改后的文本页码可能与原文本的页码不同,因此在你的回复中要说明清楚。还需要附上修改后的原文,但此文本中不要保留删改痕迹。 即使审稿人已经对他们给出的意见编了号,但也不要简单地在“评论1”后面写上回复,你仍然需要复述修改意见。如果多个审稿人给出了类似的意见,也要分别回复。这样便于编辑和审稿人理解。 结语 有一句老话叫“少即是多。”这在多数情况下是适用的。然而,在回复审稿人和编辑的意见时,你的内容应该越多越好。在你做出回应之前,需要花大量时间整理思绪,考虑如何根据意见修改文章。回复中应该尽量多地包含细节。更重要的是,要表达出谦虚的态度以及感激之情。 专业 SCI论文润色 认准 艾德思 母语润色 ¦ 专业翻译 ¦ 论文预审 ¦ 修改指导 ¦ 图表服务 ¦ 基金标书 ¦ 用户评价 ¦ 联系我们
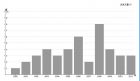
科学奇闻:一项研究 能 发33篇论文 诸平 我们经常听到有些人为了充数,将一项研究结果分成若干个小问题分别发表,但充其量也就是3-4篇而已。这种论文发表方式被称之为“萨拉米出版( Salami publication )”或者“香肠论文( salami slicing )”而据《发现者》( Discover ) 杂志网站2018年3月3日报道,《伊朗医学档案》( Archives of Iranian Medicine )将一项伊朗人心理健康方面的研究结果分成33篇论文分别发表,其目的可能与试图提高引用频次有关,而且作者之一是该杂志的副主编,在所有论文的致谢中都提到该杂志主编,看来如此切香肠式多篇发表主编和副主编知晓或者直接参与其中。另外,33篇论文中有31篇是同一天发表的。更多信息请浏览原文: Scientific Salami Slicing: 33 Papers from 1 Study By Neuroskeptic | March 3, 2018 5:49 am “ Salami slicing ” refers to the practice of breaking scientific studies down into small chunks and publishing each part as a seperate paper. Given that scientists are judged in large part by the number of peer-reviewed papers they produce, it’s easy to understand the temptation to engage in salami publication. It’s officialy discouraged , but it’s still very common to see researchers writing perhaps 3 or 4 papers based on a single project that could, realistically, have been one big paper. But I’ve just come across a salami that’s been sliced up so thinly that it’s just absurd. The journal Archives of Iranian Medicine just published a set of 33 papers about one study. Here they are – this is a rather silly image, but it’s a silly situation: Search results, Items: 33 Select item 294811471. A Survey on Mental Health Status of Adult Population Aged 15 and above in the Province of Zanjan, Iran. Noorbala AA, Bagheri Yazdi SA, Faghihzadeh S, Kamali K, Faghihzadeh E, Hajebi A, Akhondzadeh S, Armani Kian A, Nasr S. Arch Iran Med . 2017 Nov 1;20(11 Suppl. 1):S127-S130. PMID: 29481147 Similar articles Select item 294811462. A Survey on Mental Health Status of Adult Population Aged 15 and above in the Province of Yazd, Iran. Noorbala AA, Bagheri Yazdi SA, Faghihzadeh S, Kamali K, Faghihzadeh E, Hajebi A, Akhondzadeh S, Yasini Ardekani SM, Farahzadi MH, Zare F. Arch Iran Med . 2017 Nov 1;20(11 Suppl. 1):S123-S126. PMID: 29481146 Similar articles Select item 294811453. A Survey on Mental Health Status of Adult Population Aged 15 and above in the Province of West Azarbaijan, Iran. Noorbala AA, Bagheri Yazdi SA, Faghihzadeh S, Kamali K, Faghihzadeh E, Hajebi A, Akhondzadeh S, Sedighnia A, Karimi H. Arch Iran Med . 2017 Nov 1;20(11 Suppl. 1):S119-S122. PMID: 29481145 Similar articles Select item 294811444. A Survey on Mental Health Status of Adult Population Aged 15 and above in the Province of Tehran, Iran. Noorbala AA, Bagheri Yazdi SA, Faghihzadeh S, Kamali K, Faghihzadeh E, Hajebi A, Akhondzadeh S, Abbasinejad M, Zarkesh A, Amirloo F, Ghafarzadeh M. Arch Iran Med . 2017 Nov 1;20(11 Suppl. 1):S115-S118. PMID: 29481144 Similar articles Select item 294811435. A Survey on Mental Health Status of Adult Population Aged 15 and above in the Province of South Khorasan, Iran. Noorbala AA, Bagheri Yazdi SA, Faghihzadeh S, Kamali K, Faghihzadeh E, Hajebi A, Akhondzadeh S, Akbari A, Kazemi B. Arch Iran Med . 2017 Nov 1;20(11 Suppl. 1):S111-S114. PMID: 29481143 Similar articles Select item 294811426. A Survey on Mental Health Status of Adult Population Aged 15 and above in the Province of Sistan and Bluchestan, Iran. Noorbala AA, Bagheri Yazdi SA, Faghihzadeh S, Kamali K, Faghihzadeh E, Hajebi A, Akhondzadeh S, Shakiba M, Sargazi F, Shahriari S. Arch Iran Med . 2017 Nov 1;20(11 Suppl. 1):S107-S110. PMID: 29481142 Similar articles Select item 294811417. A Survey on Mental Health Status of Adult Population Aged 15 and above in the Province of Semnan, Iran. Noorbala AA, Bagheri Yazdi SA, Faghihzadeh S, Kamali K, Faghihzadeh E, Hajebi A, Akhondzadeh S, Mozhdehi Fard M, Haghighat S, Mohammadi Rad A. Arch Iran Med . 2017 Nov 1;20(11 Suppl. 1):S103-S106. PMID: 29481141 Similar articles Select item 294811408. A Survey on Mental Health Status of Adult Population Aged 15 and above in the Province of Razavi Khorasan, Iran. Noorbala AA, Bagheri Yazdi SA, Faghihzadeh S, Kamali K, Faghihzadeh E, Hajebi A, Akhondzadeh S, Ghazizadeh Hashemi F, Okhravi N. Arch Iran Med . 2017 Nov 1;20(11 Suppl. 1):S99-S102. PMID: 29481140 Similar articles Select item 294811399. A Survey on Mental Health Status of Adult Population Aged 15 and above in the Province of Qom, Iran. Noorbala AA, Bagheri Yazdi SA, Faghihzadeh S, Kamali K, Faghihzadeh E, Hajebi A, Akhondzadeh S, Noroozinejad G, Bagheri M. Arch Iran Med . 2017 Nov 1;20(11 Suppl. 1):S95-S98. PMID: 29481139 Similar articles Select item 2948113810. A Survey on Mental Health Status of Adult Population Aged 15 and above in the Province of Qazvin, Iran. Noorbala AA, Bagheri Yazdi SA, Faghihzadeh S, Kamali K, Faghihzadeh E, Hajebi A, Akhondzadeh S, Jafarinia M, Mohammadizadeh L. Arch Iran Med . 2017 Nov 1;20(11 Suppl. 1):S91-S94. PMID: 29481138 Similar articles Select item 2948113711. A Survey on Mental Health Status of Adult Population Aged 15 and above in the Province of North Khorasan, Iran. Noorbala AA, Bagheri Yazdi SA, Faghihzadeh S, Kamali K, Faghihzadeh E, Hajebi A, Akhondzadeh S, Akbari A, Yousefnejad Z. Arch Iran Med . 2017 Nov 1;20(11 Suppl. 1):S87-S90. PMID: 29481137 Similar articles Select item 2948113612. A Survey on Mental Health Status of Adult Population Aged 15 and above in the Province of Mazandaran, Iran. Noorbala AA, Bagheri Yazdi SA, Faghihzadeh S, Kamali K, Faghihzadeh E, Hajebi A, Akhondzadeh S, Shakiba A, Hashem Zehi MR. Arch Iran Med . 2017 Nov 1;20(11 Suppl. 1):S83-S86. PMID: 29481136 Similar articles Select item 2948113513. A Survey on Mental Health Status of Adult Population Aged 15 and above in the Province of Markazi, Iran. Noorbala AA, Bagheri Yazdi SA, Faghihzadeh S, Kamali K, Faghihzadeh E, Hajebi A, Akhondzadeh S, Mozhdehi Fard M, Ghasemzadeh M, Zari Moghaddam Z. Arch Iran Med . 2017 Nov 1;20(11 Suppl. 1):S79-S82. PMID: 29481135 Similar articles Select item 2948113414. A Survey on Mental Health Status of Adult Population Aged 15 and above in the Province of Lorestan, Iran. Noorbala AA, Bagheri Yazdi SA, Faghihzadeh S, Kamali K, Faghihzadeh E, Hajebi A, Akhondzadeh S, Rahimnia M, Mansouri F. Arch Iran Med . 2017 Nov 1;20(11 Suppl. 1):S75-S78. PMID: 29481134 Similar articles Select item 2948113315. A Survey on Mental Health Status of Adult Population Aged 15 and above in the Province of Kordestan, Iran. Noorbala AA, Bagheri Yazdi SA, Faghihzadeh S, Kamali K, Faghihzadeh E, Hajebi A, Akhondzadeh S, Rezaei F, Vafaei F. Arch Iran Med . 2017 Nov 1;20(11 Suppl. 1):S71-S74. PMID: 29481133 Similar articles Select item 2948113216. A Survey on Mental Health Status of Adult Population Aged 15 and above in the Province of Kohghilouyeh and Bouyerahmad, Iran. Noorbala AA, Bagheri Yazdi SA, Faghihzadeh S, Kamali K, Faghihzadeh E, Hajebi A, Akhondzadeh S, Hormozpour M, Aranpour H. Arch Iran Med . 2017 Nov 1;20(11 Suppl. 1):S67-S70. PMID: 29481132 Similar articles Select item 2948113117. A Survey on Mental Health Status of Adult Population Aged 15 and above in the Province of Khouzestan, Iran. Noorbala AA, Bagheri Yazdi SA, Faghihzadeh S, Kamali K, Faghihzadeh E, Hajebi A, Akhondzadeh S, Noroozinejad GH, DavasazTehrani R. Arch Iran Med . 2017 Nov 1;20(11 Suppl. 1):S63-S66. PMID: 29481131 Similar articles Select item 2948113018. A Survey on Mental Health Status of Adult Population Aged 15 and above in the Province of Kermanshah, Iran. Noorbala AA, Bagheri Yazdi SA, Faghihzadeh S, Kamali K, Faghihzadeh E, Hajebi A, Akhondzadeh S, Nejatisafa AA, Haghighian RM. Arch Iran Med . 2017 Nov 1;20(11 Suppl. 1):S59-S62. PMID: 29481130 Similar articles Select item 2948112919. A Survey on Mental Health Status of Adult Population Aged 15 and above in the Province of Kerman, Iran. Noorbala AA, Bagheri Yazdi SA, Faghihzadeh S, Kamali K, Faghihzadeh E, Hajebi A, Akhondzadeh S, Divsalar P, Kaviani N, Sarhadi Z, Bashar A. Arch Iran Med . 2017 Nov 1;20(11 Suppl. 1):S55-S58. PMID: 29481129 Similar articles Select item 2948112820. A Survey on Mental Health Status of Adult Population Aged 15 and above in the Province of Isfahan, Iran. Noorbala AA, Bagheri Yazdi SA, Faghihzadeh S, Kamali K, Faghihzadeh E, Hajebi A, Akhondzadeh S, Sharafi SE, Geramian N. Arch Iran Med . 2017 Nov 1;20(11 Suppl. 1):S51-S54. PMID: 29481128 Similar articles Select item 2948112721. A Survey on Mental Health Status of Adult Population Aged 15 and above in the Province of Ilam, Iran. Noorbala AA, Bagheri Yazdi SA, Faghihzadeh S, Kamali K, Faghihzadeh E, Hajebi A, Akhondzadeh S, Yahyavi ST, Baluchi S. Arch Iran Med . 2017 Nov 1;20(11 Suppl. 1):S47-S50. PMID: 29481127 Similar articles Select item 2948112622. A Survey on Mental Health Status of Adult Population Aged 15 and above in the Province of Hormozgan, Iran. Noorbala AA, Bagheri Yazdi SA, Faghihzadeh S, Kamali K, Faghihzadeh E, Hajebi A, Akhondzadeh S, Yasini Ardekani SM, Golamzadeh T. Arch Iran Med . 2017 Nov 1;20(11 Suppl. 1):S43-S46. PMID: 29481126 Similar articles Select item 2948112523. A Survey on Mental Health Status of Adult Population Aged 15 and above in the Province of Hamadan, Iran. Noorbala AA, Bagheri Yazdi SA, Faghihzadeh S, Kamali K, Faghihzadeh E, Hajebi A, Akhondzadeh S, Abbasi Nejad M, Solgi A. Arch Iran Med . 2017 Nov 1;20(11 Suppl. 1):S39-S42. PMID: 29481125 Similar articles Select item 2948112424. A Survey on Mental Health Status of Adult Population Aged 15 and above in the Province of Golestan, Iran. Noorbala AA, Bagheri Yazdi SA, Faghihzadeh S, Kamali K, Faghihzadeh E, Hajebi A, Akhondzadeh S, Shakiba A, Hashemi Nasab SM. Arch Iran Med . 2017 Nov 1;20(11 Suppl. 1):S35-S38. PMID: 29481124 Similar articles Select item 2948112325. A Survey on Mental Health Status of Adult Population Aged 15 and above in the Province of Gilan, Iran. Noorbala AA, Bagheri Yazdi SA, Faghihzadeh S, Kamali K, Faghihzadeh E, Hajebi A, Akhondzadeh S, Shakiba A, Baftahchi S, Skandari B. Arch Iran Med . 2017 Nov 1;20(11 Suppl. 1):S31-S34. PMID: 29481123 Similar articles Select item 2948112226. A Survey on Mental Health Status of Adult Population Aged 15 and above in the Province of Fars, Iran. Noorbala AA, Bagheri Yazdi SA, Faghihzadeh S, Kamali K, Faghihzadeh E, Hajebi A, Akhondzadeh S, Hedayati A, Rezaei F, Sahraeian L. Arch Iran Med . 2017 Nov 1;20(11 Suppl. 1):S27-S30. PMID: 29481122 Similar articles Select item 2948112127. A Survey on Mental Health Status of Adult Population Aged 15 and above in the Province of East Azarbaijan, Iran. Noorbala AA, Bagheri Yazdi SA, Faghihzadeh S, Kamali K, Faghihzadeh E, Hajebi A, Akhondzadeh S, Sedighnia A, Asle Rahimi V. Arch Iran Med . 2017 Nov 1;20(11 Suppl. 1):S23-S26. PMID: 29481121 Similar articles Select item 2948112028. A Survey on Mental Health Status of Adult Population Aged 15 and above in the Province of Chaharmahal and Bakhtiari, Iran. Noorbala AA, Bagheri Yazdi SA, Faghihzadeh S, Kamali K, Faghihzadeh E, Hajebi A, Akhondzadeh S, Shahmansouri N, Shakeri M. Arch Iran Med . 2017 Nov 1;20(11 Suppl. 1):S19-S22. PMID: 29481120 Similar articles Select item 2948111929. A Survey on Mental Health Status of Adult Population Aged 15 and above in the Province of Bushehr, Iran. Noorbala AA, Bagheri Yazdi SA, Faghihzadeh S, Kamali K, Faghihzadeh E, Hajebi A, Akhondzadeh S, Hedayati A, Akbari Zadeh F. Arch Iran Med . 2017 Nov 1;20(11 Suppl. 1):S15-S18. PMID: 29481119 Similar articles Select item 2948111830. A Survey on Mental Health Status of Adult Population Aged 15 and above in the Province of Ardebil, Iran. Noorbala AA, Bagheri Yazdi SA, Faghihzadeh S, Kamali K, Faghihzadeh E, Hajebi A, Akhondzadeh S, Sedighnia A, Azimi A. Arch Iran Med . 2017 Nov 1;20(11 Suppl. 1):S11-S14. PMID: 29481118 Similar articles Select item 2948111731. A Survey on Mental Health Status of Adult Population Aged 15 and above in the Province of Alborz, Iran. Noorbala AA, Bagheri Yazdi SA, Faghihzadeh S, Kamali K, Faghihzadeh E, Hajebi A, Akhondzadeh S, Ghazizadeh Hashemi F, Asadi A, Niknejad M. Arch Iran Med . 2017 Nov 1;20(11 Suppl. 1):S7-S10. PMID: 29481117 Similar articles Select item 2948111632. Trends of Mental Health Status in Iranian Population Aged 15 and above between 1999 and 2015 . Noorbala AA, Bagheri Yazdi SA, Faghihzadeh S, Kamali K, Faghihzadeh E, Hajebi A, Akhondzadeh S, Esalatmanesh S, Bagheri Yazdi H, Abbasinejad M, Asadi A. Arch Iran Med . 2017 Nov 1;20(11 Suppl. 1):S2-S6. PMID: 29481116 Similar articles Select item 2828780533. Mental Health Survey of the Iranian Adult Population in 2015 . Noorbala AA, Faghihzadeh S, Kamali K, Bagheri Yazdi SA, Hajebi A, Mousavi MT, Akhondzadeh S, Faghihzadeh E, Nouri B. Arch Iran Med . 2017 Mar;20(3):128-134. doi: 0172003/AIM.003. PMID: 28287805 Free Article Similar articles Yes, a single survey of the mental health of the Iranian population has been published 33 times. 31 of these papers (all published on the same day) are devoted to the Iranian provinces – there are 31 provinces of Iran , and each province got its own paper listing the results from that area. The author lists are more or less identical every time. This degree of slicing is not standard practice when publishing national epidemiological statistics, for obvious reasons. For one thing, it will make it difficult for readers to compare rates of disease across different provinces. They’d need to consult all 31 papers. Then they would need 31 citations to refer to all of those papers if they publish the comparison. It’s just not practical. Writing the 31 provincal papers would also have been a huge amount of work for the authors, although they seem to have cut some corners here, because the papers contain a lot of overlapping text . I guess however you slice a sausage, all the pieces contain the same meat. Here’s a sample of the overlap: As well as the 31 province papers, there are 2 other Archives of Iranian Medicine papers that sum up the whole mental health survey ( 1 , 2 ). One or two summary papers like this are what you’d expect to see from a study of this kind. The provincal data would usually be included in these papers as a supplementary material. Oh, and one of the summary papers has already been cited 34 times – guess where 33 of those citations come from? So why did Archives of Iranian Medicine allow this? On Twitter, it was spotted that one of the authors is an associate editor at the journal , which may be relevant. The Editor-in-Chief of Archives of Iranian Medicine is not listed as an author, but he is thanked in all of the papers for his “comprehensive support” of the project. Overall, this is the worst case of salami slicing – or sosis slicing – I’ve ever seen.
LetPub全新开设2017最新论文写作与发表公开课系列讲座 - 《如何撰写并发表高影响力的期刊论文》 ,将于今年2月起重磅登陆腾讯课堂。每期课程都会设定一个与SCI论文写作及国际期刊发表相关的主题,并邀请到一位资深、有着丰富论文编辑经验的美籍专家前来传授他们的知识与见解。 一篇语言优美、结构完整、内容精彩的论文是发表国际高影响力期刊的必要条件。在这里,我们为你提供专业的SCI论文写作方法,与你探讨SCI期刊投稿经验和技巧,帮你解决科技论文写作、投稿中的困难,旨在让你了解写作、学会写作、精通写作。 面向人群: 国内高校、医院、科研院所的科研人员 参与方式: 本课程通过腾讯课堂进行免费在线直播,请使用QQ号进行报名,报名成功后在正式开课前会收到提醒,并通过电脑在线观看,或下载腾讯课堂APP实时收看。 点击报名 你也可以扫一扫下面的二维码通过微信号直接报名: 课程介绍 第一讲: 如何构思文章的主题?如何撰写高质量的摘要与引言? How to Conceive a Manuscript Topic and Write an Effective Abstract Introduction 时间: 2017年2月17日 周五 20:00-21:00 内容纲要: 学术出版业的当前趋势 - Current trends in the scholarly publishing industry 如何有效地“打包”数据 - How to effectively “package” data 如何选取精准的关键词 - How to select effective keywords 用图片“讲故事” - Telling a story using figures 写一个有意义、精辟的标题 - Writing a meaningful, pithy title 如何撰写摘要 - How to write an Abstract 如何打造出令人满意的引言部分 - How to craft an ideal Introduction section 首期讲师:Lindsey Gendall 简介: Lindsey女士,LetPub语言编辑主管,在过去数年内审阅了数以千计的学术论文,积累了丰富的编辑经验,尤其对来自英语为非母语国家的研究人员的写作缺陷,有深入的了解。在加入LetPub之前,Lindsey曾就职于Elsevier和Pearson等知名国际学术出版社,熟谙期刊的发表流程和标准;她也曾司职哈佛大学医学院,协助医学院教授和临床医生在Science, Nature, Scence Translational Medicine等期刊编辑发表高水平论文,并与塔夫茨大学和北海道大学的研究人员合作编辑刊手稿。她目前负责Accdon/LetPub的语言编辑服务项目管理及和国际学术出版社合作等工作。 注意:本课程为系列课程,后续有更多精彩内容为您呈现,也会有更多经验丰富的美籍专家前来授课。一次报名,全程聆听! 课程内容持续更新中…… 咨询电话:021-34612310 咨询邮箱:chinasupport@letpub.com 投稿热门SCI期刊影响因子及投稿分析(点击期刊名可快速查询): PLOS ONE 、 Medicine 、 Cell Research 、 Scientific Reports 、 JBC 、 Molecular Biology Reports 、 Oncology Reports 、 Oncotarget 、 Biomed Research International 、 International Journal of Clinical and Experimental Medicine 、 BMC GENOMICS LetPub最新推出 SCI论文查重 服务,为作者确定论文在语言重复率上是否达到要求。 SCI论文查重相似率 如何理解? SCI论文查重标准 如何确定? SCI论文查重软件 -- crosscheck查重原理 是什么? SCI论文英语润色 │ 同行资深专家修改 │ 专业论文翻译 │ 格式排版整理 │ SCI论文图片处理 学术翻译英译中 │ SCI论文查重 │ LaTeX论文润色 │ SCI论文写作讲座 │ 联系我们
祝贺刘俊同学又一篇论文在国外杂志发表,希望其他同学们加油,争取发表更多更高水平的成果。 Article title: Prediction of Autogenous Shrinkage of Concretes by Support Vector Machine Journal title: International Journal of Pavement Research and TechnologyCorresponding author: Dr. KeZhen YanFirst author: Dr. Jun LiuFinal version published online: 7-JUL-2016Full bibliographic details: International Journal of Pavement Research and Technology 9 (2016), pp. 169-177DOI information: 10.1016/j.ijprt.2016.06.003
自然指数(Nature Index)是自然出版集团2014年11月推出的数据库,用以追踪作者或机构在68种全球一流期刊的论文发表情况。最新推出的自然指数排行榜展示了最近四年的各年度指数,并全部于2016年4月20日首次对外发布。自然指数依据各国或各科研机构对每年发表的约六万篇高质量的科研论文的贡献情况,既计算论文总数,又计算不同国家和机构在每篇论文上的相对贡献,对化学、地球与环境科学、生命科学、物理科学四个学科进行排名。 该排行榜中中国科研研所及产业机构论文数据表现夺目,其中中国科学院在综合性全球科研机构以及化学、地球与环境科学、物理科学三大学科排行榜中均独占鳌头,另有清华大学、北京大学、华大基因等多所中国中国科研院所及产业机构排名靠前。基于自然指数排行榜这样一个客观、新层面,并更有针对性和适应性的纯论文数据分析,该榜单中中国科研机构优秀的数据表现也体现了中国科研实力的巨大进步,令人欣喜。 以下是里瑟琦智库,从排名方法、全球科研机构排名、综合性全球大学排名、综合性全球产业机构排名、亚太地区科研机构排名、国家地区与排名、全球科研机构分学科排名等6个方面为您做出的相关分析。 一、 Nature Index 如何进行计数和排名? Nature Index 有三种计数方法来追踪科研单位的论文发表情况,自然指数主要采用的是加权分数式计量方法。 1. 论文计数 (article count/AC) - 不论一篇文章有一个还是多个作者,每位作者所在的国家或机构都获得1个AC分值。 2. 分数式计量(fractional count/FC)- FC考虑的是每位论文作者的相对贡献。一篇文章的FC总分值为1,在假定每人的贡献是相同的情况下,该分值由所有作者平等共享。例如,一篇论文有十个作 者,那每位作者的FC得分为0.1。如果作者有多个工作单位,那其个人FC分值将在这些工作单位中再进行平均分配。 3. 加权分数式计量(weighted fractional count/WFC)- 即为分数式计量增加权重,以调整占比过多的天文学和天体物理学论文。这两个学科有四种期刊入选Nature Index,其发表的论文量约占该领域国际期刊论文发表量的50%,大致相当于其它学科的五倍。因此,尽管其数据编制方法与其他学科相同,但这四种期刊上论文的权重为其他论文的1/5。 二、 全球科研机构排名 下表为全球综合排名前10的的科研机构。其中,中科院以年度增长3.9%,得分1307.12的数据优势力压群雄,位列榜首,哈佛大学WFC值为772.3,较2014年下降约10%。排名前10的科研院所中美国3所,法、德、英均2所,日本和中国各1所。 2015 Institution WFC 2014 WFC 2015 AC 2015 Change in WFC 2014-2015 1 Chinese Academy of Sciences (CAS), China 1307.12 1357.82 3449 0.039 2 Harvard University, United States of America (USA) 858.05 772.33 2622 -0.1 3 French National Centre for Scientific Research (CNRS), France 753.37 699.45 4937 -0.072 4 Max Planck Society, Germany 646.59 655.67 3110 0.014 5 Stanford University, United States of America (USA) 477.13 530.83 1514 0.113 6 The University of Tokyo (UTokyo), Japan 458.31 487.03 1377 0.063 7 Massachusetts Institute of Technology (MIT), United States of America (USA) 508.61 483.62 1627 -0.049 8 Helmholtz Association of German Research Centres, Germany 432.51 413.71 1663 -0.043 9 University of Oxford, United Kingdom (UK) 358.06 398.38 1373 0.113 10 University of Cambridge, United Kingdom (UK) 406.33 390.54 1568 -0.039 三、 综合性全球大学排名 在综合性全球大学排名中,哈佛大学、斯坦福大学、东京大学占据排名前三甲,其中哈佛大学WFC值年度纵向比较虽下降10%,但仍凭数据领先200多的优势力压斯坦福大学排名第一。北京大学(11)、南京大学(20)、清华大学(24)、中国科学技术大学(26)、浙江大学(37)、复旦大学(38)、南开大学(50)等7所中国大陆高校进入前50榜单,除浙江大学年度增幅(-4.1)为负外,其余6所均有增加,尤其是南开大学以53.6%的年度增幅表现出彩。南京大学自2014年以来,连续两年在该榜单中排名领先清华。 另有厦门大学、苏州大学、中山大学、武汉大学、湖南大学等5所高校进入前100名, 其中苏州大学以14.0%的增幅从2015年102名上升到78名,领先武汉大学、上海交通大学、同济大学等众多985 、211院校。华南理工、西安交大、大连理工、哈工大、东南大学、同济大学、北京航空大学、北京化工大学等传统理工科院校排名位于200-300区间,较为靠后。 2015 Institution WFC 2014 WFC 2015 AC 2015 Change in WFC 2014-2015 1 Harvard University, United States of America (USA) 858.05 772.33 2622 -10.0% 2 Stanford University, United States of America (USA) 477.13 530.83 1514 11.3% 3 The University of Tokyo (UTokyo), Japan 458.31 487.03 1377 6.3% 4 Massachusetts Institute of Technology (MIT), United States of America (USA) 508.61 483.62 1627 -4.9% 5 University of Oxford, United Kingdom (UK) 358.06 398.38 1373 11.3% 6 University of Cambridge, United Kingdom (UK) 406.33 390.54 1568 -3.9% 7 University of California Berkeley (UC Berkeley), United States of America (USA) 367.03 357.84 1346 -2.5% 8 Swiss Federal Institute of Technology Zurich (ETH Zurich), Switzerland 349.39 323.06 948 -7.5% 9 University of California, San Diego (UC San Diego), United States of America (USA) 336.5 306.13 847 -9.0% 10 University of Michigan (U-M), United States of America (USA) 299.52 304.18 944 1.6% 11 Peking University (PKU), China 296.21 300.39 1113 1.4% 12 Yale University, United States of America (USA) 303.87 297.64 891 -2.1% 13 University of Toronto (U of T), Canada 269.55 274.99 850 2.0% 14 Kyoto University, Japan 287.47 270.4 715 -5.9% 15 University of California Los Angeles (UCLA), United States of America (USA) 262.77 270.1 838 2.8% 16 Columbia University in the City of New York (CU), United States of America (USA) 257.02 267.22 913 4.0% 17 Northwestern University (NU), United States of America (USA) 261.55 261.27 615 -0.1% 18 University of Washington (UW), United States of America (USA) 260.45 258.31 866 -0.8% 19 University of Pennsylvania (Penn), United States of America (USA) 253.6 257.16 646 1.4% 20 Nanjing University (NJU), China 213.92 253.62 666 18.6% 21 University of Wisconsin-Madison (UW-Madison), United States of America (USA) 234.4 246.67 710 5.2% 22 California Institute of Technology (Caltech), United States of America (USA) 270.36 246.27 1306 -8.9% 23 The Johns Hopkins University (JHU), United States of America (USA) 225.62 232.04 839 2.8% 24 Tsinghua University (TH), China 210.64 231.33 785 9.8% 25 The University of Texas at Austin (UT Austin), United States of America (USA) 275.07 231.21 670 -15.9% 26 University of Science and Technology of China (USTC), China 214.92 229.13 661 6.6% 27 Cornell University, United States of America (USA) 226.61 224.72 712 -0.8% 28 Princeton University, United States of America (USA) 207.78 223.42 720 7.5% 29 Swiss Federal Institute of Technology in Lausanne (EPFL), Switzerland 234.56 215.28 689 -8.2% 30 University College London (UCL), United Kingdom (UK) 195.67 214.83 972 9.8% 31 University of Illinois at Urbana-Champaign (UIUC), United States of America (USA) 204.86 208.95 615 2.0% 32 Nanyang Technological University (NTU), Singapore 202.1 207.83 423 2.8% 33 Imperial College London (ICL), United Kingdom (UK) 210.51 199.52 838 -5.2% 34 University of Minnesota (UMN), United States of America (USA) 158.13 194.37 583 22.9% 35 Osaka University, Japan 220.19 193.89 532 -11.9% 36 University of California Santa Barbara (UCSB), United States of America (USA) 202.19 184.72 589 -8.6% 37 Zhejiang University (ZJU), China 191.48 183.62 386 -4.1% 38 Fudan University, China 166.75 177.65 374 6.5% 39 Tohoku University, Japan 179.67 177.02 431 -1.5% 40 National University of Singapore (NUS), Singapore 196.75 172.66 465 -12.2% 41 University of California San Francisco (UCSF), United States of America (USA) 186.95 171.14 467 -8.5% 42 The University of Chicago (UChicago), United States of America (USA) 211.92 168.44 721 -20.5% 43 Ludwig Maximilian University of Munich (LMU), Germany 182.66 166.06 691 -9.1% 44 Duke University, United States of America (USA) 166.92 163.16 507 -2.2% 45 McGill University, Canada 133.62 162.07 576 21.3% 46 University of Maryland, College Park (UMCP), United States of America (USA) 164.09 161.85 794 -1.4% 47 University of North Carolina at Chapel Hill (UNC), United States of America (USA) 178.14 159.47 394 -10.5% 48 New York University (NYU), United States of America (USA) 144.33 156.02 500 8.1% 49 The Pennsylvania State University (Penn State), United States of America (USA) 172.74 154.71 587 -10.4% 50 Nankai University (NKU), China 98.21 150.88 334 53.6% 四、 综合性全球产业机构排名 在综合性全球产业机构排名中,IBM排名第一,瑞士两家机构分列2、3位。德国默克集团占据第4名,韩国三星第6名。中国有华大基因、中国船舶、武汉邮电研究院、常茂生物化学工程公司、中国电子、中国航天、药明康德、金川集团等机构上榜。 2015 Institution WFC 2014 WFC 2015 AC 2015 Change in WFC 2014-2015 1 IBM Corporation, United States of America (USA) 57.17 53.89 129 -5.7% 2 F. Hoffman-La Roche AG, Switzerland 67.25 52.53 136 -21.9% 3 Novartis International AG, Switzerland 27.5 37.44 92 36.1% 4 Merck KGaA, Germany 27.03 29.56 76 9.4% 5 AstraZeneca plc, United Kingdom (UK) 20.36 21.22 59 4.2% 6 Samsung Group, South Korea 25.36 21.02 76 -17.1% 7 GlaxoSmithKline plc. (GSK), United Kingdom (UK) 17.62 20.88 71 18.5% 8 Interuniversity Microelectronics Centre (IMEC), Belgium 20.1 20.46 45 1.8% 9 Pfizer Inc., United States of America (USA) 21.9 18.64 50 -14.9% 10 NTT Group, Japan 18.73 18.63 34 -0.5% 11 Amgen Inc., United States of America (USA) 10.21 15.48 39 51.5% 12 BGI, China 14.65 12.39 53 -15.4% 13 Bristol-Myers Squibb (BMS), United States of America (USA) 9.14 12.01 21 31.4% 14 Toyota Group, Japan 15.14 11.32 23 -25.2% 15 GNS Science, New Zealand 8.02 11.08 54 38.1% 16 Sanofi, France 3.04 10.43 31 243.3% 17 Eli Lilly and Company, United States of America (USA) 8.51 9.62 28 13.0% 18 BASF SE, Germany 5.61 6.83 45 21.7% 19 Hitachi, Ltd., Japan 5.02 6.42 27 27.8% 20 Bruker Corporation, United States of America (USA) 6.21 6.37 44 2.7% 21 Microsoft Corporation, United States of America (USA) 7.07 6.18 27 -12.6% 22 New England Biolabs (NEB), United States of America (USA) 3.81 5.64 12 47.8% 23 Leidos Holdings, Inc., United States of America (USA) 4.51 5.41 60 19.9% 24 Science Systems and Applications, Inc. (SSAI), United States of America (USA) 5.9 5.21 26 -11.8% 25 Syngenta, Switzerland 1.82 4.92 13 171.2% 26 Johnson Johnson, United States of America (USA) 6.48 4.92 23 -24.1% 27 General Electric Company (GE), United States of America (USA) 1.19 4.91 10 311.4% 28 Thermo Fisher Scientific Inc., United States of America (USA) 4.76 4.73 20 -0.6% 29 Toshiba Corporation, Japan 7.55 4.5 9 -40.5% 30 Waters Corporation, United States of America (USA) 2.87 4.44 12 54.8% 31 Xerox Corporation, United States of America (USA) 2.32 4.29 15 85.1% 32 Mitsubishi Group, Japan 3.17 4.25 22 34.0% 33 Thales S.A., France 4.28 4.18 31 -2.3% 34 Isis Pharmaceuticals, Inc., United States of America (USA) 2.23 4.09 18 83.7% 35 China Shipbuilding Industry Corporation (CSIC), China 1.91 4.02 38 110.4% 36 Takeda Pharmaceutical Company Limited, Japan 4.99 3.87 12 -22.5% 37 Novo Nordisk A/S, Denmark 1.98 3.64 12 83.7% 38 Wuhan Research Institute of Posts and Telecommunications (WRI), China 1.91 3.61 31 88.5% 39 Agilent Technologies, Inc., United States of America (USA) 3.57 3.54 16 -0.8% 40 Illumina, Inc., United States of America (USA) 2.85 3.51 24 23.1% 41 HRL Laboratories LLC, United States of America (USA) 0.06 3.49 6 5,477.8% 42 Atmospheric and Environmental Research, Inc. (AER), United States of America (USA) 1.06 3.47 11 226.6% 43 AB Sciex, United States of America (USA) 1.79 3.29 8 83.2% 44 General Atomics, United States of America (USA) 2.5 3.2 21 28.1% 45 Alexion Pharmaceuticals, Inc., United States of America (USA) 0.08 3.14 4 3,977.3% 46 Element Six, Luxembourg 2.02 3.13 12 55.3% 47 Gilead Sciences, Inc., United States of America (USA) 1 3.13 7 211.8% 48 Changmao Biochemical Engineering Company Limited, China 0.42 3.03 13 626.3% 49 China Electronics Technology Group Corporation (CETC), China 2.72 3.02 11 11.0% 五、 亚太地区科研机构排名前50 该榜单中,中科院雄踞榜首,论文数量和WFC评分都远超位居第二的东京大学。闯入亚太地区十强的中国高校与科研院所有6所,分别是 中科院、北京大学(3)、南京大学(5)、清华大学(6)、中国科技大学(7)和浙江大学(10)。日本在10强中占据三席,分别是东京大学(2)、京都大学(4)以及大阪大学(9),新加坡南洋理工排名第8。 中国院校共23所,占比46%。大陆地区上榜高校名单依次为中国科学院、北京大学、南京大学、清华大学、中国科学技术大学、浙江大学、复旦大学、南开大学、厦门大学、苏州大学、中山大学、武汉大学、湖南大学、兰州大学、中国科学院大学、华东理工大学、吉林大学、华东师范大学、四川大学、上海交通大学, 其中大陆地区外,国立台湾大学排名30,香港科技大学排名48。 2015 Institution WFC 2014 WFC 2015 AC 2015 Change in WFC 2014-2015 1 Chinese Academy of Sciences (CAS), China 1307.12 1357.82 3449 3.9% 2 The University of Tokyo (UTokyo), Japan 458.31 487.03 1377 6.3% 3 Peking University (PKU), China 296.21 300.39 1113 1.4% 4 Kyoto University, Japan 287.47 270.4 715 -5.9% 5 Nanjing University (NJU), China 213.92 253.62 666 18.6% 6 Tsinghua University (TH), China 210.64 231.33 785 9.8% 7 University of Science and Technology of China (USTC), China 214.92 229.13 661 6.6% 8 Nanyang Technological University (NTU), Singapore 202.1 207.83 423 2.8% 9 Osaka University, Japan 220.19 193.89 532 -11.9% 10 Zhejiang University (ZJU), China 191.48 183.62 386 -4.1% 11 Fudan University, China 166.75 177.65 374 6.5% 12 Tohoku University, Japan 179.67 177.02 431 -1.5% 13 National University of Singapore (NUS), Singapore 196.75 172.66 465 -12.2% 14 Indian Institutes of Technology (IITs), India 175.64 162.59 302 -7.4% 15 Nankai University (NKU), China 98.21 150.88 334 53.6% 16 Institute of Physical and Chemical Research (RIKEN), Japan 143.28 137.53 532 -4.0% 17 Seoul National University (SNU), South Korea 160.56 130.81 406 -18.5% 18 Nagoya University, Japan 127.78 127.83 434 0.0% 19 Tokyo Institute of Technology (Tokyo Tech), Japan 130.31 120.09 365 -7.8% 20 Council of Scientific and Industrial Research (CSIR), India 135.48 119.8 170 -11.6% 21 Xiamen University (XMU), China 98.2 112.49 240 14.6% 22 Soochow University, China 95.15 108.47 209 14.0% 23 Korea Advanced Institute of Science and Technology (KAIST), South Korea 117.42 106.7 224 -9.1% 24 Sun Yat-sen University (SYSU), China 89.67 103.71 242 15.7% 25 Hokkaido University (Hokudai), Japan 100.55 102.86 221 2.3% 26 Wuhan University (WHU), China 96.71 100.27 185 3.7% 27 The University of Queensland (UQ), Australia 108.7 98.09 348 -9.8% 28 Monash University, Australia 104.44 92.57 364 -11.4% 29 Hunan University (HNU), China 78.1 92.47 144 18.4% 30 National Taiwan University (NTU), Taiwan 107.79 92.32 277 -14.4% 31 Australian National University (ANU), Australia 88.1 92.26 505 4.7% 32 Lanzhou University (LZU), China 110.44 89.4 178 -19.1% 33 University of Chinese Academy of Sciences (UCAS), China 88.98 88.73 547 -0.3% 34 East China University of Science and Technology (ECUST), China 70.4 88.55 159 25.8% 35 Jilin University (JLU), China 104.93 87.47 187 -16.6% 36 Indian Institute of Science (IISc), India 94.06 85.45 137 -9.2% 37 Kyushu University, Japan 100.7 84.75 281 -15.8% 38 Pohang University of Science and Technology (POSTECH), South Korea 71.47 84.65 178 18.4% 39 East China Normal University (ECNU), China 83.17 83.9 164 0.9% 40 Sichuan University (SCU), China 92.64 83.22 186 -10.2% 41 Shanghai Jiao Tong University (SJTU), China 107.53 82.21 371 -23.5% 42 Yonsei University, South Korea 72.09 82.11 213 13.9% 43 The University of Melbourne (UniMelb), Australia 82.29 82.03 512 -0.3% 44 National Institute for Material Science (NIMS), Japan 99.96 81.43 221 -18.5% 45 University of New South Wales (UNSW), Australia 91.08 79.09 256 -13.2% 46 Indian Institute of Science Education and Research (IISER), India 77.88 78.67 138 1.0% 47 Agency for Science, Technology and Research (A*STAR), Singapore 103.75 77.76 253 -25.1% 48 Hong Kong University of Science and Technology (HKUST), China 74.62 76.12 200 2.0% 49 The University of Sydney (USYD), Australia 83.32 75.63 464 -9.2% 50 National Institute of Advanced Industrial Science and Technology (AIST), Japan 70.26 73.58 195 4.7% 六、 国家与地区排名 在国家与地区排名中,美国以压倒性优势雄踞第一,三项指标几乎均是中国的两倍。中国、德国、英国分别位列2、3、4位,且相互之间差距较小。其中,年度纵向比较增幅最大的是以色列,为7.4%。 值得一提的是,中国增幅为4.8%,排名第二,且从13年开始每年增幅均为正数,可见科研影响力在逐年增加。另有台湾地区增幅虽然连年下降,但排名仍然与去年相同,位列18。 2015 Country WFC 2014 WFC 2015 AC 2015 Change in WFC 2014-2015 1 United States of America (USA) 18007.19 17203.82 26639 -4.5% 2 China 6183.36 6478.34 9666 4.8% 3 Germany 4055.4 4078.09 9142 0.6% 4 United Kingdom (UK) 3284.3 3365.63 8377 2.5% 5 Japan 3221.57 3053.48 5033 -5.2% 6 France 2237.62 2127.91 5483 -4.9% 7 Canada 1501.96 1478.29 3319 -1.6% 8 Switzerland 1299.95 1135.4 2955 -12.7% 9 South Korea 1182.23 1112.49 2061 -5.9% 10 Italy 1054.2 1061.43 3414 0.7% 11 Spain 1099.69 1055.51 3215 -4.0% 12 Australia 960.15 943.82 2683 -1.7% 13 India 936.54 901.49 1589 -3.7% 14 Netherlands 762.35 713.37 2486 -6.4% 15 Israel 495 531.83 1236 7.4% 16 Sweden 516.78 526.67 1614 1.9% 17 Singapore 529.79 485.45 909 -8.4% 18 Taiwan 488.3 415.85 1019 -14.8% 19 Russia 372.73 370.39 1390 -0.6% 20 Belgium 351.62 334.17 1157 -5.0% 七、 全球化学排名 中国在化学领域表现相当强势,在前十榜单中占据三席,其中中科院排名第一,三项数据均以近3倍的优势遥遥领先第二位的法国国家研究中心,北京大学排名第4,南京大学排名第10。前50强中,以此有中科大、南开大学、清华大学、浙江大学、复旦大学、厦门大学、湖南大学、华东理工、苏州大学、吉林大学、四川大学、武汉大学等12所大学。此外兰州大学、中山大学、中科院大学、华东师范大学、天津大学、华南理工大学、上海交通大学、大连理工大学等8所高校上榜。 2015 Institution WFC 2014 WFC 2015 AC 2015 Change in WFC 2014-2015 1 Chinese Academy of Sciences (CAS), China 777.34 865.77 1622 11.4% 2 French National Centre for Scientific Research (CNRS), France 244.16 226.09 927 -7.4% 3 Max Planck Society, Germany 184.45 201.34 451 9.2% 4 Peking University (PKU), China 155.38 174.21 486 12.1% 5 Massachusetts Institute of Technology (MIT), United States of America (USA) 173.4 166.65 319 -3.9% 6 The University of Tokyo (UTokyo), Japan 145.64 164.49 271 12.9% 7 Northwestern University (NU), United States of America (USA) 138.15 163.06 266 18.0% 8 Nanyang Technological University (NTU), Singapore 145.59 155.85 256 7.0% 9 Kyoto University, Japan 153.26 154.87 255 1.0% 10 Nanjing University (NJU), China 128.14 151.8 250 18.5% 11 Stanford University, United States of America (USA) 157.05 142.79 284 -9.1% 12 University of Science and Technology of China (USTC), China 124.73 140.67 247 12.8% 13 University of California Berkeley (UC Berkeley), United States of America (USA) 142.82 137.94 287 -3.4% 14 University of Oxford, United Kingdom (UK) 128.12 132.86 241 3.7% 15 Nankai University (NKU), China 72.59 130.72 274 80.1% 16 Swiss Federal Institute of Technology Zurich (ETH Zurich), Switzerland 128.86 128.2 227 -0.5% 17 Tsinghua University (TH), China 105.58 125.59 262 19.0% 18 Zhejiang University (ZJU), China 128.66 124.88 194 -2.9% 19 Harvard University, United States of America (USA) 138.82 124.54 244 -10.3% 20 University of Illinois at Urbana-Champaign (UIUC), United States of America (USA) 108.5 115.43 202 6.4% 21 The University of Texas at Austin (UT Austin), United States of America (USA) 113.49 112.08 163 -1.2% 22 Swiss Federal Institute of Technology in Lausanne (EPFL), Switzerland 116.93 111.6 233 -4.6% 23 University of Cambridge, United Kingdom (UK) 112.48 111.53 220 -0.8% 24 Fudan University, China 117.48 105.42 174 -10.3% 25 Osaka University, Japan 107.13 102.44 177 -4.4% 26 Helmholtz Association of German Research Centres, Germany 106.8 102.39 314 -4.1% 27 Council of Scientific and Industrial Research (CSIR), India 96.73 95.04 122 -1.7% 28 University of Michigan (U-M), United States of America (USA) 73.66 94.84 151 28.8% 29 Xiamen University (XMU), China 76.02 94.18 154 23.9% 30 Indian Institutes of Technology (IITs), India 108.08 94.03 130 -13.0% 31 National University of Singapore (NUS), Singapore 97.04 90.69 184 -6.5% 32 University of Pennsylvania (Penn), United States of America (USA) 82.14 89.96 136 9.5% 33 Hunan University (HNU), China 69.81 89.47 125 28.2% 34 University of California, San Diego (UC San Diego), United States of America (USA) 81.51 88.67 145 8.8% 35 Lawrence Berkeley National Laboratory (LBNL), United States of America (USA) 85.15 88.22 313 3.6% 36 University of California Los Angeles (UCLA), United States of America (USA) 77.28 85.71 160 10.9% 37 East China University of Science and Technology (ECUST), China 66.08 83.29 128 26.0% 38 University of Wisconsin-Madison (UW-Madison), United States of America (USA) 98.42 82.05 129 -16.6% 39 Ludwig Maximilian University of Munich (LMU), Germany 86.14 82.04 143 -4.8% 40 University of Toronto (U of T), Canada 68.71 80.93 127 17.8% 41 The University of Manchester (UoM), United Kingdom (UK) 77.54 78.4 140 1.1% 42 Tohoku University, Japan 82.8 75.31 134 -9.0% 43 University of Minnesota (UMN), United States of America (USA) 61.95 74.36 123 20.0% 44 Soochow University, China 66.57 74.09 129 11.3% 45 Korea Advanced Institute of Science and Technology (KAIST), South Korea 73.89 73.9 133 0.0% 46 California Institute of Technology (Caltech), United States of America (USA) 92.35 73.65 119 -20.3% 47 Tokyo Institute of Technology (Tokyo Tech), Japan 63.72 72.89 123 14.4% 48 Jilin University (JLU), China 80.64 72.77 133 -9.8% 49 Sichuan University (SCU), China 74.15 71.03 106 -4.2% 50 Wuhan University (WHU), China 65.76 70.57 105 7.3% 51 University of California Santa Barbara (UCSB), United States of America (USA) 83.47 70.2 147 -15.9% 52 Imperial College London (ICL), United Kingdom (UK) 73.55 69.8 148 -5.1% 53 Lanzhou University (LZU), China 88.24 68.41 118 -22.5% 54 Spanish National Research Council (CSIC), Spain 66.3 67.3 230 1.5% 55 Sun Yat-sen University (SYSU), China 56.45 67.08 107 18.8% 56 Nagoya University, Japan 58.64 66.91 111 14.1% 57 University of Münster (WWU), Germany 56.97 65.23 91 14.5% 58 Yale University, United States of America (USA) 71.42 64.95 116 -9.1% 59 Texas AM University (TAMU), United States of America (USA) 66.25 64.81 99 -2.2% 60 University of North Carolina at Chapel Hill (UNC), United States of America (USA) 75.43 63.64 92 -15.6% 61 The Scripps Research Institute (TSRI), United States of America (USA) 79.72 63.05 108 -20.9% 62 University of Washington (UW), United States of America (USA) 57.57 62.95 101 9.3% 63 Indian Institute of Science Education and Research (IISER), India 60.13 62.27 76 3.6% 64 University of Würzburg, Germany 47.06 59.65 82 26.8% 65 Hokkaido University (Hokudai), Japan 49.12 59.54 93 21.2% 66 Georgia Institute of Technology (Georgia Tech), United States of America (USA) 56.78 58.69 119 3.4% 67 University of Chinese Academy of Sciences (UCAS), China 55.82 58.36 289 4.5% 68 Cornell University, United States of America (USA) 67.92 57.81 115 -14.9% 69 Leibniz Association, Germany 48.61 57.73 163 18.7% 70 University of California Davis (UC Davis), United States of America (USA) 62.66 56 108 -10.6% 71 Technical University Munich (TUM), Germany 45.94 55.78 117 21.4% 72 Seoul National University (SNU), South Korea 68.93 55.4 96 -19.6% 73 East China Normal University (ECNU), China 55.26 55.18 86 -0.2% 74 The Pennsylvania State University (Penn State), United States of America (USA) 48.7 54.52 96 12.0% 75 Purdue University, United States of America (USA) 67.98 54.32 87 -20.1% 76 RWTH Aachen University (RWTH Aachen), Germany 51.69 53.94 93 4.3% 77 Princeton University, United States of America (USA) 54.24 53.75 80 -0.9% 78 Weizmann Institute of Science (WIS), Israel 43.39 51.81 72 19.4% 79 King Abdullah University of Science and Technology (KAUST), Saudi Arabia 32.11 51.51 111 60.4% 80 Columbia University in the City of New York (CU), United States of America (USA) 59.06 51.5 102 -12.8% 81 Oak Ridge National Laboratory (ORNL), United States of America (USA) 36.05 50.79 130 40.9% 82 Pohang University of Science and Technology (POSTECH), South Korea 35.24 50.53 99 43.4% 83 University of Erlangen-Nuremberg (FAU), Germany 55.36 50.28 90 -9.2% 84 Tianjin University (TJU), China 32.76 49.8 172 52.0% 85 University of California Irvine (UCI), United States of America (USA) 50.98 49.61 72 -2.7% 86 The Ohio State University (OSU), United States of America (USA) 38.42 49.4 71 28.6% 87 University of Bristol (UoB), United Kingdom (UK) 48.64 47.87 78 -1.6% 88 National Institute for Material Science (NIMS), Japan 42.49 47.79 123 12.5% 89 South China University of Technology (SCUT), China 39.41 47.7 93 21.1% 90 Kyushu University, Japan 44.68 47.14 92 5.5% 91 University of Florida (UF), United States of America (USA) 29.92 46.58 107 55.7% 92 Yonsei University, South Korea 38.49 45.47 85 18.1% 93 The Johns Hopkins University (JHU), United States of America (USA) 45.78 44.99 79 -1.7% 94 Pacific Northwest National Laboratory (PNNL), United States of America (USA) 55.57 44.91 89 -19.2% 95 National Taiwan University (NTU), Taiwan 38.78 44.35 96 14.4% 96 Shanghai Jiao Tong University (SJTU), China 51.29 44.32 95 -13.6% 97 Dalian University of Technology (DUT), China 41.3 44.11 86 6.8% 98 Argonne National Laboratory (ANL), United States of America (USA) 57.01 44.09 192 -22.7% 99 National Research Council (CNR), Italy 43.59 43.77 157 0.4% 100 University of Maryland, College Park (UMCP), United States of America (USA) 40.22 43.42 84 8.0% 八、 全球地球与环境科学排名 在地球与环境科学学科排名中,中国共有8所科研机构上榜,其中中科院排名与去年相同,以量的优势毫无悬念仍然占据第一位,形成第一梯队;中国科研机构排名第2、3位的南京大学和中国气象局全球排名分别为40、43,形成第二梯队;南京信息工程大学位列70位,与中国地震局、中国地质大学、国家海洋局、中国科大等机构形成第三梯队。与美、德、法等国家相比,中国在地球与环境科学学科领域无明显优势。 2015 Institution WFC 2014 WFC 2015 AC 2015 Change in WFC 2014-2015 1 Chinese Academy of Sciences (CAS), China 74.62 84.35 226 13.0% 2 Helmholtz Association of German Research Centres, Germany 68.78 72.64 228 5.6% 3 French National Centre for Scientific Research (CNRS), France 77.32 72.64 444 -6.1% 4 National Aeronautics and Space Administration (NASA), United States of America (USA) 53.17 55.59 231 4.5% 5 University of Washington (UW), United States of America (USA) 49.14 52.04 124 5.9% 6 U.S. Geological Survey (USGS), United States of America (USA) 38.66 47.61 124 23.2% 7 Swiss Federal Institute of Technology Zurich (ETH Zurich), Switzerland 41.69 42.29 118 1.4% 8 University of California, San Diego (UC San Diego), United States of America (USA) 54.32 41.79 118 -23.1% 9 California Institute of Technology (Caltech), United States of America (USA) 50.07 41.28 152 -17.6% 10 National Oceanic and Atmospheric Administration (NOAA), United States of America (USA) 50.36 38.44 156 -23.7% 11 University of Colorado Boulder (CU-Boulder), United States of America (USA) 36.77 34.62 118 -5.8% 12 Stanford University, United States of America (USA) 24.5 34 76 38.8% 13 Columbia University in the City of New York (CU), United States of America (USA) 32.52 33.81 104 4.0% 14 University of California Berkeley (UC Berkeley), United States of America (USA) 30.92 32.03 94 3.6% 15 The University of Tokyo (UTokyo), Japan 36.65 31.92 75 -12.9% 16 Woods Hole Oceanographic Institution (WHOI), United States of America (USA) 41.31 31.48 91 -23.8% 17 The University of Texas at Austin (UT Austin), United States of America (USA) 37.58 30.22 73 -19.6% 18 University of Minnesota (UMN), United States of America (USA) 17.9 24.58 65 37.4% 19 University of Oxford, United Kingdom (UK) 20.01 24.52 87 22.5% 20 University of Maryland, College Park (UMCP), United States of America (USA) 22.66 23.9 92 5.5% 21 University of Wisconsin-Madison (UW-Madison), United States of America (USA) 20.19 22.92 69 13.5% 22 Oregon State University (OSU), United States of America (USA) 18.91 22.83 71 20.7% 23 University of Cambridge, United Kingdom (UK) 28.08 22.35 74 -20.4% 24 Princeton University, United States of America (USA) 22.41 21.42 68 -4.4% 25 Utrecht University (UU), Netherlands 23 21.01 62 -8.7% 26 Japan Agency for Marine-Earth Science and Technology (JAMSTEC), Japan 22.61 20.61 76 -8.8% 27 University of California Los Angeles (UCLA), United States of America (USA) 19.05 19.21 82 0.8% 28 The University of Arizona (Arizona), United States of America (USA) 18.19 19.11 56 5.0% 29 Spanish National Research Council (CSIC), Spain 21.93 19.03 80 -13.2% 30 University of Bristol (UoB), United Kingdom (UK) 20.51 18.84 63 -8.1% 31 National Institute of Geophysics and Volcanology (INGV), Italy 17.95 18.71 46 4.3% 32 University of Michigan (U-M), United States of America (USA) 13.62 18.45 48 35.4% 33 National Center for Atmospheric Research (NCAR), United States of America (USA) 25.08 18.33 57 -26.9% 34 Massachusetts Institute of Technology (MIT), United States of America (USA) 37.75 18.27 72 -51.6% 35 Paris Diderot University (Paris 7), France 17.22 18.09 95 5.1% 36 University of Florida (UF), United States of America (USA) 16.91 17.94 48 6.1% 37 Smithsonian Institution, United States of America (USA) 11.89 17.89 63 50.5% 38 University of Leeds, United Kingdom (UK) 13.64 17.56 69 28.8% 39 Australian National University (ANU), Australia 20.42 17.33 62 -15.1% 40 Nanjing University (NJU), China 15.05 17.14 49 14.0% 41 Yale University, United States of America (USA) 21.88 16.98 50 -22.4% 42 The Pennsylvania State University (Penn State), United States of America (USA) 32.14 16.93 60 -47.3% 43 China Meteorological Administration (CMA), China 11.98 16.83 49 40.5% 44 The Commonwealth Scientific and Industrial Research Organisation (CSIRO), Australia 17.28 16.7 62 -3.3% 45 University of California Santa Barbara (UCSB), United States of America (USA) 13.72 16.65 52 21.3% 46 Harvard University, United States of America (USA) 19.47 16.35 52 -16.0% 47 Max Planck Society, Germany 18.91 15.98 79 -15.5% 48 University of Hawai'i at Manoa (UH Mānoa), United States of America (USA) 23.86 15.94 57 -33.2% 49 Institute of Research for Development (IRD), France 21.17 15.71 175 -25.8% 50 Arizona State University (ASU), United States of America (USA) 13.66 15.69 38 14.9% 51 University of Toronto (U of T), Canada 18.16 15.52 39 -14.5% 52 Imperial College London (ICL), United Kingdom (UK) 10.33 15.18 59 47.0% 53 Colorado State University (CSU), United States of America (USA) 17.51 14.51 40 -17.1% 54 Brown University, United States of America (USA) 17.95 14.12 34 -21.3% 55 Texas AM University (TAMU), United States of America (USA) 15.39 14.06 45 -8.6% 56 The University of British Columbia (UBC), Canada 10.85 13.92 43 28.2% 57 University of California Irvine (UCI), United States of America (USA) 14.88 13.88 33 -6.7% 58 McGill University, Canada 11.83 13.75 49 16.3% 59 University of California Santa Cruz (UCSC), United States of America (USA) 13.07 13.62 43 4.2% 60 Rice University, United States of America (USA) 11.6 13.51 28 16.4% 61 Leibniz Association, Germany 16.58 13.23 67 -20.2% 62 The University of Georgia (UGA), United States of America (USA) 8.1 12.99 28 60.4% 63 University of Southampton (Soton), United Kingdom (UK) 12.56 12.85 56 2.3% 64 University College London (UCL), United Kingdom (UK) 9.29 12.71 55 36.9% 65 University of Bremen (Uni Bremen), Germany 18.17 12.63 51 -30.5% 66 Tohoku University, Japan 12.19 12.56 30 3.0% 67 U.S. Department of Defense (DoD), United States of America (USA) 14.31 12.51 38 -12.6% 68 Georgia Institute of Technology (Georgia Tech), United States of America (USA) 12.61 12.36 40 -2.0% 69 University of Alberta (U of A), Canada 8.77 12.25 29 39.6% 70 Nanjing University of Information Science and Technology (NUIST), China 6.15 12.15 38 97.6% 71 The University of Western Australia (UWA), Australia 10.13 12.07 45 19.1% 72 Durham University, United Kingdom (UK) 11.7 11.58 36 -1.0% 73 Carnegie Institution for Science (CIS), United States of America (USA) 12.81 11.55 45 -9.8% 74 China Earthquake Administration (CEA), China 9.46 11.45 39 21.1% 75 The University of Edinburgh, United Kingdom (UK) 8.28 11.44 44 38.2% 76 China University of Geosciences (CUG), China 10.96 11.2 33 2.2% 77 University of California Davis (UC Davis), United States of America (USA) 23.46 11.01 38 -53.1% 78 Stockholm University, Sweden 15.27 10.99 38 -28.0% 79 State Oceanic Administration (SOA), China 14.59 10.98 35 -24.7% 80 University of Bern, Switzerland 8.92 10.95 44 22.8% 81 Pierre and Marie Curie University (UPMC) - Paris 6, France 13.06 10.9 121 -16.5% 82 Hokkaido University (Hokudai), Japan 12.19 10.84 30 -11.0% 83 Environment Canada (EC), Canada 10.51 10.7 35 1.8% 84 State University of New York at Stony Brook (SUNY Stony Brook), United States of America (USA) 5.12 10.42 29 103.5% 85 University of Miami (UM), United States of America (USA) 16.25 10.12 27 -37.7% 86 Department of Fisheries and Oceans Canada (DFO), Canada 7.86 10.12 33 28.7% 87 University of South Florida (USF), United States of America (USA) 7.05 10.09 26 43.1% 88 Monash University, Australia 10.2 9.98 30 -2.2% 89 Curtin University, Australia 7.88 9.83 33 24.7% 90 University of Bergen (UIB), Norway 10.87 9.82 36 -9.7% 91 University of New South Wales (UNSW), Australia 9.59 9.79 37 2.1% 92 University of Lausanne (UNIL), Switzerland 4.63 9.63 25 108.2% 93 University of Copenhagen (UCPH), Denmark 5.94 9.57 44 61.1% 94 University of Delaware (UD), United States of America (USA) 4.58 9.51 22 107.5% 95 University of Connecticut (UConn), United States of America (USA) 6.03 9.49 18 57.5% 96 University of California Riverside (UCR), United States of America (USA) 6.72 9.44 21 40.4% 97 National Taiwan University (NTU), Taiwan 8.78 9.41 25 7.1% 98 Hebrew University of Jerusalem (HUJI), Israel 8.68 9.37 22 7.9% 99 University of Science and Technology of China (USTC), China 8.71 9.33 22 7.1% 100 University of Southern California (USC), United States of America (USA) 10.1 9.29 28 -8.1% 九、 全球生命科学排名 从Nature提供的数据来看,中国在全球生命科学学科领域的影响力较为薄弱,其中在其他三大学科雄踞榜首的中科院在该学科排行榜中也只能屈居第9,在中国排名2、3位的北京大学和清华大学位列75和77,此外再无中国科研机构上榜。在该榜单中表现最好的为美国,前10强中占据7席,科研实力领跑全球。 2015 Institution WFC 2014 WFC 2015 AC 2015 Change in WFC 2014-2015 1 Harvard University, United States of America (USA) 606.45 550.24 1307 -9.3% 2 National Institutes of Health (NIH), United States of America (USA) 320.63 308.3 744 -3.8% 3 Stanford University, United States of America (USA) 166.88 235.59 541 41.2% 4 Max Planck Society, Germany 220.88 199.34 689 -9.8% 5 Yale University, United States of America (USA) 179.04 185.1 392 3.4% 6 Massachusetts Institute of Technology (MIT), United States of America (USA) 185.42 171.21 620 -7.7% 7 University of California San Francisco (UCSF), United States of America (USA) 175.96 162.87 433 -7.4% 8 University of California, San Diego (UC San Diego), United States of America (USA) 168.44 155.51 419 -7.7% 9 Chinese Academy of Sciences (CAS), China 152.31 154.61 441 1.5% 10 University of Oxford, United Kingdom (UK) 152.13 151.71 456 -0.3% 11 The Johns Hopkins University (JHU), United States of America (USA) 145.65 145.56 350 -0.1% 12 French National Centre for Scientific Research (CNRS), France 150.59 145.15 977 -3.6% 13 University of Toronto (U of T), Canada 157.66 144.26 352 -8.5% 14 University of Pennsylvania (Penn), United States of America (USA) 141.85 138.78 339 -2.2% 15 Columbia University in the City of New York (CU), United States of America (USA) 141.86 134.8 373 -5.0% 16 University College London (UCL), United Kingdom (UK) 116.62 128.39 454 10.1% 17 University of Michigan (U-M), United States of America (USA) 133.72 126.86 320 -5.1% 18 University of Cambridge, United Kingdom (UK) 134.43 126.61 423 -5.8% 19 Washington University in St. Louis (WUSTL), United States of America (USA) 121.56 122.34 278 0.6% 20 University of California Berkeley (UC Berkeley), United States of America (USA) 120.95 120.66 316 -0.2% 21 University of Washington (UW), United States of America (USA) 125.91 118.25 339 -6.1% 22 University of California Los Angeles (UCLA), United States of America (USA) 123.1 116.02 312 -5.8% 23 Duke University, United States of America (USA) 111.9 114.07 324 1.9% 24 Cornell University, United States of America (USA) 114 113.72 342 -0.3% 25 The University of Tokyo (UTokyo), Japan 99.44 107.21 247 7.8% 26 University of Wisconsin-Madison (UW-Madison), United States of America (USA) 92.37 103.47 206 12.0% 27 New York University (NYU), United States of America (USA) 99.46 100.2 249 0.7% 28 The University of Texas Southwestern Medical Center (UT Southwestern Medical Center), United States of America (USA) 104.98 97.71 212 -6.9% 29 Baylor College of Medicine (BCM), United States of America (USA) 84.35 89.58 231 6.2% 30 University of North Carolina at Chapel Hill (UNC), United States of America (USA) 97.6 89.32 239 -8.5% 31 Helmholtz Association of German Research Centres, Germany 87.05 86.97 460 -0.1% 32 The Rockefeller University, United States of America (USA) 66.54 86.27 202 29.6% 33 McGill University, Canada 70.82 85.45 248 20.7% 34 The University of Chicago (UChicago), United States of America (USA) 96.36 82.06 236 -14.8% 35 Vanderbilt University (VU), United States of America (USA) 79.77 77.71 183 -2.6% 36 University of Pittsburgh (Pitt), United States of America (USA) 74.21 74.24 203 0.0% 37 National Institute for Health and Medical Research (INSERM), France 71.16 74.02 622 4.0% 38 Northwestern University (NU), United States of America (USA) 75.22 70.46 191 -6.3% 39 Princeton University, United States of America (USA) 48.37 70.14 135 45.0% 40 Memorial Sloan Kettering Cancer Center (MSKCC), United States of America (USA) 77.02 68.78 187 -10.7% 41 Weizmann Institute of Science (WIS), Israel 55.36 65.66 120 18.6% 42 The Scripps Research Institute (TSRI), United States of America (USA) 72.07 64.13 180 -11.0% 43 University of Minnesota (UMN), United States of America (USA) 52.99 62.07 177 17.1% 44 Imperial College London (ICL), United Kingdom (UK) 74.42 61.78 346 -17.0% 45 University of California Davis (UC Davis), United States of America (USA) 80.11 60.12 178 -25.0% 46 Spanish National Research Council (CSIC), Spain 67.73 59.44 243 -12.2% 47 Emory University, United States of America (USA) 74.5 59.25 156 -20.5% 48 University of Copenhagen (UCPH), Denmark 59.72 58.25 227 -2.5% 49 University of Zurich (UZH), Switzerland 59.61 57.28 225 -3.9% 50 The University of Texas MD Anderson Cancer Center, United States of America (USA) 61.82 56.46 166 -8.7% 51 The University of British Columbia (UBC), Canada 64.51 56.28 148 -12.8% 52 University of Massachusetts Medical School (UMass Medical School), United States of America (USA) 68.66 55.73 166 -18.8% 53 California Institute of Technology (Caltech), United States of America (USA) 63.39 54.92 116 -13.4% 54 University of Southern California (USC), United States of America (USA) 43.22 54.89 170 27.0% 55 The Ohio State University (OSU), United States of America (USA) 58.06 54.62 151 -5.9% 56 Swiss Federal Institute of Technology Zurich (ETH Zurich), Switzerland 76.13 53.56 175 -29.6% 57 Institute of Physical and Chemical Research (RIKEN), Japan 58.71 53.22 189 -9.3% 58 The University of Edinburgh, United Kingdom (UK) 50.93 53.08 178 4.2% 59 University of Basel (UB), Switzerland 55.1 52.97 159 -3.9% 60 Icahn School of Medicine at Mount Sinai (ISMMS), United States of America (USA) 63.95 52.41 189 -18.0% 61 Albert Einstein College of Medicine (Einstein), United States of America (USA) 49.81 51.51 138 3.4% 62 Karolinska Institute (KI), Sweden 65.97 47.94 228 -27.3% 63 Osaka University, Japan 49.91 47.89 144 -4.0% 64 Case Western Reserve University (CWRU), United States of America (USA) 51.42 47.83 121 -7.0% 65 The University of Queensland (UQ), Australia 55.14 47.17 154 -14.5% 66 Boston University (BU), United States of America (USA) 48.28 47.09 178 -2.5% 67 King's College London (KCL), United Kingdom (UK) 41.66 46.85 272 12.5% 68 The University of Manchester (UoM), United Kingdom (UK) 41.63 46.84 147 12.5% 69 Medical Research Council (MRC), United Kingdom (UK) 49.64 46.27 237 -6.8% 70 Heidelberg University (Uni Heidelberg), Germany 44.94 45.3 165 0.8% 71 Ludwig Maximilian University of Munich (LMU), Germany 59.4 45.12 225 -24.0% 72 Salk Institute for Biological Studies (Salk), United States of America (USA) 30.68 44.94 128 46.5% 73 Kyoto University, Japan 62.09 44.77 142 -27.9% 74 The University of Texas at Austin (UT Austin), United States of America (USA) 54.84 44.61 98 -18.6% 75 Peking University (PKU), China 46.78 44.37 140 -5.1% 76 Indiana University (IU), United States of America (USA) 51.9 44.17 137 -14.9% 77 Tsinghua University (TH), China 29.95 43.43 124 45.0% 78 Hebrew University of Jerusalem (HUJI), Israel 38.66 42.95 108 11.1% 79 University of Illinois at Urbana-Champaign (UIUC), United States of America (USA) 42.87 42.64 116 -0.5% 80 Utrecht University (UU), Netherlands 42.68 42.61 167 -0.2% 81 Leibniz Association, Germany 37.42 42.21 234 12.8% 82 The Pennsylvania State University (Penn State), United States of America (USA) 49.72 40.52 108 -18.5% 83 National University of Singapore (NUS), Singapore 34.08 40.3 178 18.2% 84 University of California Irvine (UCI), United States of America (USA) 52.7 39.84 102 -24.4% 85 University of Montreal (UdeM), Canada 41.74 39.13 133 -6.2% 86 Rutgers, The State University of New Jersey (RU), United States of America (USA) 71.01 39.07 123 -45.0% 87 European Molecular Biology Laboratory (EMBL), Germany 33.29 38.71 175 16.3% 88 University of Utah (Utah), United States of America (USA) 46.23 38.61 139 -16.5% 89 Mayo Clinic, United States of America (USA) 30.56 38.47 118 25.9% 90 Istituto Di Ricovero e Cura a Carattere Scientifico (IRCCS), Italy 35.29 38.09 198 7.9% 91 F. Hoffman-La Roche AG, Switzerland 48.62 37.86 104 -22.1% 92 University of Florida (UF), United States of America (USA) 38.23 37.09 127 -3.0% 93 University of Tübingen (Uni Tübingen), Germany 35.21 37.09 156 5.3% 94 University of Freiburg (Uni Freiburg), Germany 40.99 36.28 145 -11.5% 95 University of Colorado Denver | Anschutz Medical Campus (CU Anschutz), United States of America (USA) 43.46 35.78 108 -17.7% 96 University of Cincinnati (UC), United States of America (USA) 30 35.55 109 18.5% 97 The University of Georgia (UGA), United States of America (USA) 29.21 35.37 86 21.1% 98 State University of New York at Stony Brook (SUNY Stony Brook), United States of America (USA) 31.27 35.06 107 12.1% 99 St. Jude Children's Research Hospital (St. Jude), United States of America (USA) 32.21 34.26 83 6.4% 100 The University of Iowa (UI), United States of America (USA) 40.85 34.18 87 -16.3% 十、 全球物理学排名 该榜单中,相比较于化学及地球与环境科学学科影响力而言,中国大陆高校上榜数量及排名优势相关数据虽然逊色不少,但实力仍然不容小觑。其中中科院依然盘踞第一,另有北京大学(13)、清华大学(19)进入前20强。其他上榜机构有中科大、南京大学、复旦大学、浙江大学和苏州大学。 2015 Institution WFC 2014 WFC 2015 AC 2015 Change in WFC 2014-2015 1 Chinese Academy of Sciences (CAS), China 406.27 409.07 1513 0.7% 2 French National Centre for Scientific Research (CNRS), France 332.6 312.47 2889 -6.1% 3 Max Planck Society, Germany 299.22 312.03 2100 4.3% 4 The University of Tokyo (UTokyo), Japan 201.47 216.05 852 7.2% 5 Massachusetts Institute of Technology (MIT), United States of America (USA) 211.91 205.12 806 -3.2% 6 Stanford University, United States of America (USA) 212.77 204.03 802 -4.1% 7 Helmholtz Association of German Research Centres, Germany 208.58 180.23 801 -13.6% 8 Harvard University, United States of America (USA) 195.07 167.24 1210 -14.3% 9 University of Cambridge, United Kingdom (UK) 183.65 167.06 947 -9.0% 10 Swiss Federal Institute of Technology Zurich (ETH Zurich), Switzerland 137.4 139.02 515 1.2% 11 University of California Berkeley (UC Berkeley), United States of America (USA) 147.11 124.22 792 -15.6% 12 University of Oxford, United Kingdom (UK) 108.61 122.1 693 12.4% 13 Peking University (PKU), China 110.95 109.07 563 -1.7% 14 Princeton University, United States of America (USA) 101.94 104.82 496 2.8% 15 University of California Santa Barbara (UCSB), United States of America (USA) 116.83 103.34 395 -11.5% 16 Russian Academy of Sciences (RAS), Russia 112.31 101.56 755 -9.6% 17 Swiss Federal Institute of Technology in Lausanne (EPFL), Switzerland 103.35 100.41 401 -2.8% 18 California Institute of Technology (Caltech), United States of America (USA) 94.84 99.79 970 5.2% 19 Tsinghua University (TH), China 97.51 98.48 478 1.0% 20 University of Michigan (U-M), United States of America (USA) 110.97 96.12 497 -13.4% 21 University of Maryland, College Park (UMCP), United States of America (USA) 90.67 92.36 584 1.9% 22 University of Illinois at Urbana-Champaign (UIUC), United States of America (USA) 84.2 86.11 363 2.3% 23 University of California Los Angeles (UCLA), United States of America (USA) 81.51 84.76 368 4.0% 24 Columbia University in the City of New York (CU), United States of America (USA) 60.58 84.54 425 39.6% 25 University of Science and Technology of China (USTC), China 81.58 83.84 376 2.8% 26 Nanjing University (NJU), China 69.95 81.36 366 16.3% 27 Tohoku University, Japan 75.7 81.3 244 7.4% 28 Lawrence Berkeley National Laboratory (LBNL), United States of America (USA) 84.25 80.32 547 -4.7% 29 Cornell University, United States of America (USA) 68.6 78.12 301 13.9% 30 Spanish National Research Council (CSIC), Spain 106.51 77.27 1193 -27.5% 31 The University of Texas at Austin (UT Austin), United States of America (USA) 98.17 76.37 393 -22.2% 32 Kyoto University, Japan 75.69 75.73 319 0.0% 33 Imperial College London (ICL), United Kingdom (UK) 71.1 75.43 366 6.1% 34 Nanyang Technological University (NTU), Singapore 72.88 72.36 170 -0.7% 35 Northwestern University (NU), United States of America (USA) 69.41 70.14 243 1.1% 36 The Pennsylvania State University (Penn State), United States of America (USA) 67.32 68.94 387 2.4% 37 Leibniz Association, Germany 69.25 68.18 365 -1.5% 38 National University of Singapore (NUS), Singapore 82.97 67.22 165 -19.0% 39 University of Wisconsin-Madison (UW-Madison), United States of America (USA) 51.3 65.87 363 28.4% 40 Fudan University, China 56.29 65.38 142 16.1% 41 Atomic Energy and Alternative Energies Commission (CEA), France 65.08 64.97 780 -0.2% 42 Institute of Physical and Chemical Research (RIKEN), Japan 56.49 64.82 272 14.7% 43 Oak Ridge National Laboratory (ORNL), United States of America (USA) 52.78 63.11 202 19.6% 44 European Organization for Nuclear Research (CERN), Switzerland 43.8 62.47 367 42.6% 45 Georgia Institute of Technology (Georgia Tech), United States of America (USA) 50.98 61.68 172 21.0% 46 Indian Institutes of Technology (IITs), India 59.9 61.15 163 2.1% 47 University of Pennsylvania (Penn), United States of America (USA) 57.82 60.07 221 3.9% 48 National Institute for Astrophysics (INAF), Italy 56.15 59.88 1057 6.6% 49 University of Toronto (U of T), Canada 57.77 59.85 382 3.6% 50 Seoul National University (SNU), South Korea 72.33 59.77 240 -17.4% 51 National Research Council (CNR), Italy 76.22 59.05 298 -22.5% 52 Yale University, United States of America (USA) 64.74 58.98 395 -8.9% 53 National Institute of Standards and Technology (NIST), United States of America (USA) 68.38 58.13 241 -15.0% 54 University of California, San Diego (UC San Diego), United States of America (USA) 74.29 58.08 251 -21.8% 55 University of Minnesota (UMN), United States of America (USA) 45.79 57.08 281 24.7% 56 University of Washington (UW), United States of America (USA) 55.95 55.36 369 -1.1% 57 The University of Chicago (UChicago), United States of America (USA) 74.85 54.79 396 -26.8% 58 University of Colorado Boulder (CU-Boulder), United States of America (USA) 65.83 54.13 300 -17.8% 59 Argonne National Laboratory (ANL), United States of America (USA) 64.76 53.76 352 -17.0% 60 Technion-Israel Institute of Technology (IIT), Israel 49 53.52 195 9.2% 61 University College London (UCL), United Kingdom (UK) 46.12 53.4 416 15.8% 62 U.S. Department of Defense (DoD), United States of America (USA) 58.38 53.34 248 -8.6% 63 Ludwig Maximilian University of Munich (LMU), Germany 49.32 53.26 361 8.0% 64 Zhejiang University (ZJU), China 48.46 51.87 142 7.0% 65 Purdue University, United States of America (USA) 54.03 51.62 201 -4.5% 66 Los Alamos National Laboratory (LANL), United States of America (USA) 76.46 51.59 261 -32.5% 67 Technical University Munich (TUM), Germany 47.91 51.48 265 7.5% 68 Pierre and Marie Curie University (UPMC) - Paris 6, France 52.29 51.22 1016 -2.0% 69 National Institute for Material Science (NIMS), Japan 66.38 50.1 146 -24.5% 70 Durham University, United Kingdom (UK) 50.69 49.97 346 -1.4% 71 Weizmann Institute of Science (WIS), Israel 53.7 49.95 229 -7.0% 72 Osaka University, Japan 67.26 48.38 226 -28.1% 73 IBM Corporation, United States of America (USA) 52.65 47.32 103 -10.1% 74 Australian National University (ANU), Australia 49.78 46.99 371 -5.6% 75 Pohang University of Science and Technology (POSTECH), South Korea 36.67 46.67 100 27.3% 76 Perimeter Institute for Theoretical Physics (PI), Canada 39.69 46.4 149 16.9% 77 Korea Advanced Institute of Science and Technology (KAIST), South Korea 59.12 46.17 101 -21.9% 78 Rice University, United States of America (USA) 54.42 46.09 184 -15.3% 79 Brookhaven National Laboratory (BNL), United States of America (USA) 46.56 44.53 248 -4.4% 80 The Ohio State University (OSU), United States of America (USA) 52.15 44.49 400 -14.7% 81 University of Geneva (UNIGE), Switzerland 36.01 44.31 371 23.0% 82 University of Copenhagen (UCPH), Denmark 43.45 44.12 383 1.6% 83 University of Southampton (Soton), United Kingdom (UK) 41.61 44.03 268 5.8% 84 University of Hamburg (UHH), Germany 42.67 43.28 239 1.4% 85 Tel Aviv University (TAU), Israel 48.1 42.86 240 -10.9% 86 University of Würzburg, Germany 34.99 41.54 186 18.7% 87 Rutgers, The State University of New Jersey (RU), United States of America (USA) 43.19 40.66 194 -5.8% 88 The Johns Hopkins University (JHU), United States of America (USA) 50.43 40.61 408 -19.5% 89 Tokyo Institute of Technology (Tokyo Tech), Japan 52.87 40.16 216 -24.1% 90 National Taiwan University (NTU), Taiwan 54.64 40.1 149 -26.6% 91 Soochow University, China 31.93 39.99 86 25.2% 92 Johannes Gutenberg University Mainz (JGU), Germany 32.45 39.76 221 22.5% 93 Delft University of Technology (TU Delft), Netherlands 39.03 39.47 86 1.1% 94 Heidelberg University (Uni Heidelberg), Germany 35.89 39.08 458 8.9% 95 Leiden University, Netherlands 34.13 38.98 432 14.2% 96 National Aeronautics and Space Administration (NASA), United States of America (USA) 36.74 38.63 946 5.2% 97 State University of New York at Stony Brook (SUNY Stony Brook), United States of America (USA) 37.76 38.43 229 1.8% 98 University of Paris Sud (Paris 11), France 42.55 37.91 489 -10.9% 99 Lund University (LU), Sweden 30.6 37.26 192 21.8% 100 Nagoya University, Japan 37.96 37.06 253 -2.4%
原文: http://www.liwenbianji.cn/bmc-retraction?utm_source=SNutm_medium=postutm_campaign=july-workshop 随着亚洲在科研论文发表领域占据日益重要的地位,一些无良公司也蠢蠢欲动,企图浑水摸鱼。 最近,BioMed Central因“ 同行评审涉嫌造假 ” 退稿了43篇来自亚洲的论文。BioMedCentral资深编辑Elizabeth Moylan表示,“ 很有可能部分科研人员在一些声名狼藉的中介机构蛊惑下,试图不当操纵审稿过程。 ” 国际出版伦理委员会(COPE)在一份关于“同行评审造假”的 声明 中指出,“ 我们并不确定试图发表论文的作者是否意识到这些机构提供的评审人姓名和电子邮件地址是‘骗人’的。 ” 作者为了发表论文,经常需要寻求第三方的帮助。在此过程中,作者很可能在不知情的情况下将他们辛辛苦苦获得的研究成果托付给一些唯利是图的公司。 这种现象由来已久。 《科学》 和 《自然》 杂志以前就警告过存在同行评审造假的现象。 此次作为主流媒体的《华盛顿邮报》报道的BioMed Central撤销论文一事 以及 之前的 Journal of Vibration and Control 撤稿事件 则使这一现象为社会公众所周知。 BioMed Central和其他利益相关方为纠正此类现象所作出的努力令人击节叫好;不过,科研人员需要警醒的是,一旦卷入此类事件,将对其研究声誉产生长期的不良影响。 与以往相比,作者们更有必要选择一家声誉卓著、备受推崇的公司来帮助他们成功发表论文。 理文编辑(Edanz)是COPE的准会员,同时也是施普林格(Springer)、BioMed Central和美国物理联合会(AIP)出版社所信赖的语言润色合作方。20年来,理文编辑致力于在亚洲国家提供文字润色服务,为帮助作者成功发表其论文提供了方方面面的周到服务。 理文编辑坚定支持行业标准和研究伦理。提供公开透明的、合乎伦理的服务是理文编辑始终不逾的承诺。一旦发现稿件中涉及伦理问题,理文编辑会在第一时间为作者提供指导。 BioMed Central 总编 Caroline Black 提出:“研究表明来自中国及亚洲其他地区的科研产出持续的增长,并融合成为全球科研全体中的重要一环,对于出版道德的重视是至关重要的。了解并遵守这些出版伦理道德将有利于研究人员,并促进他们研究成果的推广。因此,科研人员选择一个有信誉的论文服务公司来帮助他们顺利的走上成功发表之路,例如理文编辑,就显得尤为必要了” 英文原版: As Asia becomes a larger player in publishing research, the threat of unscrupulous companies looking to profit from this growth also increases. In recent months BioMed Central retracted 43 articles that all had roots in Asia, following “ inappropriate manipulation of peer review .” Elizabeth Moylan, Senior Editor, (Research Integrity) at BioMed Central stated, “ It is possible that some researchers may have innocently become implicated in attempts to manipulate the peer review process by disreputable services. ” In tackling the subject of peer review manipulation in general, a statement from COPE read, “ We are unclear how far authors of the submitted manuscripts are aware that the reviewer names and email addresses provided by these agencies are fraudulent. ” In seeking help along the path to publication, authors may unwittingly be placing their hard-earned research in the hands of companies who don’t have the author’s publication interests at heart. This isn’t a new problem, with the likes of Science and Nature having previously raised awareness of peer review manipulation by individual authors. The issue has been further highlighted in mainstream media with The Washington Post reporting on the BioMed Central retractions and earlier retractions from the Journal of Vibration and Control . The efforts of BioMed Central and other stakeholders to confront these problems are to be applauded but awareness amongst the authoring community needs to be increased, given the potential long-term implications on researcher reputation if involved in these practises. For authors, choosing a trusted and established company to help themselves along the path to publication seems even more important than ever. Edanz, an associate member of COPE and a trusted Language Editing partner for Springer, BioMed Central and AIP Publishing, has been providing editing services within Asia for 20 years and offers services to authors at each stage of the path to publication and beyond. Edanz supports industry standards in publication and research ethics, practicing this commitment through transparent and ethical services as well as offering guidance to authors should an ethical issue arise with their manuscript. Caroline Black, Editorial Director at BioMed Central, states As research output from China and the rest of Asia continues to grow and integrate as an important part of the global research community the importance of publishing ethics are paramount. Awareness of and adherence to these publishing ethics will benefit the researchers and help to advance their findings. It is important that researchers choose a reputable editing service, such as Edanz, to help them along the path to publication. 详情请见: http://www.liwenbianji.cn/bmc-retraction 理文编辑 | Since 1995
Wiley 将陆续推出论文投稿系列在线讲座,邀请期刊资深主编和编辑为广大作者解答论文写作及投稿中的各种问题。您只需要一台可以上网的电脑,准备好耳麦,即可在线参与我们的讲座。 第四十四期:国际妇产学期刊文章发表诀窍 主讲人: Patrick Chien ,BJOG副主编 Patrick Chien,医学博士,现任职于苏格兰Ninewells医院和Ninewells医学院。Patrick 是英国皇家妇产学院会员,同时也是英国皇家妇产科医学院院士考试的考官,参与本科生医学考试标准建设,现在是 苏格兰北部产科学会的名誉秘书长 。Patrick加入 BJOG: An International Journal of Obstetrics Gynaecology 编辑团队长达15年,在妇产科国际论文出版方面有着丰富的经验, 目前还主导“BJOG特刊:中国妇女健康”的编撰工作 。Patrick的主要研究方向为小创口外科手术处理月经功能障碍和慢性盆腔痛,研究兴趣包括普通妇产科、病例报告、小创口外科手术、系统评价等。 Elizabeth Hay, BJOG执行总编 Elizabeth毕业于英国伯明翰大学生命科学学院。毕业后作为编辑人员加入英国皇家公共卫生学会(RSPH)的市场和传播部门。她在RSPH为两本期刊服务:Public Health和Perspectives in Public Health,同时她也作为重要成员之一辅助市场营销、会议和展览工作。2010年10月,Elizabeth作为助理编辑加入BJOG;2011年10月,她被任命为 BJOG的执行总编 。 讲座内容: BJOG: An International Journal of Obstetrics Gynaecology隶属于 英国皇家妇产学院(RCOG), 是妇产科学领域知名的国际期刊, 2013年影响因子3.862(在妇产学期刊中排名第六)。 本次讲座邀请到了该刊的副主编及执行总编担任主讲,为广大中国作者介绍如何在国际妇产学期刊上发表论文。 1. BJOG的研究范围、稿件选择标准及审稿流程 2. 在国际妇产学期刊发表文章所需的技巧、工具及资源 3. BJOG如何帮助您将发表论文的价值最大化 4. “BJOG特刊:中国妇女健康”介绍及征稿 讲座时间:2015年6月24日19:00-20:00 点击填写信息完成报名: http://www.diaochapai.com/survey/b0d1d795-c748-4f0c-8d49-71e94699ed84 BJOG计划在2016年出版一期关于 中国妇女健康 的特刊,该特刊将由 Professor Jun Jim Zhang 和 Professor Tao Tony Duan负责组稿。欢迎您的投稿!(2015年10月31 日截止投稿) BJOG: An International Journal of Obstetrics Gynaecology 期刊简介 BJOG: An International Journal of Obstetrics Gynaecology 影响因子( Impact Factor ): 3.862 JCR 期刊引证报告排名 ( ISIJournal Citation Reports Ranking ): 6/78 (Obstetrics Gynecology) 期刊简介: BJOG 是英国皇家妇产科医师学会( RCOG )拥有的一份编辑独立的出版物。本期刊刊载产科学和妇科学所有领域包括避孕、妇科泌尿学、生育力、肿瘤学和临床实践中原创性的同行评审类工作。该期刊的目标是刊载全世界的女性卫生领域中最高质量的医学研究。涵盖的领域包括:产科学、助产学、母体医学、胎儿医学、妇科泌尿外科学、妇科肿瘤学、妇科内分泌学、不育 、生殖医学、生殖泌尿医学、性医学、出生前诊断、围产医学、细胞病理学、综合妇科学、社区妇科学、计划生育、流行病学、生殖伦理学、医学教育研究、绝经以及手术妇科学。 欢迎点击阅读(限时免费开放) BJOG 中国特刊 (China Virtual Issue)
前天刚开过Zoological Systematics(原动物分类学报)的编委会。会上,作为新编委成员,我建议开辟专栏,邀请专家围绕动物系统学的概念、理论、方法等方面的进展和对其它学科的贡献等进行述评。学术期刊是分享科学发现、研究成果的地方,更应该是学术观点纷呈的园地。 恰好最近英国皇家学会会刊发表了一篇传粉者多样性的论文。该论文弱化了最关键的物种鉴定部分,把作出重要贡献的分类学工作者放到了致谢中,忽略了他们在整个项目中的作用和投入的时间。这在蜜蜂分类学者圈中引起了较为热烈的讨论。我把问题也转到昆虫分类鉴定群、ResearchGate、LinkedIn等,期待同行的关注和思考。 实际上,这样的问题不仅仅出现在蜜蜂的研究工作中。以传粉者为例,膜翅目、鞘翅目、双翅目、鳞翅目等四大目物种数量仍然占多数。每个类群的分类、鉴定都是建立在长期的积累基础之上。而到了物种水平,分类学者的结果是慎之又慎。英国拥有英国自然历史博物馆这样超级分类学机构,拥有丰富的模式标本和一流的分类学家。但是,即便是在那里,也有许多类群无法得到轻易的鉴定。以蜜蜂总科为例, Hylaeus , Lasioglossum 、 Nomada 、 Sphecodes 等种类仍然有大量的种类有待研究并定名。 如何优化分类学者和其他学科队伍的科学合理的互动? 其他学科工作者对分类学有什么样的需求? 分类学者本身有哪些环节有待改进? 分类学者和爱好者之间可以如何进行互动? 关于最后一点,引用Science上最近一篇综述的部分内容: 虽然 GBIF 是存放其它生物多样性来源数据的数据库,但是这些来源有待更多的注释。有些比如 Tropicos 很专业,拥有 420 万号标本。物种分布知识中增长最快的资料库来源于大量的爱好者提供数据。观鸟者是数量最多的, eBird 成为了一个国际储蓄库。在 2010 年已经有超过 10 万观鸟者和超过 1 亿的观测记录。这就允许做精密的动物分布图和以月份为单位的动物分布的动态变化。如此丰富的数据扭曲了更加全面的生物多样性的统计和评估,但也推动着其它非明星类群的研究。 要想做到有效,观测需要鉴定,而鉴 定需要训练和技能的掌握。最近在图片共享技术和社交网络提供新的机遇和进展。就拿 iNaturelist 来说,应用程序让业余的观测者和专业工作者之间进行分工。前者通过智能手机熟练地分辨并上传图片,后者鉴定并编目,形成观测结果。在业余观察者和专家的合作中,现在在不同的分类单元中有了高质量的产物。 iNaturalist 已经记录了超过了 50 万条记录,而且也成为了较受欢迎的应用程序。 自:Science 30 May 2014: Vol. 344 no. 6187 DOI: 10.1126/science.1246752 我在ResearchGate、LinkedIn上发起讨论: https://www.researchgate.net/profile/Chao-Dong_Zhu/questions Being a taxonomist, how and what do you contribute to teams or projects in other fields? I'm conceiving a few paragraphs to discuss on contributions from taxonomists, demands from other topics and gaps between taxonomists and other researchers. Here, taxonomists are not limited to alpha level who focus mainly on species identification and classification. Certainly, taxonomists have been spending much valuable time and rich expertise to contribute a lot to some important projects, especially those on biodiversity, ecology, evolutionary biology, invasion biology, plant protection, conservation biology, and emerging genome biology. Also, governments demands more for quarantine of pests. However, there is a trend that more and more teams appreciate taxonomists' contributions only in the acknowledgement part of papers. Why? How to fill in the gaps? How to optimise the interactions between taxonomists and other researchers? Your answers/comments are mostly welcome. If you are willing to act as the coauthor(s) of this potential manuscript to Zoological Systematics, please kindly email me at sea@ioz.ac.cn. 转自John Ascher博士在论坛的内容 Where is the UK's pollinator biodiversity? The importance of urban areas for flower-visiting insects Katherine C. R. Baldock , Mark A. Goddard , Damien M. Hicks , William E. Kunin , Nadine Mitschunas , Lynne M. Osgathorpe , Simon G. Potts , Kirsty M. Robertson , Anna V. Scott , Graham N. Stone , Ian P. Vaughan , Jane Memmott DOI: 10.1098/rspb.2014.2849 Published 11 February 2015 http://rspb.royalsocietypublishing.org/content/282/1803/20142849 Insect pollinators provide a crucial ecosystem service, butare under threat. Urban areas could be important for pollinators, though theirvalue relative to other habitats is poorly known. We compared pollinatorcommunities using quantified flower-visitation networks in 36 sites (each 1 km2)in three landscapes: urban, farmland and nature reserves. Overall,flower-visitor abundance and species richness did not differ significantlybetween the three landscape types. Bee abundance did not differ betweenlandscapes, but bee species richness was higher in urban areas than farmland.Hoverfly abundance was higher in farmland and nature reserves than urban sites,but species richness did not differ significantly. While urban pollinatorassemblages were more homogeneous across space than those in farmland or naturereserves, there was no significant difference in the numbers of rarer speciesbetween the three landscapes. Network-level specialization was higher infarmland than urban sites. Relative to other habitats, urban visitors foragedfrom a greater number of plant species (higher generality) but also visited alower proportion of available plant species (higher specialization), bothpossibly driven by higher urban plant richness. Urban areas are growing, andimproving their value for pollinators should be part of any national strategyto conserve and restore pollinators. Acknowledgements We would like to thank Mark Pavett, John Deeming, Brian Levey, Mike Wilson, Ray Barnett, Roger Ball and Stuart Morris for taxonomic expertise, along with land owners and managers for access to sites. We thank Daniel Montoya, Ian Cleasby and Beth Atkinson for statistical advice and the following field assistants: Sally Donaldson, Peter Harris, Joe Hicks, Jasmine King, Olivia Norfolk, Mark Otieno, Despoina Roumpeka and Juan Carlos Ruiz-Guajardo. This work is based on data provided through the NERC (Centre for Ecology and Hydrology), Ordnance Survey, Office for National Statistics, UK Data Service (EDINA UKBORDERS, and Casweb MIMAS), Natural England, Countryside Council for Wales and Scottish Natural Heritage, and uses boundary material which is copyright of the Crown. rspb.royalsocietypublishing.org John Ascher : These folks categorize bees as: bees, bumblebees, honeybees,and solitary bees. That more than one-quarter of bee species in the UK are obligate parasites does not seem to be of interest to them. I see that theyhave no known (to me) taxonomists as authors and those that were involved can,I suppose, count themselves fortunate to have their name cited in theacknowledgments. I suppose that's the formula for publishing bee ecology in agood journal Claus Rasmussen : The issue is probably deeper than this and relates toacademic appointment and funding for taxonomists in Europe. Some of the bestbee-workers in Europe are not to be found at Universities... John Ascher : I would say most of the best at the very least, and not inthe national collections either John Ascher : Interesting that the most important workers publishing inthe best journals are happy to rely on amateur researchers provided they don'thave to pay them or include such troublesome people as authors John Ascher : It certainly is important to know about parasites! Gidi Pisanty : Two questions: 1. Most ecological bee research involves IDing bees byseveral different experts, to cover all taxonomic groups. There are not manyexperts like John that can cover so many different taxa altogether, most limittheir expertise to anywhere from family to a single genus. Here in Israel weusually send our bees to around 10 different experts each year. Should allthese appear on our papers? Or just the ones of the common groups? Where do youdraw the line? And how many people, to start with, should appear on such apaper? 2. I thought the important work of taxonomists was to dospecies revisions and similar stuff, not to ID specimens. This is why L Packerand others promote bee barcoding, and this is why Brazilian experts train otherpeople to do their IDing work (so I heard?). So you disagree with theseinitiatives? John Ascher : 1. At least one person who has at least minimal competenceregarding bee diversity and life history should be respected. Maybe you can'tenlist Paul Westrich or Max Schwarz but at least you can get someone who has abasic understanding of these matters. Furthermore, the paper in question has 12non-taxonomist authors, which I find absurd, yet your comment implies that itwould be problematic to add a mere ten taxonomic experts. Gidi Pisanty : I don't imply anything, I wanted to understand yourposition. Waiting for No. 2... John Ascher : 2. The important work of taxonomists is to do speciesrevisions but this work is low impact so we can't do this if wewant to have viable careers. Statistical meta-analyses and the like are what ispermissible in good journals. Not having Stockholm Syndrome myselfI have little interest in supporting such efforts if senior taxonomists are notrespected. I am extremely disappointed by your comment as it implies that theability of those who can actually identify bees and know where they live tocontribute to an important paper is limited to trivial ID ofspecimens. On that subject, you can imagine the quality of the IDing done byparataxonomists. That's a failed model as shown by implosion of INBIO. Idisagree strenuously with any and all exploitative or ill-conceivedinitiatives! John Ascher : To be fair to Gidi his views are generally held by thecommunity so he is not personally to blame John Ascher : Regarding barcoding, that's another effort that, likeparataxonomy, has failed to reach its stated goals due to its fundamentaldisrespect of collections-based taxonomy and its practitioners Gidi Pisanty : As I said, I don't really have a strong view on the subject.This is what I used to think and I fully understand your points and open tochange my view. John Ascher : I suggest reviewing the science in good journals andprestigious status assessments asking yourself if it is correct and useful tous, policy makers, the public, and other stakeholders. If so, no worries. Ifnot, I suggest that we need to make a change starting now. James C. Trager : Not just a problem for bees. I see this for ants, plants,grasshoppers, etc. where great ecological conclusion are proclaimed while theauthors have an appalling lack of taxonomic and natural history knowledge John Ascher : I would ask for support from my peers in academia but few ofthese exist as they can't find jobs... John Ascher : Wouldn't mind if scientists in general were struggling butit seems they are doing fine as long as they say as far away as possible fromanything that might be construed as taxonomy John Ascher@James C.Trager : ants and grasshoppers are already too specific for animportant study. Don't get down in the weeds like that. Better to call themterrestrial arthropods Gidi Pisanty : I still find it a bit odd, that even for the fauna of theUK, which is not very diverse and is so well studied and characterised inpublications including detailed keys (correct me if I'm wrong) - even thisfauna, in your opinion, necessitates IDing by the professional taxonomiststhemselves and no-one else? (I acknowledge your point about the parasitesthough) Liz Day : IDing specimens never seemed trivial to me. John Ascher@Liz : the PIs of important studies surely agree that specimenidentification (etc.) is really important when it's becomes a bottleneck fortheir work, and then suddenly become quite friendly, but somehow are not sowelcoming when allocating funding, leadership of important projects, andauthorship or, if you do make the cut, when sorting out the more contentiousscientific issues (what does a mere content provider have to offer,having discredited themselves by generating actual data?) John Ascher : Point taken, Gidi, but the UK has an exceptionally small andexhaustively surveyed fauna and even there very few can hope to identify themore difficult Lasioglossum , Andrena , Nomada and Sphecodes etc.Also, we're still waiting for the definitive work on the British fauna aren'twe? Has Else published his masterwork? I thought the best European keys wereby, e.g., Scheuchl and Amiet et al., and the best photo documentation for CzechRepublic (i.e. non-British). Finally, did you miss my point that those who canidentify bees might perhaps also know enough about their behavior to preventthe 25% of parasites in the fauna being lumped in an amorphous beeor solitary bee category. The idea that professional taxonomistshave only their ID skills to offer diversity studies is ludicrous. You shouldknow better! Among other things, it is the taxonomists who bother to track downthe old literature. A lot to learn from that if you are a scholar, even if itwon't help you publish in good journals John Ascher : Also, did you miss my comment where I said you don't needthe best or all taxonomic experts involved, but consulting (and crediting!) atleast one of the better ones wouldn't hurt. Otherwise the work suffers (see anynumber of recent projects and publications) Stuart Roberts : As far as I am aware, every specimen collected in the UrbanBees project was identified to species by a properly paid bee specialist at theCardiff Museum. Their funding was an integral part of the bid process John Ascher : Too bad none the species-level or even thesubfamily-level information seems to have made it into the paper.Evidently in Britain you have advanced to the point where you can outsourcethis sort of tedious work to a contract bidder, as opposed toenlisting at least one academic peer, but at a cost to the final product,wouldn't you say? How come you never see the stats outsourced to non-authors? Gidi Pisanty : I agree that ecological community research can easilyneglect and exploit the field and experts of taxonomy which it so much reliesupon. When you send material to taxonomists, they can be reimbursed in severalways: 1) They get to keep duplicates from your material 2) They sometimes discover new species which they thenpublish 3) They benefit from the distributional data of yourspecimens 4) Some of them get paid directly for their work 5) Sometimes you add them as coauthor Our lab depends heavily on taxonomists for its work, and wemake an effort to keep up good relations with them. Some of them get paid, themajority don't. I admit that adding them as coauthors is usually not consideredan option. We could, theoretically, add one or two experts to each paper -probably those that received the majority of specimens. But since most of ourstudies are concerned with the community and not specific taxa, it then becomesa bit awkward why one is coauthor and not the other. No doubt, taxonomists are also a valuable and rare source oflife history information, which I personally acquired from them for my recentpublished paper. Specifically, the example of neglect of parasitic bees is nota sound one - this is neglect at the level of the ecologist, not thetaxonomist! Any serious bee ecologist should know and notice that, consideringthe parasitism usually characterizes whole genera or subgenera, and not onlyisolated species. John Ascher : Gidi, there may be misunderstanding in that my concern isnot about professional taxonomists per se (hardly any of those in Europe anywayto worry about) but rather that at least one of the authors understands beediversity and life history and ensures this is not neglected. Doesn't matter ifthat person is primarily a taxonomist or an ecologist or something else. Inmuch of the world it is the collections-based taxonomists doing extensivefieldwork and possessing taxonomic libraries of old lowimpact publications who have an adequate understanding of bee diversity,not ecologists, but that may not be the case in Europe or in Israel. Also,Gidi, please consider that most taxonomists who want any sort of aviable career cannot follow the model you give above, although that may workfor retirees and amateurs or those very few who have secured a strictlytaxonomic position. Many colleagues who could be considered the besttraditional taxonomists are also deeply involved with bee ecology,conservation, molecular systematics, and other relevant fields. This is bynecessity, as even with broadly relevant skills it is really difficult toadvance in a world where sometimes you add them is a fifth optionto be employed by hypothesis-based scientists in a far superiorposition if they are so inclined. John Ascher : The example is a very sound one Gidi, as in my experience itis always those who understand specific taxa (whatever you may wishto call such people and however they are or are not paid or employable) who cancorrectly characterize the community, networks, conservation status, etc. Ifthere is a case where someone contemptuous of specific taxa andthose who know them made a correct insight into bee community ecology pleasesend me the reprint and I'll stand corrected. John Ascher : Gidi, when I think of ecologists I tend to think of the statisticalor theoretical ecologists who are running the show rather than seriousbee ecologists who concern themselves with trivial empirical matters likewhat tiny insects do in nature. Of course the latter would know aboutcleptoparasitic bees, but would likely be in the same leaky boat as thetaxonomists professionally (and would likely be a taxonomist at some level),i.e. hoping to be at best tacked on belatedly as option #5 for funding orauthorship by a benevolent statistician. John Ascher : Here is what an urban ecologystudy can include when led by ataxonomist: http://eprints.lib.hokudai.ac.jp/dspace/bitstream/2115/27559/1/19%281%29_P190-250.pdf Also instructive to compare the quality of ecological work on bees led by E. G. Linsleywith modern efforts.
At this time of year, many people around the world reflect on the past 12 months and write resolutions to improve their habits and set goals for the new year to come. In honor of this tradition, we thought it would be good to consider some resolutions related to writing habits to get the new year’s publication tasks off on the right foot. The best resolutions are ones that focus on very specific aspects for improvement and have progress you can easily monitor. We think the resolutions below fit this criteria and can be useful to anyone – from beginners to experienced authors – looking to improve their writing and publishing output this year. Use the active voice more. One of the most essential rules for academic writing, using the active voice makes your work more clear and concise. Sometimes it can feel more natural to write in the passive voice, but it unnecessarily drags out simple explanations about what was done and why. Most journals have a word limit for their articles and you want to maximize that space with key details and the implications of your findings, not unnecessary words. Eliminate jargon. Many researchers have a bad habit of including subject-specific jargon in their manuscripts without noticing it. Unless your paper is likely only to be read by peers in your field, it is best to try and be aware when you are using terms that people in other fields may not understand. Once you’ve identified this jargon, try to replace it with simpler terms. If this isn’t possible, do your best to define or explain the term at first use so it doesn’t make reading the rest of the paper overly cumbersome. Communicate better to your audience. For each paper or poster, think about what kind of information your specific audience wants or needs to know and tailor your writing to them . You know your study inside and out, but your readers don’t. Your manuscript must communicate the essential information needed for them to understand what you are trying to explain. Improve your self- editing skills . When you’ve spent a lot of time on a paper it can start to become so familiar you don’t notice complicated or repetitive phrasing or even gaps in your logic. The ability to step back from your work and be critical of it can go a long way toward helping you improve your drafts before you pass it along to a journal and peer reviewers. Take a break once you think you’ve finished a draft and work on something else. When you come back to it, read it as if you were reading someone else’s study in a journal or from the perspective of a peer reviewer. What flaws do you find? Is there anything unclear in the presentation of the study and its implications? Plan ahead. Deadlines for grants, conferences or journal submissions can often sneak up on you. Periodically throughout the year, assess the status of your ongoing studies and make realistic goals for what papers or posters can be written in time for any upcoming deadlines. Be sure to factor in time for peer review and revisions, as these can often take longer than expected . If you’re prepared in advance, you can avoid many last-minute stressors or the need to switch journals just to make your deadline. Are there any other resolutions you’ve made for the coming year you can add to this list? What about your writing are you looking to improve? by Amanda Hindle, Senior Editor published 2015-01-06
漫谈二流大学 2014-01-12 作者:李志文 2006年11月11日 大学士按:今天从豆瓣转来、略加编辑的这篇文章,是一位经历丰富的华人学者为中国大学未来发展勾画的思路,很长,很犀利,但时隔七年多,似乎也很无效……不过,还是建议各位细细读完,说不定在我们中间,就会走出未来中国的福泽渝吉呢。 上:本文作者 浙大新校长杨卫在接受《大学周刊》访问时,对大学发展,谈了些相当精辟的看法。他说:“以美国大学为例,它们是三流学校数论文篇数,二流学校数论文的影响因子,一流学校不对论文发表提要求,而顶尖的大学非常强调教学。” 然后,他做了精辟的分析: 一所学校的教师还没有形成很好的研究习惯时,学校从管理上要求教师发表论文,并且是在国际同行认同的期刊上发表学术论文,这样可以形成一个整体的驱动力,从统计学的角度上看,论文发表得多,就意味着教师花在做研究上的时间也多。 因此,三流大学要提升,就得要求师生多发表论文。 二流大学要求教师发表的论文,是在该领域里最好、影响因子最高的杂志上。如果某人一年能在这样杂志上发一两篇论文,他会被认为是国际知名的学者。 再发展,这位教师能几年磨一剑,做一些引导,引领这个学科发展,更带有原创性的工作,带领学科往前走,那他就是国际一流学者了。 所以,一流大学不要求教师发表很多文章,也不要求他们在顶尖杂志上发表,只是给更宽松的环境做研究,由教师在好奇心驱动下自由发展。 在国际上前几名的顶尖大学,所有的教授都是该学科同年龄段里最优秀的。因此,这些学校要求其教师除了保持自己作为这行顶尖的学者外,还要花时间在学生身上,让这些最好的学生受到教育和启迪。因此,每所学校发展阶段不一样,水平不一样,对发表论文所强调的内容也就不一样了。 上面这句话讲得太对了,太好了。不是在世界一流名校待过较长时间的学者,是不会有此高见的。杨卫到底是共和国建立以来第一个当了大陆大学校长的长春藤毕业生。 按照杨卫的标准,现在的清华、北大、浙大,刚刚进入世界的三流水准。十年前,中国大学是没有资格谈SCI的。现在,前五名的学校,清华、北大、浙大、复旦、南京在SCI的数量上,已经能在亚洲占一席之地了,拿到美国比比,也不见得丢人。中国有人海优势,再往后,这个成绩会更好。但这种比法再往后已经没有多大意义,因为人家二流学校,不跟咱比这个。要用人家二流学校的比法,我们的清华、北大、浙大,又回到起点上:重新洗牌,咱们的成果几乎是零。 我今天要谈的是我们的清华、北大、浙大还要做多久的三流大学?我们怎么才能进入一流大学?顶级大学是人人没有把握,只能当做一个崇高的目标。 我个人幸运地在美国顶级大学待过,我做助理教授中的三年就是在芝加哥大学度过的,然后到宾大的沃顿商学院当副教授。1980年的芝加哥大学商学院与经济系,应该是顶级,甚至是第一。在1990年,芝加哥统计过,90%的经济学诺贝尔奖得主与芝大有渊源,所有知名商学院的会计学与金融学的当家学者(是讲座教授,但通常不是系主任),与芝加哥大学有渊源。这几年,芝加哥大学的经济与商学,一流没有问题,顶级可能就不是公论了。现在顶级的位子,应该是哈佛与沃顿。1983年的沃顿应该只能算一流,哈佛商学院连一流都谈不上,甚至是被认为是一群二流学者拿着哈佛的老牌子在招摇撞骗。我的母校罗彻斯特大学在我念书的时候(1974年),应该是一流大学在做顶级大学的梦,现在是一流大学在往下降。我现在担任讲座教授的杜兰大学应该是一流的尾巴,杜兰从来没有做过顶级的梦,想都不敢想,连一流都岌岌可危。表面上都是美国的大学,二战以后,老美在各方面称霸了六十年,学术也不例外,不能不用老美来做度量衡(calibrator)。英国的三家,是十八世纪大英帝国的回光返照。 从我的分析来看,大家可以知道,二流与三流可以按学校来分,一流多少能按学校分,顶级的大学与顶级的专业就不一定在同一个学校了。顶级大学的排名是相当稳定的,基本上取决于历史、资源、地缘环境。顶级专业的排名是相当不稳定的,走掉一个大师,或大师失去了昔日的光彩,顶级的位置就保不住了。 以大学来分,现在的清华、北大、浙大,应该是三流,但在清华与北大,有些专业领域已经有点二流的味道,浙大是扎扎实实的三流。中国的绝大部分的大学是不入流。别难过,印度也一样。甚至日本也好不到那里去。日本自从百年前,有些大学冲进三流后,绝大部分的大学还是不入流。日本是靠武力与团结力在世界舞台上占有一席之地,在学术与思想上面是没有太多的建树的。这几年,北大与清华的国际化与超前意识,比绝大部分的日本大学要来得强猛。 我曾在香港科大做会计系的创系系主任,在离开科大那年,按顶级学术成果排名,做到了世界第一,但是多少是玩了花招,1999年的香港科大会计系应该是扎扎实实的二流顶端,应该是美国之外的第一名。香港科大的这个第一也是岌岌可危,香港中大来势汹汹。在会计学与金融学的领域里,全是老美天下,老欧只有亦步亦趋的份儿。由于拥有大海龟与牛外教,在会计与金融领域,香港的三大(港大、中大、科大)基本上比欧洲大学好,而且独步亚洲。 什么是二流大学? 杨卫为二流大学做了相当好但不完美的定义: 二流大学要求教师发表的论文,是在该领域里最好、影响因子最高的杂志上。如果某人一年能在这样杂志上发一两篇论文,他会被认为是国际知名的学者。 它不完美的地方,在“一年能……发一两篇”这句话上。我认为到了二流学校,基本上,已经不用简单的数字管理,在任何一个领域的最好杂志一年能发一两篇,是任何人都做不到的是,别说二流大学的教师了。我下面会详细分析。 我先分析一下三流大学与二流大学的不同。 三流大学,应该是像美国的California State、Kansas State、台湾成功大学、台湾大学、日本名古屋大学、韩国首尔大学、中国大陆的北大、清华、浙大这一类的大学。这些大学有一个共同特性,都是公立大学。公立大学是外行官员管内行学术专家,就是咱们所说的“红管专,外行管内行”。这些外行官员都要找一些“客观标准”来做管理依据,就自然数字挂帅了。在美国,这些大学都是资源较少的州立大学,这些大学,有些就被定位为教学型大学,像California State。有些是小州的州立大学,像Kansas State。这些大学,校长底气不足,难以抗拒州政府与议员的干涉。天下英才有限,到了这些学校,能分到的人才,就微不足道了,数字管理,简单明瞭,成本低廉。在亚洲,官本位下,校长发挥空间有限,许多是新兴国家,资源也有限,发展学术的第一步,就是先让教师们有拿到学位后继续念书的习惯。用SCI数目来管教授,就如同用考试来管学生,没有太多的实质教育与学术效果,但总比不管好。到了不入流的大学,基本上就是随意管了。台湾的有些私立大学、大陆的大部分大学就是这一类。 下面的表一是基于美国大学最被认可的排名,US News and World Reports 2006的报告,再依照我自己的判断,为顶级、一流、二流及三流大学列出一些例子。每一流中,按照排名的顺序,由高而低罗列。顶级与一流是全部罗列,二流、三流众多,只是例列。US News and World Reports的排名,是在美国最少争议的了。排名免不了主观判断,这个表只是例子,不是科学。表中的顶级与一流大学几乎清一色是美国学校,是因为美国有最好的制度设计,几乎把全世界的学术精英完全吸收过去。我在一流大学里,列了法国的Ecole Polytechnique,其实只是出于“公平”的考虑。法国的Ecole有点像中国的清华与北大,学生是最好的,不输给任何的一流大学,设备还不错,但是师资与学术环境就比美国的一流大学差多了。亚洲的三家二流大学:香港的科大与中大、日本的筑波都有很大的美国影响。读者可以指责我有偏见。我走遍世界,在欧、亚、北美、南美各国中的顶尖大学都有些朋友,参观大学、分析学术环境是我的嗜好,本文只能说是我的看法,不能说是我的科学论断。学术是尽可能地寻找客观的数据,但是学术结论都是带有主观色彩的。 在表一里,各位也可以看到,顶级大学全是美国的私立大学,较好的一流大学,还都是美国的私立大学,到了一般的一流大学,公立大学就多了起来。二流大学与三流大学基本上都是公立大学。没有列在表里的是世界上绝大多数的私立大学,它们都是不入流的。这就是资源与体制的互补了,私立大学体制灵活,如果有足够的资源,会办得比公立大学好。如果资源不足,私立大学的灵活体制反而导致它们胡作非为。 表一: 依照作者判断的大学流别示例 顶级(例):Princeton, Harvard, Yale, California Institute of Technology, Stanford, MIT, Chicago 一流甲:U Pennsylvania,Columbia, Duke, Brown, Cornell, UC-Berkeley, Washington U, Northwestern,Carnegie Mellon,U of Michigan, Johns Hopkins, Dartmouth College, Rice, Vanderbilt, Emory, Cambridge (UK), Oxford(UK), UC-LA, Georgetown 一流乙:UC-San Diego, UNC-Chapel Hill, U of Illinois, UT-Austin, NYU, U of Virginia, Toronto, UW-Madison, Ecole Polytechnique (France), U of Sothern California, U of British Columbia, Rochester, U of Minnesota, Case Western, Georgia Tech, Lehigh, U of Washington, UC-Irvine, Notre Dame, Tulane, Penn State, LSE (UK) 二流:Maryland, Florida, Ohio State, U of Pittsburgh, Boston U, Texas AM, Rutgers, Purdue, U of Iowa, Indiana-Bloomington, 香港科大, Michigan State, SUNY, Buffalo, U Kansas, U of Arizona, 香港中大, 筑波大学 三流(例):东京大学, 大坂大学, 清华, 北大, 首尔大学, 台大, 浙大, National Singapore U, U of Alabama, U of New Hampshire, California State U System, 成大 按:本表基于US News and World Report 2006的排名,再依作者的了解加以调整。US News and World Report的排名偏重本科教育的角度。本表的微调多考虑了些研究成果的因素。表上顶级与一流大学,作者大多亲身访问过,每一家学校都有相识,在其中一半学校,作者做过学术报告。 台湾的台大,大陆的北大、清华与浙大,被分到三流,是让人非常气愤与不服的。台大、北大、清华、浙大的学生素质绝对的超过我任教的杜兰大学。台大、北大、清华、浙大的老师的“脑素质”也不逊于杜兰大学的老师。为什么杜兰可以在一流大学中吊个尾巴,而我们的北大、清华被列入三流呢?因素很多,最重要的是,杜兰是美国的私立大学,北大、清华、浙大是中国的国立大学。环境与体制,决定了学术机器的生产效率,原料的品质(老师、学生的天生素质)当然也会影响成品的质量(学术成果),但绝对不是最重要的因素。这是本文分析的重点。 二流大学,应该是SUNY/Buffalo, Rutgers, Florida, Kansas与香港科大这一类的大学。这些大学由于资源、地缘、历史因素,没法子与一流大学较短长。表上的一流与二流大学的运作、目标、渴望,基本是一样的。它们只有程度的差异,没有本质的差别。顶级大学的年轻副教授通常是一流大学争聘讲座教授的目标,一流大学的少壮副教授通常是二流大学争聘讲座教授的目标。三流大学与二流大学之间的交流就要少多了。北大与清华已经有点二流大学的架势,就是因为,它们已经有点能力在一流大学的少壮精英头上动脑筋了,例如清华用了五年的时间操作,礼聘钱颖一从Berkeley回清华,浙大才刚刚有这个概念呢! 在顶级大学,谈文章的篇数,是粗俗的行为,被大家取笑、不耻。 在那种学校,著作等身、大气蓬勃是理所当然,有什么好吹的?在一流大学,学者是梦昧以求“这辈子”能有“一两篇”传世之作。 但是这个梦是深藏心底,不能说的,说出来就下流了。在二流大学,是公开的说:“想当教授,就得有一两个全垒打。”意思就是,想当教授,非得在顶尖杂志,发表一两篇论文不可。如果像杨卫说的,每年要发一两篇,就成了“牛饮”,只有三流学校的牛才这么公开地鬼叫。二流学校公开招聘讲座教授的时候,基本上看的是品质,不是数量。可是在内部提升的时候,基本上看的是数量,不是品质。人家已经都做牛做马怎么多年了,没有功劳有苦劳,咱二流大学资源有限,那能养得起这么多神仙?只要你还努力听话,时间到了,苦够了,也就当上了教授了。 看一个学校的教师管理机制,就能看出这家学校的定位。在顶级大学,教授几乎人人有个讲座(endowed chair),这些老爷都是千辛万苦从对手那里挖过来的。助理教授几乎没有一个能升上去,极少数能升上去的,老早就有对手在挖墙角,又得千辛万苦的挽留,年纪轻轻,就得给他个讲座教授。校长的任务不是“管”这些人,而是哄着他们,赔着笑脸,防着他们与别人“谈恋爱”。校长更重要的任务,是眼观四面、耳听八方,知道各专业领域的动向,聘请到领导未来二十年学术方向的大师。校长对大师那敢说个“管”字,磕头都还来不及呢!那怎么“管”这些老爷呢?出个假货怎么办?别担心,这些人好管极了。只要你的学校有足够的大师,顶级大学当然是大师如云,他们互相把对方管得贼紧。老子好不容易混到这个江湖名声,才能如此吃香喝辣,我们中间如果出了一个假货,别人对我们的本事产生怀疑,我的数十年修行,岂不被糟蹋了?在顶级大学里,每周定期的研讨会就是擂台,那些大师们,在擂台上杀得你死我活。 当然,如果一个顶级大学,请了个无能校长,一口气找了一群假大师,这个大学就马上出现劣币驱逐良币,这个顶级大学就垮了。这就是为什么,顶级大学都在美国,又都是私立大学。因为只有美国的顶级私立大学才能发展出一个极精细的大师互相监管的“教授治校”的机制。美国的普林斯顿、哈佛、耶鲁用了三百年的时间,用世界最优渥的资源,运用市场机能,慢慢把美国的学术巨厦的上梁弄正了弄直了,美国的一流大学像伯克莱、康奈尔才能放心的让教授来管自己,管学校,甚至管校长。 美国的三流大学基本上是官本位,跟咱中国一模一样。李远哲这个学化学的书呆子,居然在台湾倡导“教授治校”,把台湾的大学变成政治角力场,乌烟瘴气!三流公立大学如果教授治校,全校教授一定“挖社会主义墙角”。没有大师级的学术地位,就没有了赔不起的面子。教授跟装配工都是人,没有了赔不起的面子,就可以不要脸,一旦没有人管,就一定不要脸。三流大学用SCI数量管教授,就是防止教授不要脸,在我们管理学,这叫做防止“道德危险”(moral hazard)。 顶级大学与一流大学所耗用的资源是惊人的,在外人看来是极度的浪费与没有效率的。师资是名校的命脉,这个“浪费”与“低效’,在师资的培育上面最为显著。我用杜兰大学商学院做例子。杜兰商学院在过去十年,起码进了50个刚拿博士的年轻教师,每位教师的年薪,用2006年的价码,是15万到20万美元,每个年轻教师可以待六年,不升就走人。这十年的投资保守的估计是15万乘6乘50,总共4500万美元。只有四位升上副教授。其他的都为二三流大学做贡献了。我们的教授,基本上都是从外边挖角进来的,也就是说,顶级大学与其他的一流大学,用了更多的价钱为杜兰做了贡献。以顶级与一流大学合起来的50家学校做群体单位,90%的师资培育投资是为了二流大学做了贡献了。绝大部分的三流大学玩不起这个游戏,也就根本不玩了。从一流大学流落到三流大学的人,基本上都放弃了“研究”,反而一直在三流圈子的学者,有些会兴味怡然地玩着三流大学的数字游戏。 有人会说,这些90%的年轻教授,会为顶级与一流大学发表大量的文章,所以值这么多钱。哈!你就错了。杜兰的这50个人,在十年内,发表了大约50篇文章,其中三分之一是那升等的那四个人发的。其他46个人,几乎没有任何具体成果。用浙大、清华的数字管理概念来看,起码四千万美元是打了水漂了。在美国,95%的博士毕业生,这一辈子,不会在顶尖杂志发表文章。顶尖杂志的90%的文章,是1%的学者写的。在杜兰商学院,学术成果主要是五个讲座教授(师资队伍的5%)做的。 那么,我们不干脆就让这五个学者专做学问,何必花这么多钱,让这么多人陪着玩?这就是学术环境的成本,没有这么多人日以继夜的干,就没有一流的研究环境;没有九死一生,就没有英雄好汉。后面我会分析,什么叫一流的研究环境。 话说回来,中国可能穷些,中国的市场机制可能差些,中国的社会组织结构可能落后些。但是浙大、清华的许多教授的天生素质可一点也不比什么普林斯顿的那些书呆子差。凭什么人家可以教授治校,被校长哄着,伺候着,而我们清华、北大的念书人就得拍校长马屁,看书记脸色?我们也要教授治校,我们也要大师如云。好!有志气!那么,我们得先从三流大学转变成二流大学。下面我就分析如何把北大、浙大、清华转化成二流大学。 怎么样才能办成二流大学 我前面说过,顶级、一流、二流大学基本上没有本质的不同,差别在由于历史、资源、及地缘的关系[1]。他们优秀的程度不同,他们的办校宗旨、监管体制、评核方式基本是一样的。这些学校实质上是教授当家。二流以上的大学是一群学者的合伙组织(partnership)。而三流大学比较像工厂,教授只是拿薪水的“笔耕者”及“口力工人”。二流大学已经到了民主体制,而三流大学是农业社会的君主专制。 [1]关于历史于地缘对大学地位的影响,曾担任哈佛大学校长四十年之久的查理斯·艾略特说:“一所名副其实的大学必须是发源于本土的种子,而不能在枝繁叶茂、发育成熟之际,从英格兰或德国移植而来。它不同于棉纺厂,运营六个月就可以满足一种迫切需要。一所大学不是靠多在报纸发表一些社论,大量发布广告,或多拍几封电报就能建立起来的。” 从三流到二流,要比从二流到一流难得多。从二流到一流,甚至从一流到顶级,只要有资源肯拼命,就有可能做到。而从三流到二流是本质的改变,是思想的改变,是文化的改变,是价值观的改变。用经济发展来做比喻。从二流大学到一流大学就如同已经是工业社会的亚洲四小龙想赶上英国与意大利。香港与新加坡用了三十年,到了上世纪末已经做到了。从三流大学到二流大学,就如同满清的传统农业社会进入共和国的工业社会,打打杀杀一百五十年,到了1990年才算结束,经过了非常痛苦、血腥、漫长的转型过程。这转型的痛苦是由于价值观的改变与社会结构性的改变,影响了现有在位人的利益,让他们的人力资本,一夜间荡然无存。从二流到一流大学,是按同一个制度体系力争上游,而从三流大学到二流大学是否定了现有的制度体系。由于新的制度体系否定了现有的制度体系,反抗、破坏、挣扎就大得多。 在三流大学的体系里,文章数、学生数、头衔、行政职位是学术成果的评价标准,也是物质报酬分配的依据。在全是三流大学的官本位国度里,没有也不需要开放性的学术市场。在三流大学的体制下,要累积文章、学生、头衔、职位这些人力资源可不容易。首先做学生的时候就得选一个大牌做导师,当徒弟的,沏茶倒水、上街跑腿,样样周到。毕业后弄头衔、抢职位,又得卑躬屈膝、心狠手辣,一样不少。带着一批弟子打天下,要远交近攻,合纵连横,交了不少朋友,结了不少世仇。在数字挂帅的体制里,比的不是真知卓见,而是组织能力,政治手腕。一旦改变学术体制,原来的学术领袖,就像满清遗老,痛哭流涕,顿失依靠。反抗的意念,这么会没有呢? 在三流大学体系里,博导可以任命,文章数可以计算,虽然不理想,但可执行性高,虽然大家做点没用的研究混饭吃,倒也有些次序,每个大学各混各的,相安无事。到了二流大学体系里,大师不是校长任命就行了,得有真知卓学,没有一个市场机能做信息处理与汇总的工具,谁又知道那个是真大师,那个是假大师? 如果假大师的人数,超过一定的临界点,就会劣币驱逐良币,结果比三流大学体系还糟糕。三流大学的博导是绵羊,校长吼一吼,就乖乖低头吃草。二流大学的假大师,是披着珍贵貂皮的野狼,可以把校长都吃了。哈佛教授参议会才刚赶走一位做过财政部长、要改革哈佛教授懒散教学态度的年轻校长。谁对谁错,我说不清楚。人家哈佛有足够的真大师坐镇,如果那些假大师搞得过分,校长是冤枉的,真大师就都跑到普林斯顿或斯坦福去了。如果没有什么讲座教授因此离职,这个校长大概走得不太冤枉。这就是市场机制。中国有吗?这里有个小注脚。这个校长要整顿的对象,就是一个讲座教授, 他一气之下,拉了一批同事投奔普林斯顿去也。这位讲座教授是真大师或假大师,我不知道,隔行隔重山。但是,普林斯顿接受了这一批人马,哈佛校长因此去职,是非曲直,就有了公论,这就是市场机制。 办二流大学只是清华、浙大进入世界名校的一个过程,不是最终目标。最终目标是要成为世界顶级大学。真正的教育家是办教育,而不是争排名,就如同真正的学者应该是好奇与探索,而不是算文章数量。争排名、做文章的毛手毛脚,我知道些,我也做过些。我一生的志向与绝大部分的精力还是做个真学者、好老师。身为一个芝加哥学派的学者,我是不相信绝对道德观的,我认为道德是成本效益盘算下的产物,是社会制度的衍生品。做为一个理性的社会科学家,我要贡献的是如何透过理性的分析,设计一套制度机能,让人们自然地依自利的动机,做到对社会最大的贡献。因此,我对清华及浙大的建议,不是怎么玩些手法,把排名弄上去,而是以社会精英的心态,怎么为中国打造一个优良的学术与教育环境。在我前面的分析中,我已经清晰的指出,中国如果想要有个优良的学术与教育环境,就得有世界顶级的大学,这两三个顶级大学,会带动几十个一流大学,这几十个一流大学,会带动上百个二流大学。这些顶级、一流与二流大学是中国的知识泉源,会发展出千千万万的科技应用,会培育出无数个领袖、学者与教育家。我任教的浙大与清华,应该有舍我其谁的抱负。 在我的举例与分析中,大家可能已经感觉到,创建顶级大学最重要的一环,是以学术大师为核心的市场淘汰、监控与定价机制。顶级大学绝对不是一个官本位的农业社会能产生的。没有一个官,甚至没有任何一个人能有足够的专业知识来识别学术大师,但是市场能。市场的识别能力超过任何的专家,市场的淘汰、监控与定价机制是融合了市场所有专家的智慧。 中国以致亚洲都没有一个开放型的学术市场,在清华讲的是“三清”,东京大学谈的是“三东”。三清者,本科、研究生、教授职位都出身清华也。看清华出身的清华教授谈起三清的那副得意像,真恨不得指着他们的鼻子说:“你这三流古井里的青蛙。”我自己也有“三台”病。四十岁以前,我的梦就是回母校台湾大学教书。整个亚洲的学术精英都染了严重的科举病毒。如果一个大师是在十八岁那场考试决定的,这个大师百分之百是假的。没有真大师,就没有二流大学,就别提顶级大学了。没有开放的市场,就不可能有真大师。货真价实的学术大师是在残酷公平的市场上,百炼成钢的结果。清华、浙大、东大、台大只是个三流大学,真正的症结就在这里。因此要想成为一个二流大学的第一步,就是教师队伍不能有近亲繁殖。所有博士毕业生都要进入公开市场,不能留校。 大海养大鱼,小沟养泥鳅。学术界的大牛,集中在美国这个学术大草原,也就理所当然了。最大、最公平的市场杀出来的大师,应该是最厉害的。不只我们“落后”的亚洲得服气,近年来,连在“先进”的欧洲的大师都有浓浓的美国牛排味。清华、浙大要玩二流大学的游戏,就得进入北美学术大草原。各位看到吗?在表一里,一个只有三千万人口的农业国家加拿大,居然有两家大学被列入一流大学,就是因为地缘优势:它们位于北美洲英语语系的学术大草原上。如果把杜兰大学、南加大往南搬五百里,进了墨西哥,杜兰、南加大就什么流都不是,这就是地缘优势。 在中国生根的浙大与清华,地缘优势就别想了。没有地缘优势,也能成为二流大学,人家香港科大不是就做成了吗?香港科大还一度有一流大学的恢弘气势咧!出大师的学术市场不是要大要公平吗?中国市场虽然不公平,谁能说不够大呢?只要我们能借用美国市场体制让中国市场做到透明与公平,三十年后,世界学术中心在那里,谁都说不准呢! 如果为了进入这个北美洲英语语系学术大草原,要清华、浙大搬家是做不到的,但是参与英语语系的学术市场的必要条件,非满足不可。我是社会科学研究者,用英文谈中国的社会制度问题,真是■■■憋气!深深的伤害了我们的民族自尊心。心情平复后想想,咱们的汉文不就是中原西陲的秦戎话吗?中原周天子的话怎么说,现在谁也弄不清楚了。自然科学是不太受语言能力影响的,进入美洲英语语系学术大草原,对人文社会学科来说,要难得多。这是进入市场的必要交易成本。我知道,北大、清华的经济、管理科系已经在做了,香港科大的建校原则就是世界(其实就是美国)标准。我最近接到复旦大学要求我协助拟订世界顶尖期刊的排名,看来复旦也想杀进北美洲英语语系学术大草原了。 有效的市场机能一定要有优生劣败的竞争淘汰机制。美国二流大学以上,都有严格的淘汰机制,就是长聘(tenure)制度。顶级大学的长聘制度可以说是冷酷无情,惨不忍睹。连挂一流车尾的杜兰大学都是九死一生。长聘制度原来是保障教授的言论自由的,经过两百年的演变,成为美国学术最重要的“净化剂”。长聘制度是让最有前途的年轻学者,列入长聘教授的候选人,称为长聘岗(tenure track), 成为严格考核与培养的对象。 这个考核期,在顶级大学是九年,通过了就是正教授,而且很快的就是讲座教授。在一流与二流大学,通常是六年,通过后就是长聘副教授。顶级大学与一流大学的重要不同点之一,就是长聘制度的严格程度。顶级大学的斯坦福的考核期是九年,而它隔壁一流的伯克莱是六年。 顶级大学经过九年的严酷考核,不被打死,就成了大师。在顶级大学里,副教授这个职位是短暂的过渡。在较好的一流大学(表一中的一流甲)中,大部分的长聘教授,都能升等,可是在一流大学里资源比较不足的学校(一流乙), 就越来越多的终生副教授。因为在一流大学里,升等的标准是看对手想不想挖你。没有人来挖角,你就好好地等着,一辈子都别想升成正教授。好的一流大学挖角的能力强,被挖的或然率高,流通机制好,就没有存货。次一点的一流大学,挖角能力弱,被挖的或然率低,存货就多。到了二流大学,实在没有资源玩这个游戏,但是还想成为一个学术净土,在给长聘时是按照一流的标准打了点折扣,到教授升等的时刻,有些就只看苦劳不看功劳了。北大、清华、台大都没有采用这长聘制,所以就该列入三流大学之林。香港三大,尤其是科大,对长聘制,已经很认真执行十年以上了。 这个长聘制为“二级市场”(secondary market)提供了丰富的供给与需求。有人称这个市场为“旧货市场”(used market)。旧货市场的买家,不都是穷人(较次的学校),豪门大户也热衷得很。因为真正的学术大师就像好酒,越陈越香。学术大师是二级市场的常客。在一流大学最常说的话题,在顶尖大学几乎唯一的话题,就是某某人有了什么成果,是怎么来的,又有那家学校挖他了。这个丰富的二级市场,也为长聘制添加了新的功能:淘汰、筛选、信息、激励。对于一个极难客观评价的学术来说,长聘制的这些功能太重要了。没有长聘制、没有丰富的二级市场,就不可能有鲜活热闹、蓬勃兴旺的学术。由于中国没有长聘制,没有开放型的学者二级市场,中国就没有二流大学,更不必谈顶级大学了。清华就是请十个杨振宁来也没有用,请来一个诺贝尔奖得主,只是花钱买了个符号,培养了一个诺贝尔奖研究成果,才是顶级的大学。西南联大的吴大猷可以用杨振宁为例说他自己的学术成果,清华大学的王大中是没有资格这样说的。你知道吗?像杜兰这样的学校,是很少给诺贝尔奖得主荣誉博士的。我现在就是杜兰的荣誉博士遴选委员,我们要授予荣誉博士的,是有可能得到诺贝尔奖的人。锦上添花是三流人做的事。 在二流以上的大学里,重要行政职位,尤其是校长,都是全世界公开遴选的。权与钱是腐化的根源。一流大学有权有钱的学术单位,像商学院院长,基本上是从外引进的。一流大学的学术科系,每隔十来年就会从外面挖进一个系主任。外来的新主管有独立性,他不欠人情,没有瓜葛。他也有客观性,他可以冷静的分析这个单位的历史留存问题,他的做为与决策不会马上引发关联性的猜忌。他有开创性,把其他地方的成功经验引入。我有个亲身的好例子。EMBA教学是芝加哥大学首先推出的,并不太成功。后来给西北大学摸出了门窍,杜兰大学就挖了西北大学主管EMBA的副院长来当院长,做了两年,就出了成果,哥伦比亚大学又从杜兰手上把他抢了过去。EMBA就是这么样在美国遍地开了花,也影响了世界。 从我以上的分析,可以清楚的看出,浙大、清华如果关着门自己搞,是搞不成二流大学的。二流大学的建设要靠市场机制,因此想要摆脱三流大学的困局,就得拉一群背景相同、资源相似、有志向前冲的学校一起干,组建一个即竞争又合作的学术市场。我们应该结合中国大陆、台湾、香港、新加坡里的顶尖大学,成立像美国常春藤的学术联盟,与中国教育部共同推动,逐渐的将中国最有历史、最有潜力的大学的监管从教育部移转到校产基金会、校董会、顾问委员会的手里,将学术专业的监管移转到公开的学术市场。 中国经济改革开放的导师邓小平,有个真知灼见:“摸着石子过河”。市场不是一天造成的。市场的优化过程,纯粹是经验的累积,结集所有参与者的经验与智慧,不断的改进与摸索前进,最后胜出的机制,不是任何一个设计师能单独推导出来的。认识市场机能在学术监管与激励的重要,是一个质的飞跃。这一步,极不容易跨出,能跨出这一步,而不跌个四脚朝天,后面的路就会逐渐好走。 “摸着石子过河”的真髓是从一小步做起。张维迎这个小红卫兵,在北大搞的学术文化大革命,立意是好的,大方向也对,可是他可能患了他出国前上班的赵老板同样的错误:打击面广了些,步子快了些,调子高了些,手法硬了些。能让人家小老美,日以继夜、不眠不休、老老实实的干真学问的动力,不是校长室的一纸公文,也不是某某大师的大声吆喝,而是那些小老美俗不可耐的经济动机与市场压力。要在世界顶尖杂志发表文章,也不是随便说说就有的。学术这东西,是会者不难,难者不会。北大有这么多学者没有受过应有的研究方法、语言表达、思维方式的训练,硬是打鸭子上架,只有官逼民反。说到官逼民反,我在香港科大就患过同样的错误。三流大学的问题就在官本位的学术政策,做学术改革的也是用一纸官书,是很难成功的。 我觉得,学术改革,应该用利导而不是势逼,用市场机能,而不是用官方政策。要在原有的基础上寻找最容易突破的新成长点。对原有的教师与学术单位做增量改革。譬如说,把教科书教好要比做前缘研究容易得多,北大许多老师可能无法用英文发表惊世之作,用英文念教科书的本事总有吧!因此计算成果的时候,把文章数的比重压低,把文章质的比重加高,教好书的比重大于劣质文章数的比重,升等评核的时候,多邀请些香港与美国的华人教授参与,采用竞争上岗,竞争加薪。这些都是无法立竿见影的工作,学术本来就不是方便面。自古以来,成功的改革本来就是文火煮青蛙。有点良心与眼光的人都能看到张维迎对北大光华管理学院的贡献,及对整个北大学术改革的贡献。但想要人人讲好话就难了,不被乱石砸死,都算你张维迎走运的了。 案例:香港科大是怎么沦落成为二流大学的? 香港科大的成立,在亚洲学术发展史上,是一个划时代的大事。香港科大是亚洲第一个按世界一流大学的体制与框架搭建的大学,找到了真正有当世界一流大学校长的背景、见识、能力与经验的吴家玮,到香港来负责这个划时代的任务。其实,应该说是吴家玮找到了香港来实现他的理想,而不是香港人找到吴家玮去实现香港人的梦想。我不认为,当时在大中华地区(大陆、台湾、香港及新加坡),有任何一个官员或社会领袖真正懂得一流大学是什么回事。我要称赞香港的社会领袖,只有见多识广的香港精英才听得懂吴家玮说什么。大中华地区所有自命为研究型大学的校长或准校长,都应该在桌上放一本香港科大教职员手册,没事的时候,看一看,悟一悟:这些手册条文后面的含义在哪里? 我大声疾呼,建议我现在的老板,清华的顾秉林与浙大的杨卫,请吴家玮做你们的顾问。你们有吴家玮的聪慧,但你们没有他的阅历。学问的领悟是要在一流的环境中长期的熏陶,才慢慢深入骨髓。顾秉林与杨卫在社会科学上没有被长期熏陶的机会。社会科学里的市场机能跟自然科学里的物理机能不一样。物理机能的道理能在书本说清楚九成以上,市场机能得靠从经验、观察与失败中去领会。只有在市场玩过,才知道市场规律。办一流大学的道理是社会科学,不是自然可学。本文开场中,引用杨卫校长的那番话,是在五年前,没有一个中国大陆的校长能说得出如此精确的。这是因为杨卫有在美国一流大学受过完整博士训练的经历,在做学生时,耳濡目染,听老师、同学点评英雄豪杰。吴家玮在UC-San Diego 当过常务副校长(provost),他的经验与智慧是中国研究型大学的可贵资源。 现在把话头转回香港科大。在1991年,当我接受科大的邀请去香港看看的时候,科大寄来一些资料讨论科大的愿景及方案,其与众不同,就深深的吸引我。我与吴家玮深谈了几次,他的风度、气势、仪表、思想,与我见过的一流大学校长相比,犹胜一筹。他对科大的构想是许多美国一流大学校长的梦想,由于历史因素而只能是梦想。1991年到位的第一批教授,就是梦幻团队,同时拥有这一批学者,是许多一流大学无法企及的目标。在海滩之旁、峭壁之上的校园,吃定了书呆子的那颗清风皎月、美酒诗书的浪漫心怀。这个校园能让耶鲁大学校长嫉妒得高血压,更别提在可怕的哈林区之旁的哥伦比亚大学了。吴家玮带着科大的校园规划与建校大纲,到美国的顶级与一流大学转了一圈,立刻造成极大的轰动。我想,所有的华人,尤其是香港人,要为香港科大感觉骄傲与兴奋。香港政府应该把科大做为重要的战略布局,发展成整个亚洲的学术中心。 哈!我错了,大错特错。我刚到科大不久,有一次跟的士司机在车上聊起科大,他用非常愤怒的语气,大骂科大。说科大校长贪污,在家里盖了大游泳池,又说科大浪费人民血汗钱。我当时极为震惊。渐渐地,我发现香港的新闻媒体,几乎不报道科大,就是报道,也是批评多,赞誉少。在香港各角落,几乎闻不到一丝以科大为荣的气息。我们这一群很把自己当回事,在世界上也有些人把我们当回事的书呆子,在香港平民的眼中,啥都不是,就是一群糟蹋粮食的饭桶。 的士司机不了解科大,也就罢了,他们没有念多少书嘛,哪晓得哈佛与活佛的差别?大学生该了解我们这些国际知名学者的来头吧?有这个千载难逢的机会,还不争先恐后的报考科大?哈!我又错了,大错特错。我在科大的时候,以师资的真本事来排名,科大远远的第一,中大第二,港大遥遥第三。由于香港的高速经济发展,越新的学校师资越好。港大最老,师资当然最差,当时有些港大的教授,可能还做不了科大的研究生。在香港待一阵子后,我对香港的高校招生有些了解,才惊奇的发现,科大是香港学生的第三志愿,甚至是第四志愿。要命!连香港的知识分子,也没有把我们这些很把自己当回事的书呆子当一回事。 有些教授,包括我在内,就建议说,我们有这么好的师资,我们应该向全世界招生,尤其向中国大陆招生,为祖国服务。我还兴冲冲地在台湾、新加坡、大陆为科大扩充影响力,号召当地最好的学生考科大,也还真有些学生跃跃欲试。很快,我们发现,港台新陆都是官本位,根本没有市场机制,跨地域招生得通过四地教育部门协调,这一协调,要到哪个猴年马月? 逐渐地,有些老师又飞向海角天涯,留在香港的老师,有些被其他学校慢慢挖了墙角。逐渐地,在世界学术市场上,科大不再是亚洲唯一的亮点,不再英气勃勃。在1991年,世界顶级学者们眼中的亚洲唯一的一流大学,香港科大,到了1999年,就这么沦落成了二流大学。在香港百姓的眼中,还是香港地区的二等大学! 香港科大的案例,为我的理论提供了实证结果,也为浙大与清华发展学术,进入世界二流大学提供一些启发。一流大学要有资源、历史及地缘条件。科大在1991年,满足了资源的条件,而且满足了最难的资源条件:学校领导人与学术领导人。吴家玮与他请来的创校教授,对一流大学操作与学术市场的深刻了解,是到现在还没有亚洲另外一个大学可以比拟。可是科大的创立,也有基因病原(genetic disease)。其中之最,就因为它是个公立大学。公立大学就得跟没有专业知识的官员、议员打交道。这些官员、议员是学校的衣食父母,态度高傲蛮横(香港要比台湾、大陆好多了),而一流学校的操作是很难用客观的短期指标来衡量的,科大与这些官员、议员打交道,根本就是秀才遇到兵,有理说不清。还有,官员与议员有他们自己的烦恼与忧愁,他们可不会像我们这些书呆子,为办一流大学而拼命。 香港科大从零做起,没有历史,就没有历史包袱;但没有历史,也就没有群众基础。我起初有点纳闷,香港的官员、议员、学者、新闻记者,应该有不少人是多少知道吴家玮干了件多不容易的事的,为什么就没有人出来说句公道话?后来想想,他们能说什么呢?前面分析过,一流大学与三流大学是模式改变(paradigm shift), 一流大学的思维基本是否定三流大学的体系的。这些官员、议员、学者、新闻记者都是港大、中大的毕业生,难道要他们称赞这些外籍兵团,否定自己?这就如同小海龟孙文,到了北京跟大官僚李鸿章谈变法,是李鸿章听不懂?还是李鸿章没有傻到自残? 科大的地缘位置,也注定让它难以保住一流的架势。可以说,科大是一国两制的受害者。香港只有六百五十万人,做为一个香港的公立学校又不能在大陆公开招生,学生市场就只限于香港的弹丸之地。各位看看表一列出的一流大学,哪个不是全球招生的?香港科大是用国际一流的师资去教香港二流的学生,不只是资源浪费,师生都辛苦难过。最近一阵子,香港在谈教育资源整合,香港科大这个名字都有可能成为历史名词。没有历史,没有群众基础,就没有足够的选票来保护这个招牌。 香港科大曾经拥有世界一流大学的梦幻资源:一个有眼光、有魅力、有本事的校长,一群著作等身、国际知名的教授,一个青山绿水、优雅宜人的校园。但是科大没有历史,没有地缘优势。更重要的是,科大是家公立大学,陷身于扯不清的政治泥沼。科大在短暂的辉煌后,回归成香港高等教育的一个平民:一个世界级的二流大学。 我曾在慵懒的周末清晨,躺在清华园九公寓的床上,望着窗外遐想,如果没有文化大革命,没有己巳之变,1991年的中国应该已经到了贞观之治,即将要回归的香港,决定送祖国一个礼物:十亿美金、一个吴家玮、一群在世界擂台成长了三十年的华人学术精英。邓小平大笔一挥,这笔资金与这群书呆子,进驻清华园,从零做起,打造一个顶级的、自我监管的私立大学。这一来,资源、历史、地缘优势不都有了吗?今天的清华,又何至于在三流大学中挣扎?可能今天的清华已经是鄙夷哈佛、无视耶鲁的世界顶级大学。所有世界新科博士的皎皎者,论文一旦被导师首肯,马上就寄到清华,梦想着北京打来的邀请电话。大唐盛世啊!衣冠长安啊!你在何方? 如果我们以搭建香港科大品牌来评价吴家玮,吴校长并没有取得巨大成功,我给他一个“良”(西方的B)。如果我们以搭建学术平台来评价吴家玮,他的成功是划时代的。他并没有把香港科大办成一流,但是他把香港的七家大学办成二流。他的影响,还到了新加坡与大陆(台湾是个相对封闭的市场)。我前面分析过,从三流大学进入二流大学,是思想的改变,是质的跳跃。一旦进入二流大学的层次,进入一流大学就是只是资源与决心的问题了。 在香港科大创建之前,亚洲的所有大学,都是封闭式教学型的大学。别说国际间的竞争与合作,别提参与北美学术市场,在同一个城市内都老死不相往来。在1990年以前,亚洲最西化、最进步的新加坡大学与香港大学的老师都只是些英国与澳大利亚的学士与硕士。这些地区的学术领导人还公开说,澳大利亚的硕士训练都要比美国博士好得多。台湾的学者都是本校子弟,许多是从助教按年资爬上来的。在世界顶级的学术会议是看不到亚洲大学来的学者的。别说来打擂台了,连观众席里,都找不到。近年来,亚洲学术风气的蓬勃发展,香港的三大,甚至七大,都进入了二流大学之林。 这些与香港科大的创建,引起了欧美学术领袖的重视与另眼相看,逼着亚洲的学术当家人打开大门是有密切关系的。 结语 我对中国与大中华地区的经济与学术发展是非常乐观的,有些人甚至说我是盲目的乐观。逐渐地,我发现,就是乐观的我,也都低估了中国与大中华地区进步的速度。 一所一流大学的内部条件是资源、历史、地缘,外部条件是开放、透明、竞争的学术市场。浙大与清华起码有了历史与地缘的优势。中国之大,没有人能为了一己之私而垄断市场或阻止市场发展的脚步。这个庞大的市场,会养出大鱼,浙大与清华都有可能是条大鱼。 我认为,浙大与清华都没有理由毛躁,急吼吼地要长大。长大是必然,长得好,就不是定然。学术如同好酒,资源、历史、地缘有了,外部环境对了,剩下的就是耐心的等待。当今之急,是寻找资源与妥善运用资源。同时耐心地、逐渐地改变外部环境。 一流大学之间的竞争是君子之争,合作是道义的合作。研究型大学的师生是在学校与学校之间不断流动的。这些流动切断了个人的私心,增加了信息,辅佐了判断,加强了监控。 进入一流大学最难的一步,是从封闭性的三流大学跨出来。改革与利益重分配是孪生兄弟。在改革中,现有的当家人、在位者是输家。吴家玮并没有把香港科大办成一流,但是在新生的香港科大没有输家,个个是一流大学的支持者,甚至是狂热的信徒。科大的成功站住脚跟,有了成果,让香港其他六家大学能兵不血刃地进入二流大学。一个成功的改革,压力要来自外,不能来自上(会官逼民反),更不可能来自下(那就是造反,更是天下大乱)。浙大的成功蜕变要靠来自清华的压力,清华的成功蜕变要靠来自浙大的压力。公开、透明、全球性的市场竞争是必要的压力机能。 参考文献 Avery, C., M. Glickman, C. Hoxby, and A. Metrick, 2004, A revealed preference ranking of U.S. colleges and universities, NBER Working Paper. Manski, C.F. and D.A. Wise, 1983, College Choice in America. Cambridge: Harvard University Press. Spence, M. 1974, Education as a signal, Chapter in Market Signaling. Cambridge: Harvard University Press. U.S. News and World Reports, 2006, College Ranking.
随着我们国家的经济科技实力的提升,用汉语发表科技论文的呼声越来越高(仅科学网上就可以找到一大堆)。狭隘的爱国主义和出版界的经济利益驱动,一些人质疑,汉语是我们自己的,我们国家的经费资助下我们国家的科学家辛勤付出的结果,为什么要用别的国家的语言去发表论文呢?但真正每天看论文、写论文的人,多数还是倾向于用英语发表论文。这些人写英语都得心应手、信手拈来吗?当然不是,很大精力要花在英语语言上,而且经常因为英语不够好受到审稿人和编辑的批评。这种负担,谁不想解脱。但人在江湖、身不由己。 用汉语虽然简单,但多数同行看不懂,等于没发表;没发表等于研究白做了 。 我们虽是世界上人口最多的国家,但在全世界,中国人只占1/5而已。剩余的大多数地球人,扣除了讲英语的,还是一个很大的群体。他们的科学家是怎样想的呢?一种语言,不是轻而易举就能熟练掌握的,其他非英语国家的科学家像我们一样,也是实实在在地感受着使用英语的负担。 法国人要用法语代替英语写论文吗?不是。他们选择了另外一个思路:改造英语。最近,法国科学家Vic Norris在Trends in Microbiology上撰文,“ Scientific Globish: clear enough is good enough ”。这位法国人呼吁学术界改造学术英语,逐步形成一种简化英语,用于科技交流。 讨论这个问题,英美国家的科学家因为conflict of interest,似乎不适合参与讨论。该刊同一期发表了 两位俄国科学家的看法 。他们认为简化英语可能会助长非精确表达,母语非英语科研人员还是应该多花一些精力学好英语。 法国人的思路,乍一听,符合每一位母语非英语科研人员的需求。但简化一种语言,谈何容易。历史上最成功的,可能是我们汉语的简体字。但简体字是靠强有力的权力机关推动的,Scientific Globish似乎没这条件。俄国人的想法也等于没说。如果每一位科研人员都有精力和能力把英语学那么好,还用得着今天的讨论吗? 两边都否定,牛登科整个一个老愤青。愤青只适合酝酿气氛,不适合解决问题。在别的事上我是愤青,在这事上,还是有点理性想法。 首先,英语,还是应该尽可能多学一些,被动适应学术界的要求,人在江湖,入乡随俗。 更重要的是,所有非英语国家的科研人员,应该主动对复杂英语说不。审稿过程中,不仅他们可以批评我们的语言问题,我们也可以批评他们用词生僻、句型过于复杂、不适合非英语国家读者阅读。虽没有统计数字,但估计母语非英语的科研人员还是占了大多数。多数人,如果有意识,当然可以通过自身的权力(审稿)来改造大家使用这种语言的习惯。英语作为科技交流通用语言的地位,短期内难以改变。但非英语国家科学家合起来人数占优势时,每个人发挥自己的权力,科技英语自然会不断简化,Scientific Globish也就是自然而然,水到渠成了。 晒晒我对来自英美两国的两篇稿件的部分审稿意见: “。。。I hope you can make the paper readable to more scientists including non-native English speakers。。。”; 作者回复:“Two of my colleagues (one a non-native English speaker) have read the parts referred to by the Referee and are content with the new version.” “Also in the abstract, ‘It was possible to …’. At least to a reader not proficient in English (like me), it seems to be a sentense of。。。 ” 作者回复:“The sentence was revised.” 精彩地道的英语,但不适合母语非英语读者,现有一例:“ On the Immortality of Television Sets: “Function” in the Human Genome According to the Evolution-Free Gospel of ENCODE ”。这篇评论文章,各大博客网站中,被英美读者评价是非常精彩,与之相比,生物学类多数评论综述文章显得呆板乏味。这篇论文中,有一些词汇很少出现在专业文献中,属于有文学感情色彩的那种。就是因为这些词汇的存在,英美读者觉得它很精彩。但对英文水平一般的读者来说,就是很大的不方便。此文发表当天,我看了看,多处生词,没读下去,只是知道大概讲什么的。由于它和我的工作太相关了,而且网上影响极大,所以后来靠金山词霸、费了很大劲才读完了。感觉那些生词也确实使论文更精彩。如果我是这篇文章的审稿人,我会提醒作者,牺牲一点精彩,还是牺牲一些读者。没有绝对好的语言,只有适合大多数读者的语言。 即便是优美地道的英语,不适合我们阅读,我们有机会、有权力时,就可以让他们改正。呼应一下本文开头的一句话(用汉语简单,但多数同行看不懂,等于没发表;没发表等于研究白做了),用特别地道优美的英语写论文,他们感觉很简单,但母语非英语的同行看不懂,他们发表在国际期刊上的论文等于发表在社区大学的校报上了。我们在审稿过程中对他们的语言要求也是对他们好。“人在江湖、身不由己”的不光是我们,母语是英语的科研人员也应该是“人在江湖、身不由己”。
本课题组的新进论文“ Deregulation or Governmental Intervention?A Counterfactual Perspective on China ’ sElectricity Market Reform ”,已经在 China World Economy 期刊上发表,敬请关注。 论文的摘要请参见: http://onlinelibrary.wiley.com/doi/10.1111/j.1749-124X.2013.12030.x/abstract 论文的全文链接如下: http://onlinelibrary.wiley.com/store/10.1111/j.1749-124X.2013.12030.x/asset/j.1749-124X.2013.12030.x.pdf?v=1t=hj299oifs=782b71a902f9f679e0dd7ad6d128a6e65ddd3ee2
大多数科研人员和医师都熟悉科研伦理的概念,特别是在以动物和人作为研究对象时。大多数研究开始前也的确需要从所在研究机构的伦理审查委员会处获得批准。此外,就论文发表(包括医学媒体机构的使用)、作者署名、内容转载和数据的有效性也有相关规定。违反科研伦理和论文发表道德规范的行为会造成拒稿甚至被一些期刊禁止投稿。这些行为包括哪些、又该如何避免呢? 下列做法将被视为不符合科研伦理和论文道德规范: • 人和动物研究对象的不当使用 • 署名不端 • 一稿多投 • 重复发表 • 剽窃 • 捏造或篡改数据 多数人可能对第一条最为熟悉。使用人和动物作为试验对象的研究应遵守1975年《赫尔辛基宣言》中规定的伦理标准(世界医学协会2000年于爱丁堡修订),该宣言也促成了伦理委员会的建立。这些规范旨在确保人和动物研究对象的福祉,并规定研究必须要具备受试人提供的知情同意书;即他们已被告知试验的目的和性质,且同意接受此试验。所有使用人和动物为实验对象的研究必须遵守《赫尔辛基宣言》;如果未能遵守,研究者必须解释其所用研究方法的根据并从当地或研究机构的伦理审查机构获得批准。 署名不端问题出版社很想消灭,但现在仍常可见到。国际医学期刊编辑委员会 已经就署名资格制订了指南。根据ICMJE指南,署名资格必须基于:①对研究的构思/设计或数据的获取/分析/解释具有实质性贡献;②参与撰写论文,或对重要知识部分进行关键性修改;③同意终稿发表。这三条必须全部满足才能具备署名资格。相对次要的贡献者可在“致谢”部分列出。应当注意的是,一些期刊有自己的署名规定,通常含在《稿约》中。 “一稿多投”是指同时将同一个稿件投到多家期刊。这也许能为你节省些时间,但是一旦被发现你的论文就会被拒稿,并且有可能被禁止向这些期刊投稿。这种险完全不值得去冒。期刊编辑之间会定期会谈,并就可疑稿件进行互相交流。另外,不同的期刊也可能把你的稿件送交同一名审稿人审读,这样你的多投行为就会被发现。所以,在收到一个期刊的最终决定之前不应投到下一个期刊。 “重复发表”是指论文中包含之前已发表过的结果。期刊编辑要求论文具有原创性内容,并已于1969年形成政策:“仅考虑发表满足以下条件的稿件:其实质性内容没有在他处发表过,也没有同时投稿到其他地方”。这被称为Ingelfinger规则,以《新英格兰医学》当时的编辑FranzIngelfinger命名。该规则旨在避免期刊发表之前已发表过从而已失去原创性的材料。ICMJE指南(III.D.2重复发表)重申了该规则,申明“期刊编辑不愿收到此类稿件:其内容大部分已发表过,或包含在另一已投出或已录用的论文中”。这个规定有一些值得注意的例外,其中包括学术会议演讲稿及其摘要(尽管是例外,在投稿时还是需要公开说明此情况),以及研究者由于政府的考虑或公共健康的关系而必须发布的数据。 最后三种学术不端行为是:剽窃、捏造和篡改数据。美国国家科学基金把它们列为学术不端的鉴戒。剽窃是指“擅用他人的思想、方法、结果、或语言而未申明出处。这包括通过秘密审读他人论文或经费申请书所获取的信息”(出自Federal Office of Science and Technology Policy,1999)。转述是允许的,但其方式要恰当。如果要进行直接转述就要用引号表明,不然就需要变换说法。捏造是指无中生有地制造并报道数据,篡改则是指对试验进行操纵,或更改已获得的数据,导致所报道文献不能准确反映真实的研究状况。所有学术不端都有严重后果,从拒稿到解雇,以及可能的法律诉讼。 最后,不披露潜在的经济或其他利益冲突也可能被视作不端行为。作者投稿时通常会被要求申明有无利益冲突,其中包括是否有能影响你行为的经济或个人关系,例如你的工作情况、顾问身份和持股情况。利益冲突并不一定是坏事或论文发表的障碍,但应予申明。 科研人员、工程师和医师要知道那些是合乎伦理的行为,哪些是不端行为,这样他们才能避免后者。行为符合伦理能让同行、同事和期刊编辑对你有信心;而行为不端则可导致失去资助、解雇、禁止投稿、甚至法律诉讼。所以,务必要知道界限在那里。 Ethics: following good practice Mostscientists and clinicians are familiar with the concept of ethics as itrelates to research, particularly research involving human and animalsubjects. Indeed, most studies require ethical approval of theprotocols from an institutional committee (following internationallyestablished guidelines) before the research can commence. Additionalguidelines relate to publications practice (including the use ofmedical communications agencies), authorship, reproduction of content,and the validity of the data being presented. Unethical behavior canlead to rejection or even a ban from some journals. But what comprisesunethical behavior and how can it be avoided? The following practices are considered to be unethical: • Improper use of human subjects and animals in research • Improper authorship • Making multiple submissions of the same manuscript • Submitting a redundant publication • Plagiarism • Data fabrication and falsification Thefirst of these is probably the one that most people are familiar with.Experiments on human subjects and animals should follow the ethicalstandards set out in the Helsinki Declaration of 1975 (revised by theWorld Medical Organisation in Edinburgh in 2000), which led to theestablishment of ethics committees. These guidelines ensure the welfareof the animals or human subjects involved in research and require thathuman subjects provide informed consent for the experiments; that is,they are informed of the purpose and nature of the experiments andconsent to being subject to them. All research using human and animalsubjects must comply with the Helsinki Declaration or, if not, theresearchers must explain the rationale underlying their approach andobtain approval from a local or institutional ethical review body. Improperauthorship is unfortunately a frequently occurring practice thatpublishers are keen to put an end to. The International Committee ofMedical Journal Editors (ICMJE; http://www.icmje.org) have establishedguidelines for qualification for authorship. According to the ICMJE,authorship credit should be based on: 1) substantial contributions toconception and design, or acquisition of data, or analysis andinterpretation of data; 2) drafting the article or revising itcritically for important intellectual content; and 3) final approval ofthe version to be published. All three of these criteria need to besatisfied for a person to qualify for authorship. Lesser contributionsshould usually be noted in the acknowledgments section of themanuscript. It should be noted that some journals have their owncriteria for authorship; these are usually set out in the Guide forAuthors. “Multiple submissions” refers to the practice of submittingthe same manuscript to more than one journal, simultaneously. Althoughthis might save some of your time, if identified, it will result inyour paper being rejected and a possible ban from publishing in thejournals in question. It simply isn’t worth the risk. Journal editorsregularly talk to each other and will exchange information aboutsuspicious papers. It is also quite likely that different journals willappoint the same peer reviewers, leading to discovery of any additionalsubmissions. Therefore, you should not submit your manuscript to asecond journal until you receive a final decision from the firstjournal. Redundant publications are publications containing findingsthat have already been published. Journal editors want originalcontent, and this was put into policy in 1969 in the form of theIngelfinger rule, “the policy of considering a manuscript forpublication only if its substance has not been submitted or reportedelsewhere”, named after Franz Ingelfinger, the editor of the NewEngland Journal of Medicine at that time. The aim of this rule was toprotect the journal from publishing material that had already beenpublished and had therefore lost its originality. The rule isreiterated in the ICMJE Guidelines (III.D.2 Redundant Publication),which states that journal editors “do not wish to receive papers onwork that has already been reported in large part in a publishedarticle or is contained in another paper that has been submitted oraccepted for publication elsewhere”. Notable exceptions to this includepresentations at scientific meetings and published abstracts (althoughfull disclosure of these should be made at the time of submission) andsituations in which researchers have been forced to release data in thecourse of government deliberations or because of public healthconcerns. The final three types of unethical behavior, plagiarism,fabrication and falsification, are listed by the US National ScienceFoundation as definitive examples of scientific misconduct. Plagiarismis “the appropriation of another person’s ideas, processes, results, orwords without giving appropriate credit, including those obtainedthrough confidential review of others’ research proposals andmanuscripts” (Federal Office of Science and Technology Policy, 1999).Paraphrasing is allowed, but needs to be performed appropriately:speech marks should be used for direct quotes, otherwise alternativephrases should be used. Fabrication refers to the making up of data orresults and reporting them, while falsification refers to themanipulation of experiments or the modification of obtained resultssuch that the research is not accurately represented in the literature.All types of misconduct have serious consequences ranging fromrejection of a paper to termination of employment and possible legalproceedings. Finally, not disclosing any potential conflicts ofinterest, financial or otherwise, could be considered unethicalbehavior. Authors are usually asked to declare potential conflicts ofinterest when submitting manuscripts. These include any financial orpersonal relationships that might inappropriately influence youractions, for example, your employment situation, consultancies, andstock ownership. Conflicts of interest are not necessarily bad, orobstacles to publication, but it is vital that they are declared. Itis important that scientists, engineers and clinicians are aware ofwhat represents ethical and unethical behaviors so that the latter canbe avoided. Behaving ethically will give you the confidence of yourpeers, colleagues and journal editors; behaving unethically could leadto a loss of grant support, unemployment, a ban from journals andpossible legal proceedings. Thus, be aware of the boundaries. Dr Daniel McGowan 分子神经学博士 理文编辑学术总监
国人崇拜论文数量,以下就是发表论文数量的世界纪录,以供参拜: Most Research Papers Published In One Month - Youssef Bassil Most Research Papers Published In One Year - Youssef Bassil Most Research Papers By A Single Author Published In One Year Who has written the most published academic papers? Academic World Records Writing World Records
吴信东博士(美国佛蒙特大学计算机科学系正教授和系主任, TKDE 等多种国际著名学术杂志的主编和编委) 最重要的九点: 1 、 技术贡献、证据 2 、切忌打击面太广、针对的问题多, 切入点不能超过 2 个 3 、知道你的敌人是谁 4 、选题 5 、实验结果、说服力 6 、 好的前言 7 、 相关工作、引用(该期刊) 8 、 修改文章(详细说明各点) 9 、宽容态度、坚韧不拔 九条信息最重要 1 、 注意你的贡献,说明你的证据 2 、 idea 有两种: ----Your technique solves a problem for the first time 第一次,在某一点上第一次,革命性的,创造性的 ---- 如果不是第一次, Your technique performs better,in one or more of the the following dimensions: 1) Behaviour 效果比他好 2) Coverage 覆盖面广 3) Efficiency 速度快、占用空间少 4 ) Useability:Users find X easier to use than its rivals 使用方便 You should avoid claiming too many dimensions but one or two with in-depth evidence. 技术贡献不能多,要针对性,更深入。做得更加深入,切忌打击面广,别人反驳更多。 论文的架构( typical structure of a research paper ): title:Catchy and indicative of your research contribution Catchy 引入注目 indicative 特殊性 题目越长,被拒的可能性越高:例如:爱因斯坦提出“相对论”,就三个字, 接下来就是“相对论的能量公式”字多了 indicative---- 说文章的大意,不要太抽象。例如:计算理论 --- 太抽象了 abstract:A summary of the research problem,your chaim,and the evidence 以上三部分 introduce: 将 abstract 中的 A summary 的两三句话展开 1 ) motivation 动机 2) significance 意义 3 ) an outline of the rest of the paper Related work: 1) A critical review 评判几大典型算法,各存在什么问题 2 )我们的方法对于第一类问题怎么解决,对于第二类问题怎么解决 (批判别人,显出自己) 主编看摘要、前言就基本判决 Problem statement and algorithm design:Explain your ideas in detail Evaluation:evidence to support the claim of your research contribution---unless you can provide proofs for a theoretical on theorems,experimental results and always expected Conclusion: 画龙点睛、说你发出文章之后,此刻正在做的,接下来要做的,实验中还有哪些值得接着做的。 How to write and publish Research papers for the premier forums 国外期刊没有长度限制,这是和国内的期刊,例如“计算机学报”有区别 what to know and how to write a top-quality paper 前言最重要,能给审稿人留下印象,就是成功的一半了 1 、 A promising topic ( 一个有前途的主题 ) 2 、 A convincing case (让人信服的例证) 3 、 In-depth analysis of empirical results( 经验结果的深度分析(例如,经验值、参数的设定) ) 4 、 the most important part:the introduction( 最重要的部分,前言 ) Scientific Paper 的撰写(这类论文需要有自己的想法,不是综述文章,如 review ) Why write a scientific paper 1 、 Advance knowledge in your research field with evidence 有证据表明,在你研究的领域有了提高 / 前进 2 、 Explain your ideas and make them accessible to others 介绍你的主意,使他人理解 3 、 Two key components in a research paper --An explicit claim on your contribution on a research problem 针对某个研究问题,直接陈述你的贡献 ( 自己做的工作要写出来 ) --Your contribution can possibly be a refutation of a hypothesis on the research problem 针对某个研究问题,你的贡献有可能被通过假设来驳斥。例如:你这么做,会不会造成数据丢失(在数据挖掘领域) 光有想法不行,要证明你的想法正确 What to know before you write 1. 考虑读者是谁:根据所投的期刊 To whom are you writing?why will they be reading your writing? 2.Assess the purpose:What should the reader take away? 让读者带走什么 3.Read other people's writing from the forums that you are targeting 从要投的那个期刊上去找相关文章参考 4.Know your enemy:Check who are on the program committee or editorial board,and cite their relevant work with due credit 找编委的文章来参考,毕竟他们在这领域很牛 5.Follow the rules----length limits,formatting standards,etc 投会议,长度多长,可能自动放入一堆,直到截至时,才告诉你论文过长 choose a promising topic 与外国教授(有名的)交流,看他们的论文,问他们在这方面有什么新的进展,是否有往下做的可能 10 challenging problems -----How to present a convincing case? -----How are your ideas significant (to justify a paper)? -----Some ideas are so simple that have been used many times W/O being published. ----- Is all related work referenced and reviewed? 要与主流的方法进行比较 -----Are the comparative studies with previous work convincing? ----Have your system been implemented and used,and if so what did it demonstrate from the real world. -----Enough details for your experiment setting.(so that other researchers can verify and improve your results) -----What were the alternatives considered at various points of your experiments?Why and how have you made the choices for your experiments? ( 让别人知道你各种实验参数设置都考虑到了 ) consistent and conclusive 一致性和总结性 -----Can you fine-tune some key parameters to get better or worse results?If so,use figures and tables to show their impacts on your system performances 公平比较,要别人最佳的情况进行比较 ------How do the experimental results correspond to the motivation of the paper? ------What have you found surprising and tried to avoid in these experiments?How generally applicable are these lessons? 如果论文是 8 页纸,那么 4 页是做实验的。 ------The 1/3-2/3 Rule from a reviewer's perspective. 如果论文是 8 页纸,那么前言占 1 页 1 ) 1/3 time to read your introduction and make a decision 2)Remaining 2/3 time to find evidence for the decision -----A good introduction with a good motivation is half of your success. what to cover in the introduction ----The research problem ----The movivation of your research on the research problem ----The claim of your contribution -----A summary of your evidence to support your claim -----The significance of your contribution -----An outline of the rest of the paper Most important of all:the uniqueness of you research in the field! 最佳投稿方式: 首先投顶级的会议,若被录用,则对论文进行扩展,在题名上加“ * ”,说明:论文缩写版已经被某国际会议录用,投国际期刊
大多数科研人员和医师都熟悉科研伦理的概念,特别是在以动物和人作为研究对象时。大多数研究开始前也的确需要从所在研究机构的伦理审查委员会处获得批准。此外,就论文发表(包括医学媒体机构的使用)、作者署名、内容转载和数据的有效性也有相关规定。违反科研伦理和论文发表道德规范的行为会造成拒稿甚至被一些期刊禁止投稿。这些行为包括哪些、又该如何避免呢? 下列做法将被视为不符合科研伦理和论文道德规范: • 人和动物研究对象的不当使用 • 署名不端 • 一稿多投 • 重复发表 • 剽窃 • 捏造或篡改数据 多数人可能对第一条最为熟悉。使用人和动物作为试验对象的研究应遵守1975年《赫尔辛基宣言》中规定的伦理标准(世界医学协会2000年于爱丁堡修订),该宣言也促成了伦理委员会的建立。这些规范旨在确保人和动物研究对象的福祉,并规定研究必须要具备受试人提供的知情同意书;即他们已被告知试验的目的和性质,且同意接受此试验。所有使用人和动物为实验对象的研究必须遵守《赫尔辛基宣言》;如果未能遵守,研究者必须解释其所用研究方法的根据并从当地或研究机构的伦理审查机构获得批准。 署名不端问题出版社很想消灭,但现在仍常可见到。国际医学期刊编辑委员会 已经就署名资格制订了指南。根据ICMJE指南,署名资格必须基于:①对研究的构思/设计或数据的获取/分析/解释具有实质性贡献;②参与撰写论文,或对重要知识部分进行关键性修改;③同意终稿发表。这三条必须全部满足才能具备署名资格。相对次要的贡献者可在“致谢”部分列出。应当注意的是,一些期刊有自己的署名规定,通常含在《稿约》中。 “一稿多投”是指同时将同一个稿件投到多家期刊。这也许能为你节省些时间,但是一旦被发现你的论文就会被拒稿,并且有可能被禁止向这些期刊投稿。这种险完全不值得去冒。期刊编辑之间会定期会谈,并就可疑稿件进行互相交流。另外,不同的期刊也可能把你的稿件送交同一名审稿人审读,这样你的多投行为就会被发现。所以,在收到一个期刊的最终决定之前不应投到下一个期刊。 “重复发表”是指论文中包含之前已发表过的结果。期刊编辑要求论文具有原创性内容,并已于1969年形成政策:“仅考虑发表满足以下条件的稿件:其实质性内容没有在他处发表过,也没有同时投稿到其他地方”。这被称为Ingelfinger规则,以《新英格兰医学》当时的编辑Franz Ingelfinger命名。该规则旨在避免期刊发表之前已发表过从而已失去原创性的材料。ICMJE指南(III.D.2重复发表)重申了该规则,申明“期刊编辑不愿收到此类稿件:其内容大部分已发表过,或包含在另一已投出或已录用的论文中”。这个规定有一些值得注意的例外,其中包括学术会议演讲稿及其摘要(尽管是例外,在投稿时还是需要公开说明此情况),以及研究者由于政府的考虑或公共健康的关系而必须发布的数据。 最后三种学术不端行为是:剽窃、捏造和篡改数据。美国国家科学基金把它们列为学术不端的鉴戒。剽窃是指“擅用他人的思想、方法、结果、或语言而未申明出处。这包括通过秘密审读他人论文或经费申请书所获取的信息”(出自Federal Office of Science and Technology Policy, 1999)。转述是允许的,但其方式要恰当。如果要进行直接转述就要用引号表明,不然就需要变换说法。捏造是指无中生有地制造并报道数据,篡改则是指对试验进行操纵,或更改已获得的数据,导致所报道文献不能准确反映真实的研究状况。所有学术不端都有严重后果,从拒稿到解雇,以及可能的法律诉讼。 最后,不披露潜在的经济或其他利益冲突也可能被视作不端行为。作者投稿时通常会被要求申明有无利益冲突,其中包括是否有能影响你行为的经济或个人关系,例如你的工作情况、顾问身份和持股情况。利益冲突并不一定是坏事或论文发表的障碍,但应予申明。 科研人员、工程师和医师要知道那些是合乎伦理的行为,哪些是不端行为,这样他们才能避免后者。行为符合伦理能让同行、同事和期刊编辑对你有信心;而行为不端则可导致失去资助、解雇、禁止投稿、甚至法律诉讼。所以,务必要知道界限在那里。 Ethics: following good practice Most scientists and clinicians are familiar with the concept of ethics as it relates to research, particularly research involving human and animal subjects. Indeed, most studies require ethical approval of the protocols from an institutional committee (following internationally established guidelines) before the research can commence. Additional guidelines relate to publications practice (including the use of medical communications agencies), authorship, reproduction of content, and the validity of the data being presented. Unethical behavior can lead to rejection or even a ban from some journals. But what comprises unethical behavior and how can it be avoided? The following practices are considered to be unethical: • Improper use of human subjects and animals in research • Improper authorship • Making multiple submissions of the same manuscript • Submitting a redundant publication • Plagiarism • Data fabrication and falsification The first of these is probably the one that most people are familiar with. Experiments on human subjects and animals should follow the ethical standards set out in the Helsinki Declaration of 1975 (revised by the World Medical Organisation in Edinburgh in 2000), which led to the establishment of ethics committees. These guidelines ensure the welfare of the animals or human subjects involved in research and require that human subjects provide informed consent for the experiments; that is, they are informed of the purpose and nature of the experiments and consent to being subject to them. All research using human and animal subjects must comply with the Helsinki Declaration or, if not, the researchers must explain the rationale underlying their approach and obtain approval from a local or institutional ethical review body. Improper authorship is unfortunately a frequently occurring practice that publishers are keen to put an end to. The International Committee of Medical Journal Editors (ICMJE; http://www.icmje.org) have established guidelines for qualification for authorship. According to the ICMJE, authorship credit should be based on: 1) substantial contributions to conception and design, or acquisition of data, or analysis and interpretation of data; 2) drafting the article or revising it critically for important intellectual content; and 3) final approval of the version to be published. All three of these criteria need to be satisfied for a person to qualify for authorship. Lesser contributions should usually be noted in the acknowledgments section of the manuscript. It should be noted that some journals have their own criteria for authorship; these are usually set out in the Guide for Authors. “Multiple submissions” refers to the practice of submitting the same manuscript to more than one journal, simultaneously. Although this might save some of your time, if identified, it will result in your paper being rejected and a possible ban from publishing in the journals in question. It simply isn’t worth the risk. Journal editors regularly talk to each other and will exchange information about suspicious papers. It is also quite likely that different journals will appoint the same peer reviewers, leading to discovery of any additional submissions. Therefore, you should not submit your manuscript to a second journal until you receive a final decision from the first journal. Redundant publications are publications containing findings that have already been published. Journal editors want original content, and this was put into policy in 1969 in the form of the Ingelfinger rule, “the policy of considering a manuscript for publication only if its substance has not been submitted or reported elsewhere”, named after Franz Ingelfinger, the editor of the New England Journal of Medicine at that time. The aim of this rule was to protect the journal from publishing material that had already been published and had therefore lost its originality. The rule is reiterated in the ICMJE Guidelines (III.D.2 Redundant Publication), which states that journal editors “do not wish to receive papers on work that has already been reported in large part in a published article or is contained in another paper that has been submitted or accepted for publication elsewhere”. Notable exceptions to this include presentations at scientific meetings and published abstracts (although full disclosure of these should be made at the time of submission) and situations in which researchers have been forced to release data in the course of government deliberations or because of public health concerns. The final three types of unethical behavior, plagiarism, fabrication and falsification, are listed by the US National Science Foundation as definitive examples of scientific misconduct. Plagiarism is “the appropriation of another person’s ideas, processes, results, or words without giving appropriate credit, including those obtained through confidential review of others’ research proposals and manuscripts” (Federal Office of Science and Technology Policy, 1999). Paraphrasing is allowed, but needs to be performed appropriately: speech marks should be used for direct quotes, otherwise alternative phrases should be used. Fabrication refers to the making up of data or results and reporting them, while falsification refers to the manipulation of experiments or the modification of obtained results such that the research is not accurately represented in the literature. All types of misconduct have serious consequences ranging from rejection of a paper to termination of employment and possible legal proceedings. Finally, not disclosing any potential conflicts of interest, financial or otherwise, could be considered unethical behavior. Authors are usually asked to declare potential conflicts of interest when submitting manuscripts. These include any financial or personal relationships that might inappropriately influence your actions, for example, your employment situation, consultancies, and stock ownership. Conflicts of interest are not necessarily bad, or obstacles to publication, but it is vital that they are declared. It is important that scientists, engineers and clinicians are aware of what represents ethical and unethical behaviors so that the latter can be avoided. Behaving ethically will give you the confidence of your peers, colleagues and journal editors; behaving unethically could lead to a loss of grant support, unemployment, a ban from journals and possible legal proceedings. Thus, be aware of the boundaries. Dr Daniel McGowan 分子神经学博士 理文编辑学术总监
大多数科研人员和医师都熟悉科研伦理的概念,特别是在以动物和人作为研究对象时。大多数研究开始前也的确需要从所在研究机构的伦理审查委员会处获得批准。此外,就论文发表(包括医学媒体机构的使用)、作者署名、内容转载和数据的有效性也有相关规定。违反科研伦理和论文发表道德规范的行为会造成拒稿甚至被一些期刊禁止投稿。这些行为包括哪些、又该如何避免呢? 下列做法将被视为不符合科研伦理和论文道德规范: • 人和动物研究对象的不当使用 • 署名不端 • 一稿多投 • 重复发表 • 剽窃 • 捏造或篡改数据 多数人可能对第一条最为熟悉。使用人和动物作为试验对象的研究应遵守1975年《赫尔辛基宣言》中规定的伦理标准(世界医学协会2000年于爱丁堡修订),该宣言也促成了伦理委员会的建立。这些规范旨在确保人和动物研究对象的福祉,并规定研究必须要具备受试人提供的知情同意书;即他们已被告知试验的目的和性质,且同意接受此试验。所有使用人和动物为实验对象的研究必须遵守《赫尔辛基宣言》;如果未能遵守,研究者必须解释其所用研究方法的根据并从当地或研究机构的伦理审查机构获得批准。 署名不端问题出版社很想消灭,但现在仍常可见到。国际医学期刊编辑委员会 已经就署名资格制订了指南。根据ICMJE指南,署名资格必须基于:①对研究的构思/设计或数据的获取/分析/解释具有实质性贡献;②参与撰写论文,或对重要知识部分进行关键性修改;③同意终稿发表。这三条必须全部满足才能具备署名资格。相对次要的贡献者可在“致谢”部分列出。应当注意的是,一些期刊有自己的署名规定,通常含在《稿约》中。 “一稿多投”是指同时将同一个稿件投到多家期刊。这也许能为你节省些时间,但是一旦被发现你的论文就会被拒稿,并且有可能被禁止向这些期刊投稿。这种险完全不值得去冒。期刊编辑之间会定期会谈,并就可疑稿件进行互相交流。另外,不同的期刊也可能把你的稿件送交同一名审稿人审读,这样你的多投行为就会被发现。所以,在收到一个期刊的最终决定之前不应投到下一个期刊。 “重复发表”是指论文中包含之前已发表过的结果。期刊编辑要求论文具有原创性内容,并已于1969年形成政策:“仅考虑发表满足以下条件的稿件:其实质性内容没有在他处发表过,也没有同时投稿到其他地方”。这被称为Ingelfinger规则,以《新英格兰医学》当时的编辑Franz Ingelfinger命名。该规则旨在避免期刊发表之前已发表过从而已失去原创性的材料。ICMJE指南(III.D.2重复发表)重申了该规则,申明“期刊编辑不愿收到此类稿件:其内容大部分已发表过,或包含在另一已投出或已录用的论文中”。这个规定有一些值得注意的例外,其中包括学术会议演讲稿及其摘要(尽管是例外,在投稿时还是需要公开说明此情况),以及研究者由于政府的考虑或公共健康的关系而必须发布的数据。 最后三种学术不端行为是:剽窃、捏造和篡改数据。美国国家科学基金把它们列为学术不端的鉴戒。剽窃是指“擅用他人的思想、方法、结果、或语言而未申明出处。这包括通过秘密审读他人论文或经费申请书所获取的信息”(出自Federal Office of Science and Technology Policy, 1999)。转述是允许的,但其方式要恰当。如果要进行直接转述就要用引号表明,不然就需要变换说法。捏造是指无中生有地制造并报道数据,篡改则是指对试验进行操纵,或更改已获得的数据,导致所报道文献不能准确反映真实的研究状况。所有学术不端都有严重后果,从拒稿到解雇,以及可能的法律诉讼。 最后,不披露潜在的经济或其他利益冲突也可能被视作不端行为。作者投稿时通常会被要求申明有无利益冲突,其中包括是否有能影响你行为的经济或个人关系,例如你的工作情况、顾问身份和持股情况。利益冲突并不一定是坏事或论文发表的障碍,但应予申明。 科研人员、工程师和医师要知道那些是合乎伦理的行为,哪些是不端行为,这样他们才能避免后者。行为符合伦理能让同行、同事和期刊编辑对你有信心;而行为不端则可导致失去资助、解雇、禁止投稿、甚至法律诉讼。所以,务必要知道界限在那里。 英文译文 Ethics: following good practice Most scientists and clinicians are familiar with the concept of ethics as it relates to research, particularly research involving human and animal subjects. Indeed, most studies require ethical approval of the protocols from an institutional committee (following internationally established guidelines) before the research can commence. Additional guidelines relate to publications practice (including the use of medical communications agencies), authorship, reproduction of content, and the validity of the data being presented. Unethical behavior can lead to rejection or even a ban from some journals. But what comprises unethical behavior and how can it be avoided? The following practices are considered to be unethical: • Improper use of human subjects and animals in research • Improper authorship • Making multiple submissions of the same manuscript • Submitting a redundant publication • Plagiarism • Data fabrication and falsification The first of these is probably the one that most people are familiar with. Experiments on human subjects and animals should follow the ethical standards set out in the Helsinki Declaration of 1975 (revised by the World Medical Organisation in Edinburgh in 2000), which led to the establishment of ethics committees. These guidelines ensure the welfare of the animals or human subjects involved in research and require that human subjects provide informed consent for the experiments; that is, they are informed of the purpose and nature of the experiments and consent to being subject to them. All research using human and animal subjects must comply with the Helsinki Declaration or, if not, the researchers must explain the rationale underlying their approach and obtain approval from a local or institutional ethical review body. Improper authorship is unfortunately a frequently occurring practice that publishers are keen to put an end to. The International Committee of Medical Journal Editors (ICMJE; http://www.icmje.org) have established guidelines for qualification for authorship. According to the ICMJE, authorship credit should be based on: 1) substantial contributions to conception and design, or acquisition of data, or analysis and interpretation of data; 2) drafting the article or revising it critically for important intellectual content; and 3) final approval of the version to be published. All three of these criteria need to be satisfied for a person to qualify for authorship. Lesser contributions should usually be noted in the acknowledgments section of the manuscript. It should be noted that some journals have their own criteria for authorship; these are usually set out in the Guide for Authors. “Multiple submissions” refers to the practice of submitting the same manuscript to more than one journal, simultaneously. Although this might save some of your time, if identified, it will result in your paper being rejected and a possible ban from publishing in the journals in question. It simply isn’t worth the risk. Journal editors regularly talk to each other and will exchange information about suspicious papers. It is also quite likely that different journals will appoint the same peer reviewers, leading to discovery of any additional submissions. Therefore, you should not submit your manuscript to a second journal until you receive a final decision from the first journal. Redundant publications are publications containing findings that have already been published. Journal editors want original content, and this was put into policy in 1969 in the form of the Ingelfinger rule, “the policy of considering a manuscript for publication only if its substance has not been submitted or reported elsewhere”, named after Franz Ingelfinger, the editor of the New England Journal of Medicine at that time. The aim of this rule was to protect the journal from publishing material that had already been published and had therefore lost its originality. The rule is reiterated in the ICMJE Guidelines (III.D.2 Redundant Publication), which states that journal editors “do not wish to receive papers on work that has already been reported in large part in a published article or is contained in another paper that has been submitted or accepted for publication elsewhere”. Notable exceptions to this include presentations at scientific meetings and published abstracts (although full disclosure of these should be made at the time of submission) and situations in which researchers have been forced to release data in the course of government deliberations or because of public health concerns. The final three types of unethical behavior, plagiarism, fabrication and falsification, are listed by the US National Science Foundation as definitive examples of scientific misconduct. Plagiarism is “the appropriation of another person’s ideas, processes, results, or words without giving appropriate credit, including those obtained through confidential review of others’ research proposals and manuscripts” (Federal Office of Science and Technology Policy, 1999). Paraphrasing is allowed, but needs to be performed appropriately: speech marks should be used for direct quotes, otherwise alternative phrases should be used. Fabrication refers to the making up of data or results and reporting them, while falsification refers to the manipulation of experiments or the modification of obtained results such that the research is not accurately represented in the literature. All types of misconduct have serious consequences ranging from rejection of a paper to termination of employment and possible legal proceedings. Finally, not disclosing any potential conflicts of interest, financial or otherwise, could be considered unethical behavior. Authors are usually asked to declare potential conflicts of interest when submitting manuscripts. These include any financial or personal relationships that might inappropriately influence your actions, for example, your employment situation, consultancies, and stock ownership. Conflicts of interest are not necessarily bad, or obstacles to publication, but it is vital that they are declared. It is important that scientists, engineers and clinicians are aware of what represents ethical and unethical behaviors so that the latter can be avoided. Behaving ethically will give you the confidence of your peers, colleagues and journal editors; behaving unethically could lead to a loss of grant support, unemployment, a ban from journals and possible legal proceedings. Thus, be aware of the boundaries. Dr Daniel McGowan 分子神经学博士 理文编辑学术总监
如今已没有几个行业可以完全不涉及统计学思维的,绝大多数学科都多少需要使用统计学….. 统计学已经从我们日常思维的一个方面发展为无处不在的系统性研究工具….统计学思维承认: 我们对世界的观察总存在某些不确定性,永不可能完全准确。 Rowntree D (1981). Statistics without tears. A primer for non-mathematicians. Penguin Books Ltd., London, England. 统计是指收集、处理和解释数据的方法。由于统计方法是科学探索的固有内容,因此我们的博客已经在研究设计、方法、结果、图表等数处提及统计。但考虑到统计在多数科学研究中的重要性,有必要专门讲解其使用和表达。 在开始研究之前,在初步的研究设计中就应该考虑统计。首先,要考虑你需要收集哪些信息来检验你的假设或解答你的研究问题。研究有个正确的开始非常重要;虽然数据检验错误相对容易弥补,要用另外的样本组重新收集数据或者从同一样本中追加获取变量可就费时费力得多。如果你想检验某种疗法对普通人群的效果,你的样本要能够代表这个群体。如果比较的是分别有两种疾病或行为的两个群体,那这两个群体的其他变量如年龄、性别、种族需要尽可能一致。这些涉及的都是数据收集;如果在这一步就犯了错,你就有可能遇到严重的问题,甚至可能会在数个月后在同行审稿阶段遭到严重质疑而推翻重来。 其次,你要考虑要采用何种统计检验才能从数据中提炼出有意义的结论。这取决于数据类型。是用来表达某种标志物存在与否的分类数据吗?还是有具体数值的定量数据?如果是定量数据,是连续数据(测量所得)还是离散数据(计数所得)?例如,年龄、体重、时间和温度都是连续数据因为他们的值是在连续,无限可分的尺度上测量出来的;相反,人和细胞的数目都是离散数据,他们不是无限可分的,他们的值是通过计数得到的。你也需要知道你数据的分布:是正态(高斯)分布还是偏态分布?这也关系到你该采取何种检验。你一定要知道你收集的是何种类型的数据,这样才能用适宜的统计检验来分析和恰当的方式来表示。下面这个网址提供了选择适宜检验方法的指南,可能会有所帮助:http://www.graphpad.com/www/Book/Choose.htm 最后,需要知道如何解读统计检验的结果。P值(或 t、 χ2 等)代表什么意思?这是统计检验的关键:确定结果到底意味着什么,你能下什么结论?统计能告诉我们某一数据集的集中趋势(如平均值和中位数)和离散趋势(标准差、标准误和百分位间距),从而明确该数据集的分布情况。统计学可以比较(如用t检验、方差分析和χ2检验)两个或多个样本组之间是否有非偶然的系统性差别。如果检验表明无效假设可能性很小,则差别具有显著性。一定要记住,用概率简化差别的“真实性”造成了两种风险,两种都取决于所选取显著性的阈值。第一个是第1类错误,是指本没有显著性差异之处检出了显著性差异。另一个是第2类错误,是指本有显著性差异但由于差别不够大而不能捡出。降低第1类错误的风险就会增加第2类错误的风险;不过这也比下不存在的结论要好。统计学也能给出关联的强度,从而允许从样本组中推断出适用于更广群体的结论。统计学赋予了本身价值有限的结果更多意义,并允许我们用概率下结论,虽然总是存在错误的可能。 实例 节选自《The Journal of Clinical Investigation》 (doi:10.1172/JCI38289; 经同意转载)。 清单 1. 在列举数据时,说明使用的是何种参数,如“均值±标准差”。 2. 说明数据分析所采用的统计检验方法。 3. 百分比给出分子分母,如“40% (100/250)”。 4. 正态分布数据用均值和标准差表示。 5. 非正态分布数据用中位数和 百分位数表示。 6. 给出具体的P 值, 如 写出 “P=0.0035”,而不要只写 “P0.05”。 7. “significant’ 这个词仅用于描述统计学上的显著差异。 英文原文 Statistics: what can we say about our findings? Today, few professional activities are untouched by statistical thinking, and most academic disciplines use it to a greater or lesser degree… Statistics has developed out of an aspect of our everyday thinking to be a ubiquitous tool of systematic research… Statistical thinking is a way of recognizing that our observations of the world can never be totally accurate; they are always somewhat uncertain. Rowntree D (1981). Statistics without tears. A primer for non-mathematicians. Penguin Books Ltd., London, England. The term ‘statistics’ refers to the methods used to collect, process and interpret data. Because these methods are so inherent in the process of scientific inquiry, there have been multiple references to statistics throughout our blog, namely, in the posts on study design, methods, results and display items. However, given the importance of statistics in most scientific studies, it is worthwhile having a separate post on how they should be used and presented. Statistics should first be considered long before the commencement of any research, during the initial study design. First, consider what information you need to collect in order to test your hypothesis or address your research question. It is important to get this right from the outset because, while data can be reanalyzed relatively easily if the wrong tests were used, it is far more difficult and time-consuming to repeat data collection with a different sample group or obtain additional variables from the same sample. If you wish to test the efficacy of a treatment for use in the general population, then your sample needs to be representative of the general population. If you wish to test its efficacy in a given ethnicity or age group, then your sample needs to be representative of that group. If comparing two groups of subjects separated on the basis of a particular disease or behavior, then other variables, such as age, sex and ethnicity, need to be matched as closely as possible between the two groups. This aspect of statistics relates to the collection of data; get it wrong and you could face major problems, potentially the need to start the research all over again, at the peer review stage many months later. Second, you need to consider what statistical tests should be applied so that you can make meaningful statements about your data. This depends on the type of data you have collected: do you have categorical data, perhaps describing the presence or absence of a particular marker, or quantitative data with numerical values? If your data is quantitative, is it continuous (that is, can it be measured) or discrete (counts)? For example, age, weight, time and temperature are all examples of continuous data because they are measured on continuous scales with units that are infinitely sub-divisible. By contrast, the number of people in a given group and the number of cells with apoptotic features are examples of discrete data that need to be counted and are not sub-divisible. You also need to know how your data is distributed: is it normally distributed (Gaussian) or skewed? This also affects the type of test that should be used. It is important that you know what type of data you are collecting so that you apply the appropriate statistical tests to analyze the data and so you present them in an appropriate manner. The following useful website provides a guide to choosing the appropriate statistical test: http://www.graphpad.com/www/Book/Choose.htm Finally, you need to know how to interpret the results of the statistical tests you have selected. What exactly does the p (or t or χ2 or other) value mean? That, after all is the point of statistical analysis: to determine what you can say about your findings; what they really mean. Statistics enable us to determine the central tendency (for example, mean and median) and dispersion (for example, standard deviation, standard error, and interpercentile range) of a dataset, giving us an idea of its distribution. Also using statistics, values from two or more different sample groups can be compared (for example, by t-test, analysis of variance, or χ2 test) to determine if a difference between or among groups could have arisen by chance. If this hypothesis, known as the null hypothesis, can be shown to be highly unlikely (usually less than 5% chance), then the difference is said to be significant. It is important to keep in mind that there are two risks associated with reducing a decision about the ‘reality’ of a difference to probabilities, and both depend on the threshold set to determine significance: the first, known as type I error, is the possibility that a difference is accepted as significant when it is not; the opposite risk, known as type II error, refers to the possibility that a significant difference is considered not to be significant because we demand a larger difference between groups to be certain. Reducing the risk of type I errors increases the risk of type II errors, but this is infinitely more preferable than reaching a conclusion that isn’t justified. Statistics also provides a measure of the strengths of correlations and enables inferences about a much larger population to be drawn on the basis of findings in a sample group. In this way, statistics puts meaning into findings that would otherwise be of limited value, and allows us to draw conclusions based on probabilities, even when the possibility of error remains. Example Extracts from The Journal of Clinical Investigation (doi:10.1172/JCI38289; reproduced with permission). Checklist 1. Indicate what parameters are described when listing data; for example, “means±S.D.” 2. Indicate the statistical tests used to analyze data 3. Give the numerator and denominator with percentages; for example “40% (100/250)” 4. Use means and standard deviations to report normally distributed data 5. Use medians and interpercentile ranges to report data with a skewed distribution 6. Report p values; for example, use “p=0.0035” rather than “p0.05” 7. Only use the word “significant’ when describing statistically significant differences. Dr Daniel McGowan 分子神经学博士 理文编辑学术总监
一大早收到Springer的E-mail,我的论文已经在网上发表了(纸质版随后),尽管是4人合作,但作为通讯作者,我还是付出了许多,近万元的部分实验费用,论文英文稿、图表,的完善,还有对评阅人意见的回复和论文修改,直到最后的校对,差不多历时一年半,真是不容易。增加了一篇SCI论文,至此,在Metallurgical and Materials Transaction B 上以第一作者发表了两篇(博士论文的内容),如今在Metallurgical and Materials Transaction A 上又出了一篇。希望同事们和同学们跟我一起继续努力! 以下是邮件的部分内容和关于论文的情况: Congratulations Dear Springer Author, Congratulations, your article Nanoscale Cementite Precipitates and Comprehensive Strengthening Mechanism of Steel has just been published and is now as 'Online First' on SpringerLink http://www.springerlink.com/openurl.asp?genre=articleid=doi:10.1007/s11661-011-0767-z It is fully accessible to libraries, institutions and their patrons that have purchased a SpringerLink license. If your article is published under one of our Open Access programs it will be freely accessible to any user. Citation Information Being an 'Online First' article, your paper is now available and is fully citable even before the journal's full issue has been compiled! Your article can be cited by its unique Digital Object Identifier (DOI) 10.1007/s11661-011-0767-z in the following form: Author, Journal Title, Year, DOI After inclusion of your article in the paginated issue, please continue to use the DOI alongside the usual citation details in order to enable readers to easily find the article in print and online. _____________________________________________________________________ About This Article Title Nanoscale Cementite Precipitates and Comprehensive Strengthening Mechanism of Steel Authors Jie Fu (12) Guangqiang Li (2) ligq-wust@wust.edu.cn Xinping Mao (3) Keming Fang (12) Author Affiliations School of Metallurgical and Ecological Engineering, University of Science and Technology Beijing, Beijing, 100083 P.R. China Key Laboratory for Ferrous Metallurgy and Resources Utilization of Ministry of Education, China, Wuhan University of Science and Technology, Wuhan, 430081 P.R. China Guangzhou Zhujiang Steel Co., Ltd, Guangzhou, 510730 P.R. China DOI 10.1007/s11661-011-0767-z SpringerLink Date Monday, August 08, 2011 About This Journal Title Metallurgical and Materials Transactions A Coverage Volume 6 / 1975 - Volume 42 / 2011 Collection Chemistry and Materials Science Subjects Chemistry Materials Science Metallic Materials Structural Materials Physical Chemistry Ceramics,Glass,Composites,Natural Materials ISSN 1073-5623 (Print) 1543-1940 (Online) Additional Links Register for TOC Alerting Editorial Board Submissions About This Journal Publisher Springer Boston SpringerLink Date Wednesday, January 10, 2007
前些天,我们课题组的一篇研究论文被Macromolecular Bioscience接受发表,祝贺一下,希望再接再厉哈! Shi MR, Liu YY*, Xu MM, Yang H, Wu CH, Miyoshi H. (2011) Core-shell Fe3O4@SiO2 nanoparticles modified with PAH as a vector for EGFP plasmid DNA delivery into HeLa cells. Macromolecular Biosciences. (in press)
Why publish in English? During a session of talks I participated in, a Chinese student asked, Why do the journals require us to publish in English? Why cant we simply publish in Chinese? The student was making the point that in addition to having to learn difficult physics and perform top quality research he would have to master a foreign language in order to fulfill the requirements of graduation. It does seem to be a fair question to ask: Why cant researchers just publish in their native language to move forward in their careers? It is important to remember that the primary reason to publish is not to advance ones career. It is to share your results with the broader community. In fact, there is only one reason publishing is linked to career advancement. It is a system for ensuring that those who contribute knowledge to the community continue to have the resources to do so. Therefore, it is best to publish in a languagethat can be of use to the most scientists. Is English the best language to fill this role? It is useful to ask: What other language candidates are there? The three most common native languages are, in order, Chinese, Spanish, and English. One might conclude that Chinese and Spanish are then better candidates. Ironically, native Chinese and Spanish speakers would vehemently disagree. Native Chinese speakers would object to having to learn Spanish, because they are much more likely to have already studied English. The reverse is true of native Spanish speakers. When all spoken foreign languages are taken into account, English is by far the most common language with an estimated 1.8 billion speakers. The disparity is even larger in highly-educated populations, because English is the lingua franca, or common language for business, technology, and science. In addition, most periodicals with the reviewer infrastructure necessary to handle widespread international submissions are English language publications. However, it is clear that this is a large barrier to publication for any research groups without native English speakers. In fact, this barrier is likely to have a collective negative effect on the publication rate of universities where English is not the primary language of instruction. At these institutions, it would be in the interest of the reputation of the university to make sure their researchers receive training and good access to language service support. These are both issues that Liwen Bianji wants to work with the Chinese scientific community to address, such as through our training workshops( http://liwenbianji.cn/node/4078 ) and by offering discounts to institutions or labs that use us regularly. G. Schiltz, World-Wide English, http://www.ehistling-pub.meotod.de/01_lec06.php#11 (2004) All the best, Daniel Broaddus Senior Editor and Trainer, Liwen Bianji www.liwenbianji.cn 中文摘要 为什么要以英文发表论文? 在我之前参加的某个会议上,一位中国在校生曾问过这样的问题:为什么一流的国际期刊要求用英文发表论文?为什么不能用中文发表?实际上他想表达的观点是,除了要学习复杂的物理知识、从事高难度的研究工作,他还要掌握一门外语以应付毕业。因此,有这样的疑问看似也无可厚非:为什么科研人员不能用自己的母语来发表文章? 首先需要明确一个态度,发表论文的首要目的并不是为了职业的发展,而是为了与更多的同行分享研究成果。 论文语言最好为大多数科学家所共用,虽说从全球范围上来讲以中文和西班牙语为母语的人数比英语母语者更为普遍,但较之学习西班牙语或中文,相信更多的人会选择英文,更何况英语是最常用的外语。 毋庸置疑,语言仍是影响论文发表的一大障碍,特别是对于非英语教学的大学院校;如果学校可以出面解决科研人员语言培训的资金问题,这对于提高论文发表量亦或是学校知名度都是大有裨益的。
今天终于收到了RSE的邮件,哈哈,第一次,接收了,第一时间,和大家一起分享。虽然发生了一件不好的事情,但是人总是要长大的,也许我会更成熟吧。 Ref.: RSE-D-10-00157R2 Comparison of multiple models for estimating gross primary production using MODIS and eddy covariance data in Harvard Forest Dear Dr Chaoyang, I am pleased to report to you that your paper, Comparison of multiple models for estimating gross primary production using MODIS and eddy covariance data in Harvard Forest, has been accepted for publication in Remote Sensing of Environment. Thank you for making the necessary revisions. When the paper is received and logged in at Elsevier, they will send you an email message telling you how to check on the status of the paper via the Internet, along with information on handling the proofs of your paper, ordering reprints and the copyright agreement. We appreciate your contribution to RSE and look forward to receiving other papers from you in the future. Sincerely, Marvin Bauer Editor-in-Chief Remote Sensing of Environment
作者:黄合来 该文以学术声誉是学者的学术生命线为题刊载于《学习时报》2010.05.17科学技术版 http://www.studytimes.com.cn:9999/epaper/xxsb/html/2010/06/28/07/07_40.htm 【核心提示】科研是个高危行业,学者的声誉一毁不返。发表论文是个建立声誉的方式,更是一个毁坏甚至毁灭声誉的简单途径。本文从学术道德、学术素养、学术贡献三个层面小议学者声誉的建立。以自勉!以共勉! 学者的声誉是反映科研水平的一个重要指标,然而这个指标却不系统,有时候甚至不科学,学者不能在学术道路上犯错误,尤其是低级错误。跟商人不同,商人失败可以重来,学者的声誉一毁不返,跟矿工相似,科研也是个高危行业。维基百科对声誉的定义是: Reputation is the OPINION of the group of entities toward a person, a group of people, or an organization on a certain criterion. 注意这里用的是opinion, 不是systematic, 不是scientific,当然更不是科研团体官位,不是发表文章数量,不是科学检索,不是IF高低。 毫不夸张, 学术声誉是学者的学术生命线 。那么我们应该如何认识学术声誉呢?我认为,学者声誉的获得可以从三个层面来剖析: (1 )学术道德底线:原创、真实、遵守版权 学术道德有三个底线:原创、真实、遵守版权。现在谈的最多的所谓学术不端基本包括侵犯这三个底线的四类行为:抄袭、数据造假、一稿多投、购买论文。原创性和真实性是科研行为的两大传统基本准则,抄袭和数据造假行为历来为学术界所不齿。而基于论文数量的单一评价机制又催生了一稿多投的行为。最后是购买论文,一般比较低端,真正学术圈的人不大可能通过购买论文的方式去建立自己的学术声誉,购买论文的问题基本是发生在学术圈以外,由于行行看论文的机制直接导致的,这可能是中国特色。 科研是个探索性的活动,学者是个高素质的团体,能否遵守学术道德底线,在一定程度上来讲只能通过自律。 科研成果的取得尤其是通过论文发表的方式是不太可能在短期内用某种固定的机制去监督和评价。最近出现的一种学术不端文献检测系统,无论其功能多么先进,相信也只能守住学术不端行为的部分底线,比如抄袭、一稿多投,甚至对于高级抄袭方式,比如多源抄袭都无能为力。 一个科研工作者只有严格遵守这三个学术道德底线才能被真正称为学者,因此学术道德教育应该成为进入学术圈的第一课。一个学者要建立自己的声誉当然远远不止遵守这些底线,然而这三个底线却是学者毁坏甚至毁灭自己学术声誉的最简单途径,也是最不能容忍的行为。这几年出现的院士造假、长江学者造假、校长造假不都是很好的例证么? (2 )学术素养:对科学的敬畏程度 通往学术的道理只有一条,第一站是学术道德,第二站就是学术素养。我认为,学术素养可以简单的定义为对科学的敬畏程度。科学是什么? Science is COMPREHENSIVE information on any subject especially for the physical universe (wiki). 那么科学研究活动又是什么呢?Research can be defined as the search for knowledge or any systematic investigation to establish facts (wiki). 多么高尚的活动,多么值得敬畏的工作! 那实际上又怎么样呢?科研活动有没有获得首先来自学者的最基本的敬畏呢?每天论文出版浩如烟海,又有多大部分真正能对认识世界、改造世界起到指导或推动作用呢? 我们数论文过日子的尴尬局面何时是个尽头 ?笔者是工科实践型的专业出身,从事科研工作和高水平杂志审稿也有几个年头了,虽然坦白讲,在科研上,自己认为现在仍然是个paper producer的层面,但一直对本行业的科研行为有一个思考,那就是到底做出什么样的东西才应该去投稿?科研杂志上面到底应该出现什么样的论文?这个问题有时候在面对一篇评审论文要做拒绝/接收决策的时候尤为纠结。可能有的人会简单回答:创新性,可是怎么定义创新性呢,除了创新性之外还应该有什么呢?多少的标榜着所谓创新完全是为了创新而创新,而不是为了实践而创新!而更有多少一个研究成果拆成若干篇文章去发表,一个东西用在a上发一篇,用在b上发一篇,用在c上发一篇,而实质上对a,b,c的应用完全没有区分度层面上的科学和实践意义。 这就是我要谈的学术素养,一个反映对科学敬畏程度的东西,而实质上这个东西没有固定定义,也没有固定标准,却能实实在在折射在一个学者的声誉上面。现在学术界通用的同行评议制度是一个只能过滤低水平论文,不能甄别高水平论文的机制。因此我常常跟学生说,发表论文代表什么?是获得了重大研究成果么?是获奖么?SCI论文就是获奖么?不是! 论文被接收就好比开大会给了你一个发言机会 ,讲的好不好要看听众对你论文的反响,从声誉上来讲,讲不好还不如不讲。当然高水平杂志基本能保证你的论文在60分以上,而至于最终成绩,仍然只能是你自己来控制,有的61分,有的99分,差别很大,而这就是你的研究水平。而且,同行只通过阅读你的论文来评价你的声誉,更关键的是,所谓坏事传千里,好事不出门,前面定义了reputation 是一个opinion, opinion往往不具备系统性和科学性,一颗老鼠屎能坏一锅汤,这也是本文取名科研是个高危行业的一个原因,往往人们只记得你那1次大会发言的糟糕,而忘记了你其余99次的精彩。 循着这个逻辑就能得出一个结论: 发表论文和声誉显著相关,正负相关皆有可能 。因此,对建立声誉而言,论文贵精不贵多,宁缺毋滥! (3 )学术贡献:对科学和实践的推动 声誉的最后一个层面当然也是通往学术大师的最后一个关卡,伟大的声誉来自伟大的对科学或实践的推动贡献。 没有人会去数一个诺贝尔奖获得者发表过多少SCI文章,发表过几篇science和nature,也没有人去统计他/她获得过多少科研项目和经费。 而实事上大多数学者都在科研的道理上成为了垫脚石,成为了牛顿所说的那个巨人肩膀的一份子。伟大的科研成就貌似有点可望而不可及,但要知道,成为了支撑牛顿的肩膀的一部分也是何其令人鼓舞,重大的成果虽然往往以一两个作者来标榜,而实际上任何科学和技术的重大进步都离不开广大的科研同行多年的尝试和努力。另外要强调的是,伟大声誉的建立,非凡学术贡献的取得,离不开前面两个环节:学术道德和学术素养。对于年轻的学者尤为重要,严守学术道德,培养学术素养是通往重大学术贡献的必经之路。 结语 :学术道德、学术素养、学术贡献组成了反映学术声誉的三个层面,我们国家在严抓学术道德层面的当下,也要开始考虑年轻学者的学术素养培养问题,这样才能期待培养出真正的学术大师,对人类做出杰出学术贡献,回答钱学森之问。 相关博文:建一流大学先建一流网站 http://www.sciencenet.cn/m/user_content.aspx?id=307893
关于Publish or Perish以及Publish and Perish的博文汇总 最近由于井冈山大学论文告假事件引起了连锁反应,一直存在的问题再次炒热。。。 汇总一下有关文章链接,一为方便自己备忘,另外也可方便到访的朋友。 不断更新中。。。 0、Nature文章(Publish or perish in China)链接 http://www.nature.com/news/2010/100112/full/463142a.html 1、王鸿飞的发表就是灭亡( http://www.sciencenet.cn/m/user_content.aspx?id=286891 ) 2、引用到任胜利的Publish or perish vs. Publish and perish( http://www.sciencenet.cn/m/user_content.aspx?id=18830 ) 3、刘立的publish or perish机制及其变种:有感于Nature文章 ( http://blog.sciencenet.cn/m/user_content.aspx?id=286925 )
这个假期,除了陪爱人和儿子去逛了一下光谷步行街(吃喝玩乐一条龙,真的挺值得去的,儿子困的眼睛都睁不开了还不想回来呢),基本上都在实验室忙活,觉得还挺累的。刚刚看到下面在Nano Letters上的论文已经在线发表(ASAP)了,又给自己增添了一些动力。这篇论文经过反复的修改和补充重复与对照实验,有幸得到审稿人的肯定,得以发表,本来还有一些性能结果,不过主编认为仅仅组装与择优取向排布已经是比较系统的工作了,没必要再加性能进去。 欢迎各位同行提出宝贵的建议和评论。并祝各位朋友在新的一年里工作顺利,身体健康,合家欢乐! Orientated LangmuirBlodgett Assembly of VO 2 Nanowires Liqiang Mai, Yanhui Gu, Chunhua Han, Bin Hu, Wen Chen, Pengchao Zhang, Lin Xu, Wanli Guo and Ying Dai Publication Date (Web): January 2, 2009 (Letter) DOI: 10.1021/nl803550k http://pubs.acs.org/doi/abs/10.1021/nl803550k
不出所料,在二修回去之后的三天后,第四篇sci文章正式接收! Title:Vigilance in Przewalski's gazelle:effects of sex,predation risk and group size 如下接收全文!希望看到的师弟师妹们也尽快尽早多出文章,出好文章! 14-Nov-2008 Dear Dr. Zhongqiu Li It is a pleasure to accept your manuscript entitled Vigilance in Przewalskis gazelle: effects of sex, predation risk and group size in its current form for publication in the Journal of Zoology. First proofs will be emailed to you in due course, so please keep me informed of any change to your contact details. Please find attached an Exclusive License Form, which I would be grateful if you could complete and return to: Lucinda Haines Journal of Zoology Editorial Office Zoological Society of London Regent's Park London NW1 4RY UK We look forward to receiving further manuscripts from you in the future. Best wishes Lucinda Haines Editorial Office Journal of Zoology lucinda.haines@zsl.org on behalf of Prof. Nigel Bennett Editor, Journal of Zoology 10月26日发在新浪上的内容 这两天正忙着修改投到Journal of Zoology上的一篇文章-Vigilance in Przewalski's gazelle: effects of sex, predation risk and group size。这篇文章其实在去年的这个时侯就已经成文,但由于开始抱的期望过高,先后投到Journal of Animal Ecology、Behavioral Ecology、Ethology、Behavioral Ecology and Sociolbiology等动物生态及行为学顶级期刊都分别被拒。期间由于忙着找工作、照顾家小等原因,也懒得修改。9月初黄山动物学实习后相对清闲的一段时间,稍微改了下投到了Journal of Zoology。 这里,简单的介绍下这个杂志。JOZ由创立于1826年的伦敦动物学会主办,内容涵盖了动物学的几乎所有分支学科。JOZ的影响因子不是很高,仅仅在1-2之间徘徊,但由于其100多年的历史以及较大的发行量,始终是一个著名的动物学综合期刊。最近的二三十年,伦敦动物学会更是增加了其对野生珍稀濒危动物的保护投入和研究,JOZ上发表的珍稀动物保护研究的文章比重也不断增加,关于普氏原羚研究中的几篇重要文献均发表在JOZ上。 当然,选择JOZ的另一个原因也在于JOZ审稿周期非常短。我第一次投到JOZ上的文章大概不到一周就给了意见(是退稿),第二篇是40天的时间,然后修改返回去大概10天就接收了。这篇文章是9月11日投出,10月15收到审稿意见,只是很小的改动意见,我想这次改回去应该就能接收了(自己这样认为,没准还会被拒的,呵呵)。所以对于急着毕业需要文章的人来说,这种杂志应该是首选的。 至于这篇文章的内容,倒也无需详细介绍,主要就是利用焦点取样法,研究了性别、捕食风险以及集群大小对普氏原羚警戒行为时间、频次、周期的影响,等真正发表了再说啦。
 标签: 论文发表