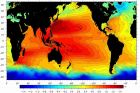
2009年哥本哈根气候会议之前的一个闹剧,就是马尔代夫政府在水下召开内阁会议,显示因为“全球变暖”引起海平面上升、他们的国家就要被淹没了。历届“气候会议”的谈判过程中,这些小岛国家都以此为理由向国际社会伸手要钱。 实际情况是不是这么恐怖?当然不是(“全球变暖”分子的宣传,没几个是站得住脚的)。这些岛国处于珊瑚礁之上,而珊瑚礁的面积并不只受到海面高低来控制,也受到沉积过程的影响(处于三角洲的孟加拉国也是如此)。2010年,新西兰奥克兰大学研究人员发表了一份研究结果:在过去的几十年,尽管太平洋中部的海平面上升了(上升速度每百年0.2米),所调查的珊瑚岛却有43%维持稳定,另43%面积有所增加。下图是其中的一个插图,那个岛,就属于哥本哈根会议上“发飙”的岛国图瓦卢。 (图片来源:Webba and Kench, The dynamic response of reef islands to sea-level rise: Evidence from multi-decadal analysis of island change in the Central Pacific . Global and Planetary ChangeVolume 72, Issue 3, June 2010, Pages 234–246.)
我国海平面上升速率高于全球:沿海经济的过度发展 我国海平面上升速率高于全球 http://www.sina.com.cn 2011年04月21日05:06 人民网-人民日报海外版 据新华社北京4月20日电 (记者 罗沙)国家海洋局20日发布的《2010年中国海平面公报》显示,近30年来 我国沿海海平面总体呈波动上升趋势,平均上升速率为2.6毫米/年,高于全球海平面1.7毫米/年的上升速率 ,海平面上升加剧了海洋灾害的发生。 公报显示,2010年我国沿海海平面比常年高67毫米,与2009年海平面基本持平,渤海、黄海2月份海平面 和南海10月份海平面均为近30年来同期最高值。 国家海洋信息中心产品研发部主任刘克修表示,全球气候变暖是造成我国海平面上升的主要原因。此外, 地下水开采、沿海地区大量建设高楼大厦等人类活动造成的地面沉降也是造成海平面相对上升的重要因素。 (编辑:SN034 http://news.sina.com.cn/c/2011-04-21/050622330567.shtml 沿海城市的沉没与沿海经济 推荐海平面百年将上升6米 ——三论沿海投资过度的风险 作者:杨学祥 关键字:海平面上升,南极冰盖融化,冰期,间冰期,气候长期变暖趋势 美国科学家2006年3月23日公布的一项研究报告说,极地冰川正以超出预期的速度融化,这将导致海平面在2100年上升6米。到那时,许多城市和岛屿,如美国的迈阿密、泰国首都曼谷和旅游胜地马尔代夫将会消失在汪洋之中。美国亚利桑那大学的乔纳森?奥弗佩克和全国大气研究中心的贝特?奥托-布利斯内根据目前全球变暖趋势,用计算机模拟未来气候和冰川融化,并根据沉积物、化石和冰核的资料得出结论,说到本世纪末,平均气温将至少上升2.5摄氏度,导致格陵兰岛和南极的冰川融化,这将使12.9万年前因全球变暖而海平面大幅上升的一幕再现 。 据早前的预测,2100年北极夏季温度将上升摄氏3至5度,届时格陵兰岛的冰层将开始融化,海水可能上升0.9米。大多数电脑模拟显示南极洲会保持稳定。但科学家分析了距今12.9万年与11.6万年间的气象记录,发现在最近一次北极气温上升达类似温度时,导致了南极冰层融化,释放出的水量竟比北极融冰更多 。这是新模型与旧模型的最大区别。 宏观的研究表明,在潮汐准60年的周期变化幅度上,1977年至1999年,处于拉马德雷暖位相时期,全球迅速变暖;2000年至2030年,处于与拉马德雷冷位相时期,全球将进入低温期;2031年至2060年又处于拉马德雷暖位相,全球又将迅速变暖 。 在潮汐1800年周期变化幅度上,目前正处于变暖的峰期。从15至17世纪的200余年内,世界上强震很多,其它自然灾害(如瘟疫流行)也很集中,这也正是蒙德极小值期 。这个时期太阳活动处于极小值,人们往往把它当作小冰期气候产生的原因。 美国科学家查尔斯?季林认为,即使没有温室效应, 地球自己的卫星月球也会使地球的温度上升。季林认为,地球、月亮和太阳相对位置的变化会引起潮汐强度的逐渐变化,其周期与气候周期是一致的。当日、地、月排成一线且相互距离最小时,日月引潮力相互加强而变为最大,地球海洋潮汐规模也最大,这时就有更多来自海洋深处的冷水被带到海面。这些冷水可以冷却海洋上的空气。据计算,大约在1425年即小冰期的末期,潮汐达到了最大值,从那以后逐渐减弱,直到3100年潮汐又达到最大值。这个周期是过去1万年气候变迁的主要动力。这个效应使地球的温暖期从小冰期末期一直持续到24世纪,而后随着潮汐的增强,地球的气候将逐渐变冷 。 在10万年冰期与间冰期转换周期中,目前处于地球轨道偏心率相对较小的间冰期,距今12.9万年与11.6万年间的气象记录,与现在的气候状况是相似的,都处于典型的迅速变暖过程。历史的经验是值得注意的。 我们在2004年就指出,海平面上升直接影响沿海地区人民生命财产安全和社会经济的发展,加剧了风暴潮灾害,增大了洪涝威胁,减弱了港口功能,并且引发了海水入侵、土壤盐渍化和海岸侵蚀等问题,导致了沿海湿地的损失和动物的迁徙,使按原设计标准建设的沿海城市市政排污工程的排污能力降低,对环境和人类活动构成直接威胁,严重影响了沿海经济的发展。我国的辽东湾、莱州湾和海州湾等岸段就因为海平面的升高而加重了其沿海低洼地区的土地盐渍化和洪涝灾害。沿海灾害加剧带来生产成本的提高和经济投资的风险 。 中国巨灾是由多种效应叠加而成,是局部地壳均衡累加为整体地壳均衡的产物。剥 蚀沉积、冰雪消长、地热梯度变化、地下水位变化、气压变化、海平面变化、潮汐振荡、旱涝交替、水库蓄水量变化和大城市建设等微力累加作用不可忽视。沿海城市无限制的扩大,将带来地面沉降、环境污染、海洋灾害、淡水危机等环境风险。 2006年3月21日消息:昆士兰州州长彼德?比蒂已经宣布进入紧急状态。“这是我们几十年来遭遇的最严重热带气旋,”比蒂当天在接受媒体采访时说。昆士兰州救灾部门负责人弗兰克?帕加诺也警告说,“拉里”有可能演变成类似去年8月美国遭遇的“卡特里娜”飓风的重大自然灾难。“拉里”最初被定为5级,是热带气旋中的最强级别。由于气旋在澳大利亚东北部着陆后强度会有所降低,气象局后来又将其降为3级。昆士兰州议员鲍勃?凯特称,“拉里”摧毁了当地90%的香蕉种植业,“这些作物价值2亿澳元(1.45亿美元)至3亿澳元(2.17亿美元),如果其中三分之二都灰飞烟灭,损失大约是1.5亿澳元(1.08亿美元)。”“大约18个月后,我们才能恢复(香蕉)生产,所以这次的损失非常巨大,”凯特说 。 一项新研究指出,世界上海洋表面温度的上升是1970年以来全球飓风强度增加的一个主要原因。Carlos Hoyos和同事用统计分析和信息论模型将6个海洋盆地中飓风强度的因素分离出来,这些海洋盆地分别位于北大西洋、太平洋、和印度洋。他们发现,全球这个时期内造成4、5类飓风数量增多的许多变量中,只有海洋表面温度上升是有统计意义的主要因素。其它因素能影响飓风的形成,所以它们也许在短期的变化中起作用。这篇文章也许能帮助人们更好地了解飓风强度增加趋势的原因。 在海平面上升和海洋灾害加剧的双重打击下,过度投资沿海地区将带来灾难性的后果。 参考文献 1.海平面百年将上升6米。2006年03月25日01:59 新文化报 。http://news.sina.com.cn/w/2006-03-25/01598523261s.shtml 2.路透社。 倫敦紐約東京 世紀末沉海?《泰晤士報》/《每日電訊報》 http://www.wenweipo.com/news.phtml?news_id=GJ0603250012cat=004GJ 3.杨冬红,杨学祥. 海洋中和海洋边缘巨震是调节气候恒温器理论的检验. 西北地震学报. 2005, 27(1): 96 4.Fred Pearce. Is the moon turning up the Earth’s thermostat? New Scientist, 2000, 166(2232): 12 5.Charles D. Keeling and Timothy P. Whorf. The 1800-year oceanic tidal cycle: A possible cause of rapid climate change. PNAS, 2000, 97(8): 3814-3819 6.杨学祥。直面沿海投资过度的环境安全。 2004-7-18光明网论文发表交流中心。http://www.gmw.cn/03pindao/lunwen/show.asp?id=856 7.张妍妍。 热带气旋袭击澳洲 可能导致又一次"卡特里娜"灾难。2006年03月21日 来源:新闻晨报。http://www.csi.ac.cn/lcy/ggaq/ggaq060321.htm 8.Carlos D. Hoyos, Paula A. Agudelo, Peter J. Webster, and Judith A. Curry。科学特快报告: Deconvolution of the Factors Contributing to the Increase in Global Hurricane Intensity。 http://bsg.gmw.cn/u/466/archives/2006/10997.html
其实这个鬼玩意很早以前就做过,奈何啊,人老了,记性不太好了,嘿嘿,大都忘了,今天在这打个桩吧 1)the solution of the SLE inthe form is often referred as to "gravitationally self-consistent solution" since it has been obtatined imposing that the geoid is that equipotential surface of the gravity field determined by the requirement of mass conservation; the ocean load is thus consistent with the gravity field. 2)海平面高定义为海面等势位面与地心之间的距离和固体地表与地心之间的距离差。不同时刻的海平面变化定义为两个时刻海面高差。根据定义,其影响的主要因素为:a:水准面位的变化;b:质量负荷导致的固体地球垂直形变;c:陆地海洋之间的水质量交换。 3)由于所选择的时间比较短,海平面方程主要基于几点假设进行简化:a:说采用的为球对称的粘弹性分层地球俗称SNRE地球。b:在短时间段内海洋盆地函数为常函数。c:假定冰盖与海洋的着地线不前进及后退。d:地壳运动对地表的影响可以忽略,即地形保持不变。 4)在impact of self-attraction and loading on the annual cycle in sea level一文中,作者对南北极的处理值得商讨:Separate time series are determined for northern and southern Greenland,as well as East and West Antarctica. In each case ,we assume that mass variation occurs uniformly over the region.while this method does suffer from the lack of geographic specificity present in the hydrological data sets,it will help to better determine the globally averaged amplitude and phase.Thus the results near Antarctica and Greenland may not be as accurate as desired,but in the far field this subsitution should have little impact other than correcting the overall global amplitude and phase . 我对之怀疑的原因 是作者将南北极各格点上的数据都一视同仁,这无疑会缩减西南极级北极南部对近海的影响,而作者的重点在于核对近海验潮站的数据,且并没有考虑地球自转回馈的影响,这对结果的影响有多大,a wonderful paper will be done if this idea is to compare them. 一段很有意思的评述,可以作为文章的 切入点 :Recent observations of bottom pressure from GRACE give another motivation for examining the SAL effects .In particular,the ratio of SAL effects to the dynamic ocean signal should be larger when considering ocean bottom pressure,which typically has smaller annual variations at a given location than sea level .Currently,SAL effects are not represented by many ocean models that are used to estimate bottom pressure variations,which,along with other missing model physics,can explain poor model/data agreement 翻译:最近GRACE给出的洋底压力贯彻结果给出了从另外角度检验SAL影响的途径 .特殊的是,但考虑海洋洋底压力时,这对比海平面而言在给定的位置周年变化要小得多,SAL影响在动态海洋信号中所占的比重应大的多 .时下,许多海洋模型在估计洋底压力变化时并没考虑SAL影响,与其它欠模拟的物理量一起,可以解释为什么模型结果和观测值符合得比较差了。 Given the assumed exchange of water between continents and oceans,the maximum of globally-averaged inferred ocean load would occur six months later(256 degrees) than the continental water storage. 假定水储量在陆地和海洋之间交换,最大的全球平均海洋负荷最大值出现在陆地水储量的6个月时间延后,相位差约为256度 The physics represented in Figure 2 indicates that during late winter when the loads are maximum in the high and midlatitudes of the northern hemisphere,as well as the Amazon and Congo basins,the SAL effect more water to be present in the ocean near these locations. 图2的背景物理含义为在北半球的中高纬区域在晚冬季节负荷达到最大,如亚马逊和刚果河流域等,此时由于SAL的影响更多的海水负荷聚集在周边区域。 有一句话很是费解,不知道他这里的IB反应为什么要用到Tide站中,Note,that the total signal in the observations may be very different : the IB effect must be added to compare the results with tide gauge records and the globally averaged atmospheric presure over the oceans must be added when comparing to bottom pressure measurements.我自己的理解是,在求解海平面方程的时候,由于只是涉及到位场的变化和负荷导致的海底地形的变化还有陆海空三者之间富含水负荷之间的相互迁移。在海洋上的假设是大气海洋耦合服从反变气压计原理。但验潮站测得的洋底至表面的所有高度的变化,这必然包含了反变气压计(即全球表面气压在海表的气压平均值),所以需要加回。 Ponte1999 The regions where the largest annual cycles in ocean bottom pressure are found are the Gulf of Thailand and of Carpen taria,the sourthern inIndian Ocean. Ponte1999 洋底压力最大的周年振幅出现在泰国海湾、澳大利亚东北部的卡奔塔利亚湾和南部印度洋海域。 疑问,为什么大部分文献都抓着interannual variations 不放,这个具有什么重要的物理含义?费解。we utilize the entire time series from 1980 to 1997 so that interannual variations would also be captured. The introduction of the SAL effects reduces the variance of the time series along the North American east and west coasts,Europe,southeastern Asia,Africa,and Japan.Other locations see an increase in the variance:South American,Australia,and west central Pacific islands. 我对这种结果的自觉 :图8中的靠近阿拉斯加和南极半岛区域澳大利亚区域的站点均方差均为负值,而在东南极半岛区域的南美洲区域的站点其表现的很好,离两级越远值效果越好。智力边上站点和阿拉斯加站点主要是受山岳冰川的影响吧。需要更好的来加以说明。 这篇文章很多句子都模拟两可,应该不是土美写的,抱怨一下.Both globally and in the Bay of Bengal,there is an increased variance reducion when including the atmospheric and dynamic ocean bottom pressure loads.There is an increased variance reduction also illustrates that this effect is not driven simply by the amplitude of the modeled annual cycle because the annual amplitude decreases when all the processes in the water cycle are considered.原文的意思不知道是不是可以表达成这样:在全球和Bengal海湾,当包含大气和动态海洋洋底压力负荷时,解释的均方差都提高。。。。 although steric variations and ocean dynamics may be expected to dominate sea-level variability in the majority of oceans,selfgravitation effects are significant in coastal zones and inclusion of this effect would provide an advancement in ocean modeling。虽然海平面变化的主要原因是热容变化和海洋动力学因素,但自吸引的影响在海岸区域十分明显,在海洋模型模拟的过程中包含这个因素将会得到更大的提高。 SAL与验潮站结果对比的不同,一直不解,有这样一句话:The results for the relative sea level(RSL) variations derived in section 2 represent motion of the sea surface relative to land,ignoring any direct effects of ocean dynamics,ocean density change,or atmospheric pressure change.In order to compare with tide gauge records,these effects must be added. For ocean dynamics and density changes,the sea level and ocean bottom pressure changes are obtained from the ocean model and can be added directly to delta SL.相对海平面变化(RSL)刻画了海洋表面相对于陆地的运动,忽略了海洋动力学,海洋密度变化和大气压强变化等因素的影响。为了更好的与验潮站数据相比较,这些影响都必须加回。对于海洋动力学和密度因素引起的变化,海平面和海洋洋底压力的变化从海洋模型获取并直接与所获得的由于质量原因导致的海平面变化相求和。 疑问:海洋动力学因素的影响???这个是如何实现的。 scaled ocean model???这里的scale是什么含义,怎么得来的,理论依据是什么? 总结句中一些比好好的句子: 1)Thus in these regions,this effect becomes a significant one that must be considered when assimilating data into ocean models.因此在这些区域,这种效应非常显著,在融合多种数据进新海洋模型的同时必须予以考虑 2)海洋模型对近海模拟较差的原因:Simulating sea level in coastal regions is difficult for global ocean models of coarse resolution. These models cannot adequately capture details of coastline geometrybottom topography,near-coastal wind effects or forcing by river runoff,which can be important in determining the sea level observed at tide gauges. 全球海洋模型由于比较稀疏的分辨率而对沿海岸区域的海平面模拟较差。这些模型不能精确的融合海岸几何特征,洋底地形和近海岸的风效应或者是河流径流驱动的影响,而这些对利用验潮站数据来监测海平面变化很重要 //***************************************************************************************// //-------****// 一篇类似的文章:effects of self-attraction and loading on annual variations of ocean bottom pressure Written by nadya T.Vinogradova published in JGR publication 摘要中比较好的总结: 1)Consideration of SAL physics introduces spatial variations that can be significant,particularly around continental boundaries,where the amplitude of deviations can exceed 1 cm.考虑SAL的物理过程对空间变化型态的影响显著,尤其是在陆地边缘区域,振幅偏差可以超过1厘米。 2)For the spatial variability indeced by SAL effects,changes in both land hydrology and atmospheric pressure are important.Effects related to the changing ocean circulation are relatively weaker, apart from a few shallow coastal regions.对SAL作用导致的空间影响而言,陆地水和大气压强同样重要,做了几个比较狭长的海岸区域,海洋环流的作用要小得多 正文1)recent analyses of GRACE data observed amplitudes considerably larger than the models indicate ,最近的GRACE研究结果观测得到的洋底压力振幅要比模型估计的大许多。 2) On seasonal scales,the resulting signal is spatially constant due to the ocean's isostatic response to atmospheric pressure loading 在季节周期上,海洋对大气压力负荷的反应为符合反变气压计,空间上为常数。 3)recently Tamisiea et al 2010 have shown that SAL effects cause variations of the annual amplitude of relative sea level on the order of 1 to 2 cm,supporting previous studies by Clarke et al 2005. Tamisiea2010最近的结果表明SAL对相对海平面变化的周年振幅影响在1~2厘米量级,这支持了Clarke2005的结果。 4)对站点数据的归类处理,值得学习:A number of BPR stations contain measurements that were collected during different periods in time but at the same locations.Such stations,and also those stations that are located within 1 degree of each other,are grouped together,which reduced the number of BPR series to 30. 这段话挑出来的原因是对原有数据进行归类整理: 在不同的时间段在大约相同的地理位置,存在一系列的有观测值的站点,另外也有一些站点位于1度范围内,这些站点被分成一个组,最后得到的站点为30个。 4)该篇文章的一个小缺点,contributions of snow and ice from Greenland ,Anatrctica,Alaska and other sources to the total water storage are not considered here.文章中并没有考虑北极,南极,阿拉斯加和其它的水储量变化没有考虑。 5)From BPR analysis,the strongest annual amplitudes are detected in the Bay of Bengal ,western Pacific and southern Aleutian islands。Moderate annual amplitudescan be observed in the Indian Ocean sector of the Sourthern ocean,southern Atlantic and in the Gulf of Alaska.The Weskest annual amplitudes are found along the western coast of the Us Hawaii and central America/ 有趣的来了:There are regions (e.g in the Gulf of Alaska,along the western coast of the US)where observations show a high level of spatial variability int he annual cycle.In these regions,amplitudes between the nearest stations can differ by more than a factor or two,possibly reflecting sensitivity of _ to short length scale oceanic features,such as highly variable bottom topography in the area. 对BPR分析结果,最强的周年振幅出现在孟加拉海湾,西太平洋和南部阿留申海岛区域。振幅微弱的周年信号出现在南部海洋的印度洋区域,大西洋南部区域和阿拉斯加海湾区域。最弱的周年振幅出现在美国西海岸、夏威夷和美洲总部区域。 存在一些区域(如美国西海岸的阿拉斯加海湾),观测数字显示周年振幅在空间上变化梯度比较大。在这些区域,邻近观测站点的振幅变化可以达到1或2个比例因子,很大程度上可能是由于小尺度的海洋特征引起的,即对其敏感,比如这个区域高度变化的海洋洋底地形。 6)Hirose et al 2001 compared high-frequency signals from a barotropic model with BPR observations at 18 sites in the Southern Ocean and showed that the simulated value underestimated observed variances at all sites ,with an average model/data correlation of 0.43 Hirose 2001对比了在南海洋正压模型的高频信号结果与BPR观测结果,表明模拟的值在所有的站点都低估了变化幅度,模型和实测数据之间的平均相关系数为0.43. To account for non-Boussinesq processes that are not represented in the solution,sea level and bottom pressure are corrected in the solution,sea level and bottom pressure are corrected by unmodeled volume changes that are ,following theapproach described by Ponte ,equal to the spatial mean steric height. 1.However,that the total signal in the observations may be very different: the IB effect must be added to compare the results with tide gauge records and the globally averaged atmospheric pressure over the oceans must be added when comparing to bottom pressure measurements. 总体信号与观测值对比是很不同的:当与潮汐验潮站观测资料对比时,必须加回IB影响。当与洋底压力测量值对比时,必须加回全球海洋上的大气压强平均值。 我不清楚的是,这里说的很不清楚: IB反映扣掉的不就是全球海洋上大气压强的平均值吗?后面的加回的也是全球海洋大气压强的平均值吗? 2.For the atmospheric forcing,in particular,this reduces the variability one might expect to see if finer samplings were used 考虑到大气驱动力,特殊的是,如果采用更好的时空采样率,得到的方差变化值可能减少。 3.Changes in the global average of the bottom pressure output are an artifact of the model's Boussinesq formulation and not of changes in averaged atmospheric pressure or mass flux,which are not represented in the model.To correct for this effect, we subtract a uniform water layer over the entire ocean corresponding to the spatially averaged bottom pressure monthly value. 模型数据得到的洋底压力全球平均输出值由于遵循的为Bossinesq原则而存在偏差。而不是由于大气压或质量迁移引起的,这并没有被模型所考虑。为改正这种影响,我们在全球海洋上扣除了均一分布的水质量薄层,数值等于近月的空间上洋底压力值平均值 4找到出处了, ,The dry component of atmospheric pressure is nearly constant,and thus the global average of surface pressure corresponds to changes in the water content of the atmosphere.Consequently, part of this variation in the water content,will contribute to a change in ocean mass. 大气压强中的干燥部分接近于常数,因此全球表面的大气压强对应于大气中的水含量部分。因此,这部分的水含量变化对应将会对海洋质量影响。 /**********************************************************************************************************/ /**********************************************************************************************************/ 一篇姊妹篇:Evidence of enhanced coastal sea level rise during the 1990s writtten by S.J.Holgate and P.L.Woodworth published on GRL 1) we address two important questions which arise naturally from these reported rates. The first ,necessary,question is concerned with whether tide gauge trends for the past 1o years are consistent with those measured in the nearby deep ocean by altimetry. A second question is whether the higher rate of the last decade is anomalously large compared to trends measured during other decadal periods in the historical record. 根据这里公布的速率,很自然的可以提出 两个重要的疑问 :首先,必要的是这些验潮站在过去10年内是否与邻近深海区域由测高卫星测得的结果相符。其次一个问题是在历史上的观测值而言,近十年的高速率值与其它十年时间期间内的趋势值相比是否显著大。 2)这篇关于验潮站的改正有更完整的论述 Tide gauge records were selected from the revised local reference(RLR)data set of the permanent service for mean sea level(PSMSL) .These records have been corrected for local datum changes and checked for problems such as abrupt changes due to earthquakes or trends by local factors (such as subsidence due to water extraction).Regions of known tectonic activity such as Alaska and the Pacific coast of canada were excluded. 验潮站的数据从RLR数据集中挑选。经过局部高程变化改正,和其它局部突发因素对长期趋势的影响如地震导致的突变、海水的抽取导致的沉降等。阿拉斯加和太平洋沿岸的加拿大区域由于板块运动活跃原因而被剔除。 一个小疑问:the sea level data were adjusted assuming a local inverse barometer approximation using the National Centers for Environmental Prediction reanalysis air pressure data available from 1948. 海平面观测数据经过假设的局部区域的反变气压计改正,所用数据为国际环境预测再分析中心的从1948年迄今的表面气压数据。 关于验潮站数据得到的全球上升趋势比测高卫星要大的 有趣结论 :Firstly it shows that the global mean sea level signal sampled by tide gauges is necessarily global coastal mean sea level and is likely to be different, to some extent,from the global signal derived from altimetry,dominated by the open ocean,Secondly it confirms that coastal sea level in spite of the decade having contained major deep-ocean EL Nino events. 由验潮站区域观测值的面积加权平均值得到的海平面上升趋势速率3.7毫米每年,比全球平均值显著大的多。这个结论在两方面比较重要。首先它表明测高卫星数据得到的全球平均海平面上升和验潮站测得的全球沿海平均海平面上升信号是不同的,测高卫星得到的观测值很大程度上是由远海(open ocean观测值决定。其次虽然全球平均海平面信号包含了主要的深海厄尔尼诺信号特征,但肯定了近海区域的海平面上升趋势速率在近十年来要比全球海平面上升速率大的多。 由各区域显著不同的上升趋势速率得到的结论:There is considerable variability in trends from region to region,although the time-series of trends are similar for neighbouring regions.Adjacent regions are often the most highly correlated(eg.Northern Europe and Scandinavia)but there are also anti-correlations(e.g.,E.and W.Atlantic)Since these trends are corrected for air pressure,it suggests that ocean processes must contribute to this large scale variability of sea level. 不同的区域之间的变化速率显著不同,虽然相邻的区域可能时间序列之间的长期趋势比较相似。通常相邻区域的结果高度相关(比如北欧和Scandinavia群岛)同时也存在反相关(欧洲和大西洋西部)。由于所得的趋势结果经过了气压改正,意味着海洋动力学一定是这种大尺度海平面变化的主要原因。 个人 反对,原因是:海洋动力学变化影响应该集中在深海部分,而在沿岸区域主要受当地的各种水流域作用如径流等的影响,亟待验证。 话没说完,作者给出了新的理论解释,有意思: Sea level rose faster at the coast than the global ocean averaged over the last decade,at a time when sea level was itself rising faser than at almost any time during the past half century.This observation is consistent with certain model results which demonstrate the propagation of sea level rise from the open ocean to the coast through Kelvin waves before being communicated around the ocean boundary by shelf-slope waves .Hsieh and Bryan's results suggest that the slow speed of high latitude Rossby waves could lead to a concentration of sea level rise at the coast. 在过去的十年中近海岸的海平面要比全球平均值上升快得多,同时比近半个世纪以来其它任何时间段上升的都快的多,这与其它的模型结果符合得比较好,表明从远海的海平面上升传通过开尔文波通过海岸线附近shelf-wave波传递到近海。Hsieh和Byan的结果暗示着高纬度的Rossby波可以导致近海按的质量富集从而使海平面上升。 Uncertainties in the glaciation-deglaciation history and in the parameterization of the shallower part of the earth (upper mantle and lithosphere)will mostly affect regional RSL changes at higher latitudes and estimates of the Antarctic ice sheet mass balance. conversely,regional RSL changes in coastal areas surface mass transport over neighbouring regions,are rather independent of the applied GIA correction. 冰川消融历史和地球浅层如上地幔和岩石圈等参数的不确定性对区域结果RSL影响应该很大,尤其是高纬度地区,主要是会影响估计的南极冰盖质量平衡结果。与之相反的是,其它与邻近区域地表质量迁移有关的近海的RSL变化,与所引用的GIA改正关系并不大. 个人评述:其实这可以很简单的说明:由海平面方程,其解算过程中变化量归根到底只有质量迁移因素,GIA估计质量主要影响区域为南极和加拿大区域,由格林函数与距离平方成反比,理所当然其它区域的影响要小得多。 we work under the assumption that the dominant signal in the multi-annual ocean trend is due to gravitational effects rather than ocean dynamics,this is a reasonable assumption,especially for the lowest harmonic degrees that will be highly sensitive to large-scale mass transport /**********************************************************************************************************/ /**********************************************************************************************************/ Recent mass balance of polar ice sheets inferred from patterns of global sea-level change,written by Jerry.X.Mitrovica published in Nature. 1)The term eustatic is defined as the change in ocean volume,that is ,the change in ice mass divided by the density of water,divided by the area of the ocean.全球海平面升降定义为海洋体积的变化,也就是说冰盖质量的变化与海水密度和海洋面积的比值。 关于图的描述,confirms that present day variations in polar ice mass will be accompanied by dramatic departures of sea level from eustasy 肯定了当今极地冰盖质量的变化使得海平面显著的偏离整体升降(这里的 Eustasy始终找不到合适的词来解释 ) the asymmetry in the latitudinal position of the sea-level maximum is due to rotational perturbations associated with Greenland mass flux.the dominant cause of the non-uniform redistribution is self-gravitation in the surface mass load.纬向上的海平面的最大值的对称可以归因于由于格陵兰岛质量迁移产生的离心力位变化.表面质量负荷的自吸引作用是非均一分布的主要因素。 关于物理机制的解释:water will pile up in the near field of an ice mass as a consequence of gravitational attraction;as the ice melts the ocean will relax and water will tend to flow from the near field to the far field.the same physical effects is evident in the remaining two frames of fig1.the ice mass variation near the south pole will be accompanied by a significant north-south gradient in the antarctic ocean,whereas the sea-level response to the melting of mountain glaciers is characterized by regionally localized minima..In all cases,an expectation of eustasy is only met in spatially limited geographic bands.Thus,secular sea-level trends inferred from tide gauge records may, depending on their location ,sample a sea-level redistribution due to polar ice melting that significantly departs from the eustatic measure of the ice balance. 冰质量的引力作用对近场的海水吸引而导致海水填充,随着冰盖质量融化并流入海洋,水负荷将从经常向远场流动。相同的物理机制可以解释另外两幅图的作用。南极区域冰盖质量的变化将伴随着显著的南极海洋区域南北向梯度变化。高山冰川消融对海平面的影响典型特征是局部区域的最小最大变化值。在所有的情形中,期望中的等势面只出现在少数的地理纬度带区域。因此,从验潮站记录数据推理得到的长期海平面趋势变化取决于站点的分布位置,对南极冰盖质量融化的海平面重分布采样可能显著的偏离冰盖质量变化导致的全球海平面变化。 3站点选择的凭据这里面提到的这点经常为我们所忽视。estimates of global sea-level rise based on the analysis of tide gauge records require stringent site selection in order to avoid ,for example ,bias assoicated with interdecadal fluctuations and the contaminating effects of tectonic deformations.从验潮站观测数据来推估全球海平面变化需要对站点极为小心的进行选择,比如,年际波动和板块运动变形影响等因素带来的误差影响等。 4 the question arises as to whether geographic trends in observed tide gauge rates may be used to constrain meltwater contributions from the main ice reservoirs.一个需要解决的问题是:验潮站观测的地理趋势是否可以用来对陆地冰储量地的融化情况作出约束。 5具有启发性的句子:Tide gauge records of sea-level change contain more information than has been recognizedin previous studies of global sea-level rise.验潮站记录的海平面变化对先前研究所了解的全球海平面变化提供更多的有用的信息 our analysis is preliminary in several respects. First, ocean thermal expansion is clearly not a eustatic process,and our future work will incorporate a more realistic treatment of the process once its spatial geometry is better described. 我们的分析结果在很多方面是初步的,首先,海洋热膨胀肯定不是一个eustatic过程,随着空间几何形态更好的描述我们将能够更真实的对该过程进行描述。 有疑问的句子,if significant latitudianl gradients in the geometry of thermal expansion exist within the northern hemisphere then these will influence our estimate of the amplitude of Greenland mass flux.. 显然,热膨胀导致的纬向梯度几何变化在北半球是显著的,因此,这将会对所估计的格陵兰岛质量流动振幅产生影响。 对未来的展望,可以作为新文章的切入点:we have focused on a restricted set of tide gauge sites,and in future work we will cautiously extend our procedure in order to incorporate a larger number of robust tide gauge records.这里的讨论很奇怪,因为主要的空间分布特征为纬带分布,如果热容海平面变化影响也是相同的方向,则所得的结论可能... 6)尽管研究长期项对我们很重要,但周期项: A full description and understanding of the average seasonal cycle in sea level and its various forcings are necessary prior to any discussion of interannual variability and long-term trends.对海平面循环平均季节循环和各种驱动力完整的描述和理解对讨论年际变化和长期趋势的了解起到必须的先导作用 描述PSMSL数据源:The mean sea level(MSL)data used in this study were collected by the permanent service for mean sea level. the PSMSL database includes over 1500 stations worldwide with records divided into 'revised local reference'(RLR)data,with controlled benchmark datum stability ,and 'metric' information,without long term daturm control 本研究所用的平均海平面(MSL)由PSML收集整理的.全球分布的1500个站点,观测的数据被划分为RLR(局部参考数据改正),控制了高程标准的稳定性,度量标准信息,但缺乏长期的高程控制基准。 对长期趋势的把握:One feature of the data which can be considered is the effect of secular trends.In general,RLR data with a sufficient time span can be used to estimate the secular trend in MSL ,but metric data ,which may include datum shifts,cannot |||| |||| G.A.Milne and J.X.Mitrovica The most recent paper on the subject,by Bills James(1996),has similarities to the analysis of Han Wahr(1989)in that only the laurentide ice mass and a eustatic ocean load are considered.Bills James(1996)conclude that calculations based on a rigid earth model give a 'reasonable first order estimate of the polar motion contribution to relative sea level'.If this suggestion is correct,then the problem is greatly simplified because only the direct effect of the rotaional potential needs to be considered(that is the sea-level response associated with the deformation induced by the changing rotational potential can be neglected).Using the rigid earth approximation,Bills James(1996) predicted a rotation-indeced postglacial sea-level signal that is of similar magnitude but of opposite sign to the prediction of Han Wahr(1989)在这个课题上最近的文献是Bills,与Han1989
地史上,海平面的变化深刻的影响了地表的环境,导致海洋进退循环,称之为进积和退积。理解海岸线变化以及与之相关的、不同时间尺度范围内的沉积和风化剥蚀的机制的关键是揭开地球构造与气候变化史的神秘面纱。在本期第827页,Petersen等人报道了关于这一概念的地球动力学模型,这一模型可能会引起根本性的变革。这一模型认为大约2~20M之间的沉积层序的摆动可能是由小范围地幔对流驱动的。 从覆盖大大部分大陆的海洋沉积物来看,在未来几代人的时间内,由于冰川消融引起的海平面上升与地史上发生过的海平面波动相比,可能要小得多。 早在1970s,Vail及其同事通过对人工地震和测井资料的研究提出一个全球海平面曲线,这一成果后来被Haq等精炼重提。这些曲线给我们提供了一个理解地质时间尺度上海洋的进退的全球框架。 一般认为,在几百万年的时间内海平面的称其变化是由于洋盆体积的波动,而这一波动取决于洋中脊的形成与破坏。在几万年的时间里,海平面更加频繁的波动是由于冰川体积的变化,进而影响洋盆水之体积。 但是,2~20M的间歇期问题向这一模式提出挑战。这一时间段内,无论是冰期还是间冰期,进积和退积无处不在。因此海平面的波动不能完全归因于冰川体积的变化,而洋盆的构造循环又慢的不足以导致这么频繁的波动。此外,全球范围内的地层层序相关性也由于全球海洋制图数据的非公开性而备受质疑。数据的精确程度不足以证明全球之间的联系。 Petersen等人认为间歇期海平面的变化可能不是全球性质的,而是由于局部小规模的地幔上涌或者下降。利用沉积盆地模型和地球动力学模拟,他们提出一个可以产生类似的沉积层序的机制。 (这是我翻译的一篇Science的文介) 作者: R. Dietmar Müller School of Geosciences, University of Sydney, Sydney, 2006 Australia . E-mail: dietmar.muller@usyd.edu.au
 标签: 海平面