科学网

 找回密码
  注册

tag 标签: 知识网络

相关帖子

版块 作者 回复/查看 最后发表

没有相关内容

相关日志

系统生物科学与工程
benlion 2013-6-21 11:20
国际上,系统与合成生物学 - 系统遗传学与医药学,基本沿着系统科学和综合哲学的结构论思维,以及理论与实验、计算与工程的方法,和生物系统与人工生物系统的机理与设计。 还有,神经 - 内分泌、免疫网络与基因 - 蛋白质、代谢网络,和细胞动力学、图式形成的形态发生学,包括,时间节律与形态结构转换的拓扑稳态模型,等体系( Biosystem Network , 1999 )发展。 - On the concept of systems biological engineering - From positive to synthetic medical science ) 概念和论述,涉及,生物系统 1 )网络模型、 2 )系统理论、 3 )计算机方法、 4 )实验方法、 5 )工程设计(转基因和微电子线路)和 6 )细胞动力学等。 科学知识体系,以信息链的传递而组织与发展,传递方式,包括,直接的论文、书籍和间接的会议、通讯等交流。 1996-2000 年直接通信,印象深刻的包括, L.Hood (生物技术)、 M.Tomita ( e-cell 模型)、 N.Seeman ( DNA 计算机)、 C. Nuslein-Volhard (图式形成)和 R.Ivarie (转基因动物),以及 2002 年挪威遗传学中心等。 其中, 1 ) -2 )和 6 )为 90 年代之前的系统生物学研究体系, 5 )为系统生物工程概念, 3 ) -4 )实证科学的数学方法和实验技术,发展到计算机建模和高通量技术,世纪之交筹备协会和会议时重点阐述的观点。 - 总结 -
个人分类: 2013|1755 次阅读|0 个评论
知识网络
热度 1 outcrop 2012-12-31 16:09
希望2013年,知识网络能够boot起来。 虽然有很多变数,但终究是一个值得努力的方向。 个人,团队以及社会范畴的知识网络,也许可以做一个统一。 剩下的,也许主要是排列组合的体力活了,但每个环节,还是得琢磨。 =============================关于博主============================= 博主的主要兴趣是:知识管理;相关兴趣有:语义网、机电及DIY、哲学与心理、信息安全、科幻等。 我的常用博客在科学网 (访问可点链接,下同); 新浪微博是@outcrop ,欢迎互粉;建了一个超级QQ群:17662971,希望能闲聊无白丁,欢迎加入;自己打理着一个 机电工程师 小网站,欢迎来玩。最近在科学网关注“ 科学网大学 ”,欢迎加入 科学网大学群组 讨论、尝试。
个人分类: 科学网大学|2376 次阅读|2 个评论
科学知识图谱与知识网络绘制
热度 6 yizhenzhong 2011-3-19 22:15
科学知识图谱与知识网络绘制
citespace不仅可用来做文献分析,还可以绘制很多类型的知识网络,如论文引用网络、作者合作网络、机构合作网络、国际合作网络等等,还可以把网络以不同的形式表现出来。由于citespace2.2的智能化功能,原本很多需要编程建模的,基本都可以直接生成网络。同时还附带计算出了很多的网络度量指标,很多时候,连pajek也省了。表现形式上也非常漂亮,是知识网络和科研合作网络研究初学者,网络建模与分析的好帮手。 下面是我用citespace做的几张网络图。感谢软件的编写者陈超美老师。
个人分类: 研究笔记|6772 次阅读|16 个评论
Build Strong Knowledge Framework
jhongbing2 2010-6-30 17:24
曾记得中学时候,数学令我最为头疼,耗时费力,却总不得其法。冗繁的定理、公式搞得我头昏脑胀,以致于现今提及,仍觉索然寡味。我想诸君之中或有类似经历。虽不想谈论定理、公式,但我对此现象 很感兴趣。一直思考为什么很多人不愿意学习数学。我得到的结论是:我们缺少良好的 KnowledgeFramework 。 什么是 K nowledge F ramework ? 我给它的定义就是:对事物进行分类组织的工具。 为什么说没有良好的分类组织工具就不愿意学习数学呢? 首先须知学数学需要什么能力。 Mathematics is the study of quantity, structure, space, and change. Mathematicians seek out patterns, formulate new conjectures, and establish truth by rigorous deduction from appropriately chosen axioms and definitions(Wikipedia) 。由其定义可知,学习数学所需的是:判断、推理等抽象思维能力。 抽象思维( abstract thinking )是人们在认识活动中运用概念、判断、推理等思维形式,对客观现实进行间接的、概括的反映的过程。概念是经过科学的抽象形成的规定。科学 的抽象是在对事物的本质属性进行分析、综合、比较的基础上,抽取出事物的本质属性,撇开其非本质属性,使认识从感性的具体进入抽象的规定(百度百科) 。 推理 主要有三种基本形式:类比、演绎与归纳。由此可见,抽象思维能力主要是比较、分析、综合、类比、演绎、归纳与判断的能力。 再仔细思考一下比较、分 析、综合、类比、演绎、归纳与判断的能力。比较:对比几种同类事物的异同、高下;分析:将事物、现象、概念分门别类,离析出本质及其内在联系;综合:把分 析过的对象或现象的各个部分、各属性联合成一个统一的整体或者把各种不同而有关联的事物组合在一起;类比:类比是根据研究对象的某些属性同另一种事物的某 些属性相同或相似,而推出与这些属性有关的其他方面也可能相同或相似的一种由已知推出未知的推理方法;演绎:从前提必然地得出结论的推理,从一些假设的命 题出发,运用逻辑的规则,导出另一命题的过程;归纳:归纳是从个别到一般的推理方法,即从许多个别事实中概括出一般原理;判断:对思维对象有所肯定或有所 否定(百度百科)。你会发现,所有这些能力都是建构在能对事物分门别类进行组织的基础之上的。 Moritz Schlick 所著的 General Theory of Knowledge 一书中也提到:知识就是把一类事物归结为另一类事物。 我们每个人都有自己的 KnowledgeFramework ,遇到新事物时,我们都会下意识地对其分门别类。但是这是很初级的没有经过认真思虑的 knowledgeframework ,一遇到复杂问题时候就会让人产生迷惑。举例说明:在求微分的时候,如果问题很简单,直接套公式就可以算,但是当问题很复杂的时候,不能一眼分辨出来需要用哪个公式,这时就可以看出良好的 KnowledgeFramework 的作用了,可能这个复杂的问题只需要在某个地方做一个形式变换,就能套公式了。但是如何知道这种问题能做何种变换呢?这就是 KnowledgeFramework 的功能,它会把微分问题分类,然后对各类微分问题可能的变换也进行分类,这样形成微分问题类别与变换类别的映射关系。这个例子中的 KnowledgeFramework 也可以叫做知识网络。在其他的场景中也有可能叫做知识结构、分类树等等,正因为我想不到一个合适的词语描述这种想法,索性就叫它 KnowledgeFramework 了。 所以如果没有精心地构建自己的 KnowledgeFramework ,遇到复杂问题时,困难、迷惑容易使我们丧失信心,这样会产生恶性循环,我想这就是为什么很多人不愿意学习数学的缘故吧。 数学是这样,其他学科应该也有类似情况。如果诸位有做老师的朋友 , 您不妨尝试一下下面的建议。 那么如何建立良好的 KnowledgeFramework 呢? 我提以下三点建议: 1 . 开放心态,尽可能多角度地思考问题。 每一个角度就是对事物分类的一个维度,角度多了自然就能够更加清晰地认识事物间的区别与联系。如何多角度地思考问题?一是多看书、多思考、多 实践,二是多请教、多讨论、多总结。 2 . 经常按照知识点、知识块、知识体系学习与思考。 对各个知识块、知识点穷追猛打、坚决拿下。最后不忘把它们映射到大的知识体系中与其它知识块产生关联。 3 . 请教高人,借鉴他人的 KnowledgeFramework 。 就此搁笔,诸君闻之,若有所思,则功德无量也。诚邀各位朋友讨论、批评、指正。
个人分类: 随笔|4636 次阅读|1 个评论
[转载]知识网络
rbwxy197301 2010-5-31 18:32
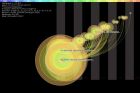
以下内容来自: http://www.visualcomplexity.com/vc/index.cfm?domain=Knowledge%20Networks Mapping Topics and Topic Bursts in PNAS Author(s):Ketan K. Mane, Katy Borner Institution:Indiana University Year:2004 URL:http://www.pnas.org/content/vol101/suppl_1/ Project Description: This work demonstrates an approach to map the dynamics of scientific knowledge via analysis of the complete set of papers published in the Proceedings of the National Academy of Science (PNAS) in the years 1982-2001. Data analysis techniques are applied to citation data within this corpus to analyze and visualize highly frequent words as well as sudden increases in the usage patterns of words, called 'bursts'. Author(s):W. Bradford Paley Institution:Digital Image Design Incorporated Year:2002 URL:http://www.textarc.org/ Project Description: TextArc: Revealing Word Associations, Distribution and Frequency. TextArc is a tool designed to help people discover patterns and concepts in any text by leveraging a powerful, underused resource: human visual processing. It compliments approaches such as Statistical Natural Language Processing and Computational Linguistics by providing an overview, letting intuition help extract meaning from an unread text. Here, an analysis of Lewis Carroll's Alice in Wonderland demonstrates TextArc's structure and some capabilities. TextArc represents the entire text as two concentric spirals on the screen: each line is drawn in a tiny (one pixel tall) font around the outside, starting at the top; then each word is drawn in a more readable size. Important typographic features, like the mouse-tail shape of a poem at about two o'clock, can be seen because the tiny lines retain their formatting. Frequently used words stand out from the background more intensely. Mathematical Physics Archive Author(s):Jean-Pierre Eckmann Institution:(unknown) Year:2003 URL:http://mcdb.colorado.edu/courses/3280/lectures/class16-2.html Project Description: This project was originally produced by Jean-Pierre Eckmann for the IAMP Conference 2003 in Lisbon. The concept was later pursued by Sid Redner, from Boston University, who showed that the network of scientific papers, connected by citations, has a power law degree distribution. In a test of this concept papers from the Mathematical Physics Archive were examined for reciprocal citation of the authors, yielding the preceding graph, where colors indicate areas of obvious curvature that were then checked for content. The strongest curvature is the area in red, statistical mechanics, which is reasonable given the nature of the database. This result emerged from the analysis that did not use scientific field as a parameter in generating the clusters. Visualizing Knowledge Domains Author(s):Katy Borner, Chaomei Chen, Kevin Boyack Institution:School of Library and Information Science - Indiana University Year:2002 URL:http://tinyurl.com/ykurjf Project Description: An overview of the author co-citation map (1977-2001), consisting of 380 authors with 9 or more citations. The map is dominated by the largest specialty of citation indexing. No strong concentration of other specialties are found, which implies the diversity of the domain. This map is a landscape view of the ACA map. The height of a citation bar indicates the number of citations for the correspondent author. The spectrum of colors on each citation shows the time when citations were made. Authors with more than 50 citations are displayed with semi-transparent labels.
个人分类: 信息检索|5717 次阅读|1 个评论

Archiver|手机版|科学网 ( 京ICP备07017567号-12 )

GMT+8, 2024-5-24 02:26

Powered by ScienceNet.cn

Copyright © 2007- 中国科学报社

返回顶部