Simplify everything An interview with John Logel February 2014 | Vol. 39 Issue 02 Interviews John Logel is a Geophysical Consultant to various organizations as a mentor/teacher and prospect reviewer. John’s previous positions were as Chief Geoscientist North Sea for Talisman Energy Norge/UK in Aberdeen Scotland, the Lead geophysicist in Norway, and Senior Geoscience Advisor for North American Operations in Calgary, AB. Prior to Talisman, He has held several technical management and advising positions with Anadarko Canada, and Petro-Canada in Calgary and before that worked 19 years for Mobil in numerous assignments in Europe and North America. John has over 32 Years of experience in the industry, and has worked on the discovery, delineation and development of several giant, world-class oil and gas fields throughout the world. His interests are in reservoir prediction and characterization from seismic data, understanding and quantifying risk. His latest emphasis has been in the adaptation of geophysical techniques to better understand, predict and exploit unconventional reservoirs effectively. He enthusiastically teaches and loves to develop technology and encourage professional growth. John is a professional Geophysicist and holds a BS and MS from the University of Iowa. He is a member of SEG, CSEG, APEGA, and AAPG. John has held several positions with the CSEG and the SEG, on technical committees, curriculum committee for the doodletrain, several session chair positions at the conventions, and positions on the International showcase. John has authored or co-authored over 50 professional papers. He also teaches professional development courses for Petroskills in basic geophysics and AVO, Inversion and Attributes. On a personal side, John is active in his children’s school, and baseball clubs. He enjoys skiing, motor biking and bicycling in his spare time. In today’s world of immediate and abundant information, it is easy to forget that geophysics is a specialized and complicated discipline that requires years of learning and understanding. It combines the sciences of mathematics and physics with the art of geology. This unique combination of left and right brain functions, along with the enthusiasm common in our field, can lead to very detailed, elaborate, sophisticated, and sometimes contorted explanations. We too often feel it is important to explain every detail and every equation, right from the fundamentals of our science. But sadly we can be misunderstood or, worse, not heard. By failing to pass on some of the elegance and beauty of it, we fail our science. In our earliest math classes we learn to simplify. Fractions, algebraic equations, multiple equations, unknowns, and complicated word problems about trains and other physical features become more understandable and usable as we simplify them. Even matrix complexity can usually be reduced to very simple expressions. One of the first lessons I learned in the oil business was from a supervisor named Tim Williams. After I tried to explain the then-young concepts of AVO, he told me, ‘A lot of this technology isn’t worth a damn, if you can’t explain it simply.’ I set out at that point to force myself to simplify. Simplifying is not as easy as it sounds. You have to become quite involved in the science and mathematics of the process. You must fully comprehend and know the strengths, weaknesses, and assumptions of the process or theory, and then you have to break it into individual elements that are explainable through everyday occurrences or objects. One way to simplify an idea is with an analogy. Some of my favourite geoscience simplifications are: Slinky used to show P-wave and S-wave propagation. Marshmallows and sugar cubes to explain Young’s modulus and Poisson’s ratio for ductile and brittle rocks. Making coffee to explain shale gas diffusion (credit is due to my colleague Basim Faraj for that one). Clear squirt gun filled with sand and water to demonstrate overpressure. Loud neighbours to explain acoustic attenuation. When you simplify any theory, concept, or geologic process, you make your ideas easier to understand, more engaging, and more memorable, too. As you simplify your life, the laws of the universe will be simpler; solitude will not be solitude, poverty will not be poverty, nor weakness weakness. HENRY DAVID THOREAU Simplifying does not just apply to science or to math but relates to everything we do. Making our lives simpler has the same effect. Things become easier to understand and more believable. People relate to you better and more often turn to you for help, advice, and guidance. Some of the best leaders demonstrate this ability. The best way we can represent our science and ourselves is to simplify everything. References Carcione, J., Helle, H., and Avseth, P., 2011, Source-rock seismic-velocity models: Gassmann versus Backus; Geophysics, 76, N37–N45. Ciz, R., and S. Shapiro, 2007, Generalization of Gassmann equations for porous media saturated with a solid material; Geophysics, 72, A75-A79. Gelinsky, S., and Shapiro, S., 1995, Poroelastic effective media model for fractured and layered reservoir rock; SEG Annual Meeting, Extended Abstract. Krief, M., J. Garat, J. Stellingwerff, and J. Ventre, 1990, A petrophysical interpretation using the velocities of P and S waves (full waveform sonic); The Log Analyst, 31, 355–369. Mavko, G. and Bandyopadhyay, 2008, Approximate fluid substitution for vertical velocities in weakly anisotropic VTI rocks; Geophysics, 74, D1-D6. Saxena, N., Mavko, G., and Mukerji, T., 2012, Exact and Approximate Solid Substitution Transforms; SEG Annual Meeting, Extended Abstract. Sayers, C., 2013, The effect of kerogen on the elastic anisotropy of organic-rich shales; Geophysics, 78, D65–D74. Vernik, L., 1994, Hydrocarbon-generation-induced microcracking of source rocks; Geophysics, 59, 555–563. QA: John, in your article you touch upon a very interesting aspect of learning in that if the concepts of science that we practice are explained in a simple way, they can be grasped easily by the listeners. I am reminded of how I used to grapple with the concept of probability in high school and would try and reason it out myself in terms of simple examples. While you suggest it should be done, let me begin by asking, how much do you think is being done in our industry, or in the academia? I am very impressed by how this is improving all the time. If you look at the Kahn Academy, Agile Geoscience and other online resources there are thousands of very practical and simple examples of science in action. Good TV shows like Big History and others explain the evolution of the earth, geologic processes and even quantum mechanics to the mass in very simple and easy to understand methods. This is all a Big Step Forward. Some recent research work cautions about the hazards of simplification in science. It suggests that everyone may not be qualified to be engaged in the simplification of scientific concepts and that it should be practiced by only those who have mastered those concepts and know what they are talking about. Your comments? There are several points in that question, some I strongly disagree with and some I agree with... I'm not sure there are hazards of simplifying science. If a person, a class or a generation can have a greater understanding of science we are all the better, (even if the simplification is... simplified). The point I agree with is the depth and breadth, of understanding of a subject to actually simplify, is crucial. I find it fascinating to have someone outside of our science ask for deep explanation. They tend to dig deep and not be afraid to ask the obvious. We commonly brush over things that we use everyday, but may not fully grasp. Along the same line, at occasional presentations made at Conventions or Workshops, you may have witnessed the presenters say that they came up with their results, and that they are the only possible answers and so are correct. In contrast, an expert would probably say something like ‘this is our perspective and is one way of arriving at the conclusion we have’. How would you categorize the former type of presentation? Unscientific? Arrogant, technically stifling and a bit dangerous. Science also includes uncertainty and it exists heavily in our science and everyday life. I'm reminded by two sayings. You don't know what you don't know and The older I get the more I realize how much I don't know, I think the view first definitive statement leads to complacency and credulousness and stifles experimentation and creativity. Plate tectonics is a good example of this, as well as evolution and even some new technologies coming in our own science. Einstein once said If you cannot explain something simply, you don’t understand it well. This is in line with what your supervisor said to you. Could you elaborate on this? I would have to agree. Einstein worked with some of the smartest people of the time, but it took his simple explanation to get backing. The exact same point can be made by Tesla and Edison when it came to electricity. In most cases decision makers don't have the depth and breadth of knowledge of that of an expert, so must be educated and sold on the concept. For encouraging simple and clear writing, which is very important for technical communication, there is another school of thought, which says, Don’t simplify the science, simplify the writing. Would you agree? I would agree, depending on the audience. A technical/peer reviewed journal audience is different from an industry or broad science audience. I think we see that in the inception and popularity of the Interpretation Journal from the SEG/AAPG. I learned a louder mantra in Uni and that was Write to inform, not to impress. That tends to lead you down the same path. One simple way to simplify a concept would be to break it down into smaller essentials, which are easy to understand and then execute it. Could you suggest some other ‘recipes’ for simplification of scientific ideas? I like that method, but I prefer the analogue. I prefer to start the concept in everyday situations and easily visualized. Then expand out from that. A hybrid is to break something into smaller essentials and analogue them. In Brian Russell's article, the discussion of Math was paramount, but Math is like a foreign language to a lot of people and can tend to alienate them. It is the solid basis of most of the scientific community, but is either understood or confusing, not much in between. Following on from that, I know in my own head, when I see an integral sign, a matrix symbol or other math operation, I instinctively visualize what it is doing. So the key is to get that visualization across. John, sometimes it is said that experts are more persuasive when they are less certain. Do you agree? Could you elaborate on this? I have to strongly agree, if you look at some of the greatest scientific breakthroughs (electricity, flight, DNA, transplants, autos etc) most of the dominant investigators were not that arrogantly certain. The ability to get your point across, know, and point out their weaknesses and still demonstrate passion and conviction is powerful. Let me turn to geophysics here: what do you think are the three most important unresolved problems in geophysics? Sometimes it is interesting to ask bold and open-ended questions. Well, let me see... I guess I still have to point out our greatest panacea, resolution. We have made great leaps with new acquisition methods, and pre- and post-stack algorithms but we are still working at macroscales. I'll follow that by perfect velocity determination. If we can understand and measure this field, we go a long way to much better images. Finally these items coming with a fast and less intense footprint, I guess I mean remotely. Again on a different note, permit me to ask this: what differences did you notice when you turned 30 years, 40 years, and 50 years old, and then at present? As an example, some people think 30s allowed them to experiment with options, 40s gave them time for self-introspection or naughty at 40, and so on. Your comments? Wow, that's deep for a geophysics journal! I feel that as I got older, I not only got more comfortable with myself, but with the science, and also the world has caught up on its interest in science. To be concise... 30, I was blindly technically arrogant; 40, I was technically tenacious; 50, I was technically confident and relaxed.
Quantitative Seismic Interpretation Per Avseth, Tapan Mukerji and Gary Mavko (2005). Cambridge University Press , 408 pages, ISBN 978-0-521-15135-1. List price USD 91, $81.90 at Amazon.com , 45.79 at Amazon.co.uk You have this book, right? Every seismic interpreter that's thinking about rock properties, AVO, inversion, or anything beyond pure basin-scale geological interpretation needs this book. And the MATLAB scripts. Rock Physics Handbook Gary Mavko, Tapan Mukerji Jack Dvorkin (2009). Cambridge University Press , 511 pages, ISBN 978-0-521-19910-0. List price USD 100, $92.41 at Amazon.com , 40.50 at Amazon.co.uk If QSI is the book for quantitative interpreters, this is the book for people helping those interpreters. It's the Aki Richards of rock physics. So if you like sums, and QSI left you feeling unsatisifed, buy this too. It also has lots of MATLAB scripts . Seismic Reflections of Rock Properties Jack Dvorkin, Mario Gutierrez Dario Grana (2014). Cambridge University Press , 365 pages, ISBN 978-0-521-89919-2. List price USD 75, $67.50 at Amazon.com , 40.50 at Amazon.co.uk This book seems to be a companion to The Rock Physics Handbook . It feels quite academic, though it doesn't contain too much maths. Instead, it's more like a systematic catalog of log models — exploring the full range of seismic responses to rock properies. Practical Seismic Data Analysis Hua-Wei Zhou (2014). Cambridge University Press , 496 pages, ISBN 978-0-521-19910-0. List price USD 75, $67.50 at Amazon.com , 40.50 at Amazon.co.uk Zhou is a professor at the University of Houston. His book leans towards imaging and velocity analysis — it's not really about interpretation. If you're into signal processing and tomography, this is the book for you. Mostly black and white, the book has lots of exercises (no solutions though). Seismic Amplitude: An Interpreter's Handbook Rob Simm Mike Bacon (2014). Cambridge University Press , 279 pages, ISBN 978-1-107-01150-2 (hardback). List price USD 80, $72 at Amazon.com , 40.50 at Amazon.co.uk Simm is a legend in quantitative interpretation and the similarly lauded Bacon is at Ikon, the pre-eminent rock physics company. These guys know their stuff, and they've filled this superbly illustrated book with the essentials. It belongs on every interpreter's desk. Seismic Data Analysis Techniques... Enwenode Onajite (2013). Elsevier . 256 pages, ISBN 978-0124200234. List price USD 130, $113.40 at Amazon.com . 74.91 at Amazon.co.uk . From the preview I'd say it's aimed at undergraduates. It starts with a petroleum geology primer, then covers seismic acquisition, and seems to focus on processing, with a little on interpretation. The figures look rather weak, compared to the other books here. Not recommended, not at this price. NOTE These prices are Amazon's discounted prices and are subject to change. The links contain a tag that gets us commission, but does not change the price to you. You can almost certainly buy these books elsewhere.
Introduction to Seismic Interpretation 地震解释导论 Bruce Hart , 2011, AAPG Discovery Series 16. Tulsa, USA: AAPG. This 'book' is a CD-based e-book, aimed at the newinterpreter. Bruce is an interpreter geologist, so there's plenty of seismicstratigraphy.(2011) A Petroleum Geologist's Guide to Seismic Reflection 石油地质学家反射地震指导 William Ashcroft , 2011. Chichester, UK: Wiley-Blackwell. I really, really like this book. It covers all theimportant topics and is not afraid to get quantitative — and it comes with a CDcontaining data and software to play with. Interpretation of Three-Dimensional Seismic Data三维地震资料解释 Alistair Brown , AAPG Memoir. Tulsa, USA: AAPG. 2011 This book is big! Many people think of it as 'the' bookon interpretation. The images are rather dated—the first edition was in1986—but the advice is solid. First Steps in Seismic Interpretation 地震解释基础 Donald Herron , SEG. Tulsa, USA: SEG. 2011 This new book is tremendous, if a little pricey for itssize. Don is a thoroughly geophysical interpreter with deep practicalexperience. A must-read for sub-salt pickers 3D Seismic Interpretation 3D地震解释 Bacon, Simm and Redshaw , 2007. Cambridge, UK: Cambridge A nicely produced and comprehensive treatment with plentyof quantitative meat. Multi-author volumes seem a good idea for such a broadtopic. Elements of 3D Seismology 3D地震基础 Chris Liner , 2004. Tulsa, USA: PennWell Publishing Chris Liner's book and CD are not about seismic interpretation, but would make a goodcompanion to any of the more geologically inclined books here. Fairly hardcore.
美国著名地质学家ALISTAIR R. BROWN(《三维地震资料解释》作者)最近在AAPG撰文,详细介绍什么是地震资料的解释(What Is Seismic Interpretation?)。该文章短小精悍,希望你读了能解开心中的种种疑惑! The horizon track on Lines 57 and 60 defining the structure, and the Horizon Slice sliced through the data volume 40ms below. (From Interpretation of Three-Dimensional Seismic Data, AAPG Memoir 42, SEG Investigations in Geophysics No. 9, Seventh Edition, 2011.) Seismic Interpretation is the extraction of subsurface geologic information from seismic data. On that definition we all are agreed.However, if we seek a more penetrating explanation, we find practitioners get tongue-tied and talk around the subject in a variety of ways.In this article I attempt to give a longer, more descriptive definition that will apply to every interpretation project involving reflection seismic data.The danger in seismic interpretation is in thinking that everything we see is geology! Reflection seismic data comprise: Continuity of reflections indicating geologic structure. Variability of reflections indicating stratigraphy, fluids and reservoir fabric. The seismic wavelet. Noise of various kinds and data defects. Seismic interpretation is the thoughtful procedure of separating these effects. The seismic wavelet starts as the pulse of seismic energy, which, generated by the energy source, travels down through the earth, is reflected and travels back up to the surface receivers carrying the geological information with it. This recorded wavelet is minimum phase of some frequency bandwidth, and during data processing it is converted (we hope) into a zero-phase wavelet, making interpretation easier and more accurate. The interpreter is not directly interested in the wavelet itself but rather in the geological information that it carries. Thus, understanding the wavelet and distinguishing its characteristics from details of the geology is one of the critical tasks of today’s interpreter. Noise is ever-present in seismic data. It may be random noise, it may be multiple reflections, it may be refracted energy, it may be other energy of unknown source. The data may suffer defects because of: Irregular data acquisition showing as footprint. Obstacles to the data acquisition crew. Equipment difficulties in the field. Processing problems. The interpreter must know enough about the acquisition and processing to recognize these undesirable features, and thus to not confuse them with the geology he/she seeks. Seismic energy is reflected from interfaces where the acoustic properties of the rocks change. These interfaces follow sedimentary boundaries created at the time of deposition of the sediments. Following the continuity of these reflections then defines for us the structure imposed on these boundaries by the tectonic forces of geologic history. Following this continuity and making structure maps is thus the most basic, and most traditional, activity of seismic interpretation. To aid in this endeavor the seismic interpreter can manipulate the data and the display in various ways. The time-honored approach to prepare the data for structural interpretation is to apply AGC (Automatic Gain Control) in the late stages of data processing. This reduces amplitude variability (where most of the statigraphic information lies), and hence increases visible data continuity. The interpreter also may compress the display color bar to optically saturate and thus to render invisible more of the amplitude variations. Other techniques include the use of Instantaneous Phase (which completely destroys amplitude information) and Structurally Oriented Filtering. All these are good ideas – provided the interpreter realizes that they are directed at structural interpretation only, and that the requirements of later, more advanced types of seismic interpretation are quite different. Once the structure has been established, the interpreter turns his attention to stratigraphic interpretation and the detection of hydrocarbon fluids. Overwhelming important here is seismic amplitude – and the amplitude may be presented to the interpreter or extracted from the data in various ways. The data loaded to the workstation must be True Amplitude and Zero Phase, and the interpreter must satisfy himself that the data used are such. Understanding the wavelet is complicated and very important (part of the fundamental separation of effects) but outside the scope of this article. In order to increase the visibility of stratigraphic variations the interpreter will remove the structure – and the best way to do this is to make a Horizon Slice. The concept behind the Horizon Slice is the reconstitution of a depositional surface at a key point in geologic history. The structure used for the reconstitution is most commonly defined at the level of the objective. However, it is often better to define the structure at one level (conformable with the objective) and to use this to remove the structure at the objective level. This very effectively separates structure into step one and stratigraphy into step two. This procedure is illustrated in the accompanying figure. The horizon tracked on the two vertical sections follows a reflection with good structural continuity and little, if any, stratigraphic variability. The horizon track is then displaced downwards by 40 ms (a simple horizon computation on the workstation) to intersect the prominent red blob visible below it, and the amplitude is then extracted along the displaced track. The resulting Horizon Slice, on the right of the figure, shows a very clear channel (the spatial pattern of the red blob) with interesting amplitude variations along it. When the seismic interpreter extends his analysis even further and enters the field of reservoir evaluation, the data requirements are even more stringent, but the Horizon Slice concept is still effective in removing the effects of structure. Some form of Inversion may be used here, and this process converts interface information (amplitude) into interval information (acoustic Impedance). The more advanced forms of inversion seek to remove the wavelet, and this is therefore part of the fundamental idea of separating effects. However, the challenge here is to exactly understand the wavelet that has to be removed. This is difficult, and many inversions suffer and projects fail because of this issue. So seismic interpretation is the thoughtful separation (with workstation assistance) of the various effects that the subsurface and the seismic acquisition process have mixed together! http://www.aapg.org/explorer/2013/05may/geocorner0513.cfm
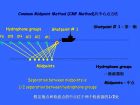
最近在网上找到一英文的地震波折射测量的资料,简明扼要, 推荐给大家学习,当着专业英语学习和翻译。毛宁波 Seismic Refraction Surveying Applied Seismology Earthquake Seismology Recordings of distant or local earthquakes are used to infer earth structure and faulting characteristics. Applied Seismology A signal, similar to a sound pulse, is transmitted into the Earth. The signal recorded at the surface can be used to infer subsurface properties. There are two main classes of survey: Seismic Refraction : the signal returns to the surface by refraction at subsurface interfaces, and is recorded at distances much greater than depth of investigation. Seismic Reflection : the seismic signal is reflected back to the surface at layer interfaces, and is recorded at distances less than depth of investigation. History of Seismology Exploration seismic methods developed from early work on earthquakes: 1846: Irish physicist, Robert Mallett , makes first use of an artificial source in a seismic experiment. 1888: August Schmidt uses travel time vs. distance plots to determine subsurface seismic velocities. 1899: G.K. Knott explained refraction and reflection of seismic waves at plane boundaries. 1910: A. Mohorovicic identifies separate P and S waves on traveltime plots of distant earthquakes, and associates them with base of the crust, the Moho . 1916 : Seismic refraction developed to locate artillery guns by measurement of recoil. 1921: ‘Seismos’ company founded to use seismic refraction to map salt domes, often associated with hydrocarbon traps. 1920: Practical seismic reflection methods developed. Within 10 years, the dominant method of hydrocarbon exploration. Applications Seismic Refraction Rock competence for engineering applications Depth to Bedrock Groundwater exploration Correction of lateral, near-surface, variations in seismic reflection surveys Crustal structure and tectonics Seismic Reflection Detection of subsurface cavities Shallow stratigraphy Site surveys for offshore installations Hydrocarbon exploration Crustal structure and tectonics Stress and Strain A force applied to the surface of a solid body creates internal forces within the body: Stress is the ratio of applied force F to the area across which it is acts. Strain is the deformation caused in the body, and is expressed as the ratio of change in length (or volume) to original length (or volume). Triaxial Stress Stresses act along three orthogonal axes, perpendicular to faces of solid, e.g. stretching a bar: Pressure Forces act equally in all directions perpendicular to faces of body, e.g. pressure on a cube in water: Strain Associated with Seismic Waves Inside a uniform solid, two types of strain can propagate as waves: Axial Stress Stresses act in one direction only, e.g. if sides of bar fixed: Change in volume of solid occurs. Associated with P wave propagation Shear Stress Stresses act parallel to face of solid, e.g. pushing along a table: No change in volume. Fluids such as water and air cannot support shear stresses. Associated with S wave propagation. Hooke’s Law Hooke’s Law essentially states that stress is proportional to strain. At low to moderate strains: Hooke’s Law applies and a solid body is said to behave elastically , i.e. will return to original form when stress removed. At high strains: the elastic limit is exceeded and a body deforms in a plastic or ductile manner: it is unable to return to its original shape, being permanently strained, or damaged. At very high strains : a solid will fracture, e.g. in earthquake faulting. Constant of proportionality is called the modulus , and is ratio of stress to strain, e.g. Young’s modulus in triaxial strain. Seismic Body Waves Seismic waves are pulses of strain energy that propagate in a solid. Two types of seismic wave can exist inside a uniform solid: A) P waves (Primary, Compressional, Push-Pull) Motion of particles in the solid is in direction of wave propagation. P waves have highest speed. Volumetric change Sound is an example of a P wave. B) S waves (Secondary, Shear, Shake) Particle motion is in plane perpendicular to direction of propagation. If particle motion along a line in perpendicular plane, then S wave is said to be plane polarised : SV in vertical plane, SH horizontal. No volume change S waves cannot exist in fluids like water or air, because the fluid is unable to support shear stresses. Seismic Surface Waves No stresses act on the Earth's surface ( Free surface ), and two types of surface wave can exist A) Rayleigh waves Propagate along the surface of Earth Amplitude decreases exponentially with depth. Near the surface the particle motion is retrograde elliptical. Rayleigh wave speed is slightly less than S wave: ~92% V S . B. Love waves Occur when a free surface and a deeper interface are present, and the shear wave velocity is lower in the top layer. Particle motion is SH , i.e. transverse horizontal Dispersive propagation : different frequencies travel at different velocities, but usually faster than Rayleigh waves. Seismic Wave Velocities The speed of seismic waves is related to the elastic properties of solid, i.e. how easy it is to strain the rock for a given stress. Depends on density , shear modulus , and axial modulus Speed of wave propagation is NOT speed at which particles move in solid ( ~ 0.01 m/s ). Constraints on Seismic Velocity Seismic velocities vary with mineral content, lithology, porosity, pore fluid saturation, pore pressure, and to some extent temperature. Igneous/Metamorphic Rocks In igneous rocks with minimal porosity, seismic velocity increases with increasing mafic mineral content. Sedimentary Rocks In sedimentary rocks, effects of porosity and grain cementation are more important, and seismic velocity relationships are complex. Various empirical relationships have been estimated from either measurements on cores or field observations: 1) P wave velocity as function of age and depth km/s where Z is depth in km and T is geological age in millions of years (Faust, 1951). 2) Time-average equation where is porosity, V f and V m are P wave velocities of pore fluid and rock matrix respectively (Wyllie, 1958). Usually V f ≈ 1500 m/s, while V m depends on lithology. If the velocities of pore fluid and matrix known, then porosity can be estimated from the measured P wave velocity. Nafe-Drake Curve An important empirical relation exists between P wave velocity and density. Crossplotting velocity and density values of crustal rocks gives the Nafe-Drake curve after its discoverers. Only a few rocks such as salt (unusually low density) and sulphide ores (unusually high densities) lie off the curve. Waves and Rays In a homogeneous, isotropic medium, a seismic wave propagates away from its source at the same speed in every direction. The wavefront is the leading edge of the disturbance. The ray is the normal to the wavefront. Huygen’s Principle Every point on a wavefront can be considered a secondary source of spherical waves, and the position of the wavefront after a given time is the envelope of these secondary wavefronts. Huygen’s construction can be used to explain reflection, refraction and diffraction of waves However, it is often simpler to consider wave propagation in terms of rays, though they cannot explain some effects such as diffraction into shadow zones. Reflection and Refraction at Oblique Incidence When a P wave is incident on a boundary, at which elastic properties change, two reflected waves (one P, one S) and two transmitted waves (one P, one S) are generated. Angles of transmission and reflection of the S waves are less than the P waves. Snell’s Law Exact angles of transmission and reflection are given by: p is known as the ray parameter . Critical Angles There are two critical angles corresponding to when transmitted P and S waves emerge at 90°. Amplitude of Reflected and Transmitted Waves At oblique incidence, energy transformed between P and S waves at an interface. Amplitudes of reflected and transmitted waves vary with angle of incidence in a complicated wave given by Zoeppritz equations . Example P wave reflection amplitude can increase at top of gas sand. Wave Incident on Low Velocity Layer (No critical point) Wave Incident on High Velocity Layer (P and S critical point) Normal Incidence Reflection Amplitudes When angle of incidence is zero, amplitudes of reflected and transmitted waves simplify to the expressions below. Reflection Coefficient: Transmission Coefficient: where Z is the acoustic (P wave) impedance of the layer, and is given by Z = V , where V is the P wave velocity and the density. Same formulae apply to S waves at normal incidence. Critical Refraction When seismic velocity increases at an interface (V 2 V 1 ), and the angle of incidence is increased from zero, the transmitted P wave will eventually emerge at 90°. Refracted wave travels along the upper boundary of the lower medium. Head Waves The interaction of this wave with the interface produces secondary sources that produce an upgoing wavefront, known as a head wave , by Huygen’s principle. The ray associated with this head wave emerges from the interface at the critical angle. This phenomenon is the basis of the refraction surveying method. Diffractions Reflection by Huygen’s Principle When a plane wavefront is incident on a plane boundary, each point of the boundary acts as a secondary source. The superposition of these secondary waves creates the reflection. Diffraction by Huygen’s Principle If interface truncates abruptly, then secondary waves do not cancel at the edge, and a diffraction is observed. This explains how energy can propagate into shadow zones. A small scattering object in the subsurface such as a boulder will produce a single diffraction. A finite-length interface will produce diffractions from each end, and the interior parts of the arrivals will be opposite polarity. Seismic Field Record Dynamite shot recorded using a 120-channel recording spread Seismic Refraction Surveying Refraction surveys use the process of critical refraction to infer interface depths and layer velocities. Critical refraction requires an increase in velocity with depth. If not, then there is no critical; refraction: Hidden layer problem . Geophones laid out in a line to record arrivals from a shot. Recording at each geophone is a waveform called a seismogram . Direct signal from shot travels along top of first layer. Critical refraction is also recorded at distance beyond which angle of incidence becomes critical. Example For a shallow survey, 12-24 vertical 30 Hz geophones would be laid out to record a hammer or shotgun shot. First Arrival Picking In most refraction analysis, we only use the travel times of the first arrival on each recorded seismogram. As velocity increases at an interface, critical refraction will become first arrival at some source-receiver offset . First Break Picking The onset of the first seismic wave, the first break , on each seismogram is identified and its arrival time picked . Example of first break picking on Strataview field monitor Travel Time Curves Analysis of seismic refraction data is primarily based on interpretation of critical refraction travel times. Plots of seismic arrival times vs. source-receiver offset are called travel time curves . Example Travel time curves for three arrivals shown previously: Direct arrival from source to receiver in top layer Critical refraction along top of second layer Reflection from top of second layer Critical Distance Offset at which critical refraction first appears. Critical refraction has same travel time as reflection Angle of reflection same as critical angle Crossover Distance Offset at which critical refraction becomes first arrival. Field Surveying Usually we analyse P wave refraction data, but S wave data occasionally recorded Land Surveys Typically 12 or 24 geophones are laid out to record a shot along a cable, with takeouts to which geophones can be connected. Geophones and cable comprise a spread . Shot would usually be placed at one end of spread for first recording, then second recording made at other end. Off-end and split-spread shooting also possible. Marine Surveys Shot firing and seismograph recording systems are housed on a boat. Two options for receivers: A) Bottom-cable: Hydrophones contained in a ~55 m cable which is deployed or dragged along bottom of river or seabed. B) Sonobouys Hydrophone is suspended from floating buoy containing radio telemetry to transmit seismogram to boat. Boat steams away from sonobouy firing an airgun. Interpretation of Refraction Traveltime Data After completion of a refraction survey first arrival times are picked from seismograms and plotted as traveltime curves Interpretation objective is to infer interface depths and layer velocities Data interpretation requires making assumption about layering in subsurface: look at shape and number of different first arrivals. Assumptions Subsurface composed of stack of layers, usually separated by plane interfaces Seismic velocity is uniform in each layer Layer velocities increase in depth All ray paths are located in vertical plane, i.e. no 3-D effects with layers dipping out of plane of profile Analysis based on considering critical refraction raypaths through subsurface. Planar Interfaces: Two Layers For critical refraction at top of second layer, total travel time from source S to receiver G is given by: Hypoteneuse and horizontal side of end 90 o -triangle are: and respectively. So, as two end triangles are the same: At critical angle, Snell’s law becomes: Substituting for V 1 / V 2 , and using cos 2 + sin 2 = 1 : This equation represents a straight line of slope 1/V 2 and intercept Interpretation of Two Layer Case From traveltimes of direct arrival and critical refraction , we can find velocities of two layers and depth to interface: 1. Velocity of layer 1 given by slope of direct arrival 2. Velocity of layer 2 given by slope of critical refraction 3. Estimate t i from plot and solve for Z: Depth from Crossover Distance At crossover point, traveltime of direct and refraction are equal: Solve for Z to get: Planar Interfaces: Three Layer Case In same way as for 2-layer case, can consider triangles at ends of raypath, to get expression for traveltime. After simplification as before: The cosine functions can be expressed in terms of velocities using Snell’s law along raypath of the critical refraction : Again traveltime equation is a straight line, with slope 1/V 3 and intercept time t 2 . Warning: is NOT the critical angle for refraction at the first interface. It is an angle of incidence along a completely different raypath! Interpretation of Three Layer Case In three layer case, the arrivals are: 1. Direct arrival in first layer 2. Critical refraction at top of seconds layer 3. Critical refraction at top of third layer Because, intercept time of traveltime curve from third layer is a function of the two overlying layer thicknesses, we must solve for these first. Use a layer-stripping approach: 1. Solve two-layer case using direct arrival and critical refraction from second layer to get thickness of first layer. 2. Solve for thickness of second layer using all three velocities and thickness of first layer just calculated. Planar Interfaces: Multi-Layer Case For a subsurface of many plane horizontal layers, the planar interface travel time equation can be generalised to: where i is the angle of incidence at the ith interface, which lies at depth Z i at the base of a layer of velocity V i . Interpretation Proceeds by a layer-stripping approach, solving two-layer, three-layer, four-layer etc. cases in turn. Dipping Planar Interfaces When a refractor dips, the slope of the traveltime curve does not represent the "true" layer velocity: shooting updip , i.e. geophones are on updip side of shot, apparent refractor velocity is higher shooting downdip apparent velocity is lower To determine both the layer velocity and the interface dip, forward and reverse refraction profiles must be acquired. Note: Travel times are equal in forward and reverse directions for switched, reciprocal , source/receiver positions. Dipping Planar Interface: Two Layer Case Geometry is same as flat 2-layer case, but rotated through , with extra time delay at D. So traveltime is: Formulae for up/downdip times are (not proved here): where V u / V d and t u / t d are the apparent refractor velocities and intercept times. ; Can now solve for dip, depth and velocities: 1) Adding and subtracting, we can solve for interface dip and critical angle C : ; 2) Can find layer 2 velocity from Snell’s law: 1. Can get slant interface depth from intercept times, and convert to vertical depth at source position: ; Faulted Planar Interface If refractor faulted, then there will be a sharp offset in the travel time curve: Can estimate throw on fault from offset in curves, i.e. difference between two intercept times, from simple formula: Interpretation of Realistic Traveltime Data With field data it is necessary to examine traveltime curves carefully to decide on best method to use: How many refraction branches are there, i.e. how many layers? Are anomalous times due to mispicking or real? Small anomalies can be ignored, but larger ones require other methods, e.g. Plus-Minus. Multiple source positions allow, some inference of depth of anomaly: near-surface anomalies align Surface Topography Intervening Velocity Anomaly Refractor Topography Refractor Velocity Variation Delay Times For irregular traveltime curves, e.g. due to bedrock topography or glacial fill, much analysis is based on delay times. Total Delay Time Difference in traveltime along actual raypath and projection of raypath along refracting interface: ; Total delay time is delay time at shot plus delay time at geophone : For small dips, can assume x=x I and: Refractor Depth from Delay Time If velocities of both layers are known, then refractor depth at point A can be calculated from delay time at point A: Using RH triangle to get lengths in terms of z: Using Snell’s law to express angles in terms of velocities: Simplifying: So refractor depth at A is: Varying Interface Refractor Velocity: Plus-Minus Method Hagedoorn’s Plus-Minus method used for more complex cases: Undulating interfaces Changes in refractor velocity along the profile Plus-Minus: Requires forward and reverse travel times at geophone location to find delay time and refractor velocity at geophone Assumes interface is planar between D and E, can result in smoothing of actual topography Assumes dips less than ~10 o . Delay time at G given by: which can be found from observed data. Plus and Minus Terms Using previous figure can write down forward/ reverse traveltimes: Minus Term Used to determine laterally varying refractor velocity, i.e. V 2 (x): Velocity given by local slope of plot of (T - ) vs. x, distance along profile. Note factor of 2 compared with the plane layer method. Velocity may change along profile, so written as V 2 (x). Different values of V 2 can be used for calculation of interface depth using Plus term Plus Term Determines refractor depth at a location from delay time there: So from delay time formula for depth, depth at G given by: Depth can be determined at each geophone location where forward and reverse traveltimes recorded using V 2 estimated for that position Plot of Minus Term A. Composite traveltime distance plots for four different shots B. Plot of Minus Terms: note lateral changes in refractor velocity Hidden Layer Problem Layers may not be detected by first arrival analysis: A. Velocity inversion produces no critical refraction from layer 2 B. Insufficient velocity contrast makes refraction difficult to identify C.Refraction from thin layer does not become first arrival D.Geophone spacing too large to identify second refraction Seismic Refraction Energy Sources Source for a seismic survey source has to be chosen bearing in mind the possible signal attenuation that can occur, often a function of the geology. Requirements Sufficient energy to generate a measurable signal at receiver Short duration pulse, i.e. containing enough high frequencies, to resolve the desired subsurface layering Repeatable source with a known, consistent waveform Minimal mechanical noise Ease of operation There are many different seismic refraction sources, but the most important are: On land: sledge hammer, weight drop, shotgun (shallow work) dynamite (crustal studies) At sea: airgun (oil exploration, crustal studies) Land Seismic Sources: Mechanical Sledge Hammer A sledge hammer is struck against a metal plate: Vertically down on plate to generate P waves Horizontally against side of plate to produce S waves Inertial switch on hammer triggers data recording on impact. Problems with repeatability and possible bouncing of hammer. Used for refraction spreads up to 200 m. Accelerated weight–drop Mechanical system, using compressed air or thick elastic slings, forces weight onto baseplate with greater force Better repeatability than sledge hammer Land Seismic Sources: Explosive Buffalo Gun Metal pipe inserted up to 1 m into the ground, and a blank shotgun cartridge fired. Exploding gases from gun impact ground and generate the seismic pulse. Dynamite Shot holes up to 30 m are drilled, and loaded with dynamite, which usually comes in 0.5 m plastic cylinders that can be screwed together. Marine Seismic Sources: Airgun Airguns are most common seismic source used at sea. Essentially, an airgun is a cylinder that is filled with compressed air, and then releases the air into the water. The sudden release of air creates a sharp pressure impulse in the water. Airgun Bubble Oscillation 1. Air bubble from airgun expands until pressure of surrounding water overcomes its expansion, and forces it to contract. 2. Bubble then collapses , compressing the air until the air pressure exceeds the water pressure, and the bubble can expand again. 3. Expansion and collapse continues as bubble rises to surface , giving oscillatory signal characteristic of single airgun. Airguns are usually deployed at a depth of a few metres, so there is always a reflection from sea surface, called the ghost. The sea surface RC is –1, so ghost is almost as strong as original signal, producing a trough-peak response. Land Sensor: The Geophone Geophone is essentially only type of sensor used on land. A geophone comprises a coil suspended from springs inside a magnet. When the ground vibrates in response to a passing seismic wave, the coil moves inside the magnet, producing a voltage, and thus a current, in the coil by induction. As coil can only move in one direction, usually vertical, the geophone only senses the component of seismic motion along axis of coil . Three orthogonal geophones necessary to fully characterise seismic ground motion. Geophones respond to the rate of movement of the ground, i.e. particle velocity, and are often laid in arrays of several phones. Principle of Geophone Geophone Damping As geophone coil moves inside magnet, current induced in coil produces a magnetic field that opposes, i.e. damps , the movement of the coil. If a geophone is tapped, the oscillation of coil will die out. At critical damping , coil will return to rest most quickly. If damping very small , coil will oscillate at the natural frequency of the electromechanical system. Normal damping is 70% critical. Natural Frequency Natural frequency and damping affect the range of frequencies the geophone can record: 14 Hz geophones used in oil exploration 30 Hz geophones used in high resolution studies 100 Hz geophones used in very shallow work Marine Sensor: The Hydrophone Hydrophones used to detect the pressure variations in water due to a passing seismic wave. A hydrophone comprises two piezoelectric ceramic discs cemented to a sealed hollow canister. A pressure wave squeezes the canister, bending the ceramic and generating a voltage. The two discs are connected in series so that the output generated by acceleration of the hydrophone cancels Pressure will squeeze ceramics and so produce output. Recording Instruments Electrical output from geophone, i.e. voltage, is digitised by recording instrumentation and written onto tape or disk. Data are viewed on monitor records in field to check quality. Many different type of recording instrument available. Example (Strataview, Geometrics) Face of a Strataview seismograph commonly used in shallow seismic work, and able to record up to 24 channels. Recording Channel Channel refers to electrical input to recording system. Might be from a single geophone as in engineering work, or a group of 9 geophones, common in oil exploration. In oil exploration work, recording systems can record up to 8000 channels. Application to Assessment of Rock Quality Seismic refraction most commonly employed where velocities increase suddenly with depth, e.g. determining depth to bedrock. From the estimated layer velocities estimates of rock strength and excavation difficulty can be made. Rippability is ease with which ground can be excavated with a mechanical digger, varies with tractor size and power. In 1958, the Caterpiller Tractor Company began using seismic velocities from refraction experiments to estimate rippability. Rippability for various common rocks: Application to Landfill Investigation 1 Seismic methods rarely used in landfills, because seismic waves are often attenuated in the unconsolidated materials. Most landfills comprise hole excavated into bedrock, filled with waste, and covered by an impermeable compacted clay cap. Gases are then vented in a controlled fashion through outlets. Fault analysis used to find quarry height from offset in intercepts Application to Landfill Investigation 2 Integrity of clay cap from refraction velocities Low P wave velocities used to identify fractures in the clay cap that required repair. P wave velocities in the fractured zones were around 370 m/s, compared with 740 m/s over unfractured areas. In some areas, not possible to obtain critical refraction due to velocity in the fill being lower than in clay cap. Application to Tectonics: Structure of Ocean Crust Fracture zones comprise active transform faults located between the ends of spreading segments on a midocean ridge, plus their lateral extension Fracture zones contain some of the most rugged topography on Earth Crustal thickness can be measured by firing explosive shots over seafloor deployed ocean-bottom Crustal refraction data usually plotted using reduced travel time , i.e. a linear time shift. If vertical axis is T-X/8000, a refraction with velocity of 8000 m s -1 will appear horizontal Reversed Refraction Profiles over Normal Ocean Crust Reversed Refraction Profiles along Fracture Zone Plane Layer Solution for Normal Ocean Crust OBS 7 OBS 6 Plane Layer Solution for Normal Fracture Zone Crust OBS 2 OBS 6 Fracture zone crust is thin and has low velocities due to fracturing and hydrothermal circulation Refraction Profile Orthogonal to Fracture Zone Raytracing for Large Lateral Velocity Variations Advantages and Disadvantages of Seismic Methods W hen compared to the other geophysical methods we've described thus far, the seismic methods have several distinct advantages and several distinct disadvantages. Seismic Methods Advantage Disadvantage Can detect both lateral and depth variations in a physically relevant parameter: seismic velocity. Amount of data collected in a survey can rapidly become overwhelming. Can produce detailed images of structural features present in the subsurface. Data is expensive to acquire and the logistics of data acquisition are more intense than other geophysical methods. Can be used to delineate stratigraphic and, in some instances, depositional features. Data reduction and processing can be time consuming, require sophisticated computer hardware, and demand considerable expertise. Response to seismic wave propagation is dependent on rock density and a variety of physical (elastic) constants. Thus, any mechanism for changing these constants (porosity changes, permeability changes, compaction, etc.) can, in principle, be delineated via the seismic methods. Equipment for the acquisition of seismic observations is, in general, more expensive than equipment required for the other geophysical surveys considered in this set of notes. Direct detection of hydrocarbons, in some instances, is possible. Direct detection of common contaminants present at levels commonly seen in hazardous waste spills is not possible. I f an investigator has deemed that the target of interest will produce a measurable seismic anomaly, you can see from the above list that the primary disadvantages to employing seismic methods over other methods are economically driven. The seismic methods are simply more expensive to undertake than other geophysical methods. Seismic can produce remarkable images of the subsurface, but this comes at a relatively high economic cost. Thus, when selecting the appropriate geophysical survey, one must determine whether the possibly increased resolution of the survey is justified in terms of the cost of conducting and interpreting observations from the survey. Advantages and Disadvantages of the Refraction and Reflection Methods On the previous page, we attempted to describe some of the advantages and disadvantages of the seismic methods when compared to other geophysical methods. Like the electrical methods , the seismic method encompasses a broad range of activities, and generalizations such as those made on the previous page are dangerous. A better feel for the inherent strengths and weaknesses of the seismic approach can be obtained by comparing and contrasting the two predominant seismic methods, refraction and reflection, with each other. Refraction Methods Reflection Methods Advantage Disadvantage Advantage Disadvantage Refraction observations generally employ fewer source and receiver locations and are thus relatively cheap to acquire. Because many source and receiver locations must be used to produce meaningful images of the Earth's subsurface, reflection seismic observations can be expensive to acquire. Little processing is done on refraction observations with the exception of trace scaling or filtering to help in the process of picking the arrival times of the initial ground motion. Reflection seismic processing can be very computer intensive, requiring sophisticated computer hardware and a relatively high-level of expertise. Thus, the processing of reflection seismic observations is relatively expensive. Because such a small portion of the recorded ground motion is used, developing models and interpretations is no more difficult than our previous efforts with other geophysical surveys. Because of the overwhelming amount of data collected, the possible complications imposed by the propagation of ground motion through a complex earth, and the complications imposed by some of the necessary simplifications required by the data processing schemes, interpretations of the reflection seismic observations require more sophistication and knowledge of the process. Refraction seismic observations require relatively large source-receiver offsets (distances between the source and where the ground motion is recorded, the receiver). Reflection seismic observations are collected at small source-receiver offsets. Refraction seismic only works if the speed at which motions propagate through the Earth increases with depth. Reflection seismic methods can work no matter how the speed at which motions propagate through the Earth varies with depth. Refraction seismic observations are generally interpreted in terms of layers. These layers can have dip and topography. Reflection seismic observations can be more readily interpreted in terms of complex geology. Refraction seismic observations only use the arrival time of the initial ground motion at different distances from the source (i.e., offsets). Reflection seismic observations use the entire reflected wavefield (i.e., the time-history of ground motion at different distances between the source and the receiver). A model for the subsurface is constructed by attempting to reproduce the observed arrival times. The subsurface is directly imaged from the acquired observations. A s you can see from the above list, the reflection technique has the potential for being more powerful in terms of its ability to generate interpretable observations over complex geologic structures. As stated before, however, this comes at a cost. This cost is primarily economic. Reflection surveys are more expensive to conduct than refraction surveys. As a consequence, environmental and engineering concerns generally opt for performing refraction surveys when possible. On the other hand, the petroleum industry uses reflection seismic techniques almost to the exclusion of other geophysical methods. In this set of notes, we will only consider seismic refraction methods. SOURCE-GEOPHONE ARRAYS I n planning seismic refraction survey, the field arrangement of the seismic shots and detectors is determined by a number of factors such as the geologic problem involved, the terrain, and the available facilities (Dobrin, 1974). The layout in which the seismic source and the geophones are laid along a straight line (i. e., in-line spread or profile shooting) offer many conveniences, such as ease of surveying, convenient field operations, especially with handling geophone cables, and ease of interpretation of the acquired field data (Palmer, 1986). T here are three types of profiling for the in-line seismic refraction shooting: i - Reversed profiles, consisting of a group of geophones bounded by two seismic shots (Fig. a). ii - Split profiles, consisting of one seismic shot in the middle of two groups of geophones (Fig. b). iii - Offset profiles, consisting of one seismic shot offset with different distances on both sides of a group of geophones (Fig. c). Fig. : Types of in-line seismic refraction shooting (a) Reversed profile, (b) Split profile, and (c) Offset profile. Equipment Overview Compared to the equipment used for gravity and magnetic and even resistivity surveying, the amount and complexity of the equipment used in seismic surveying can be staggering. Due to the complexity of the equipment (which stems from the complexity of the field surveys we would like to employ), seismic surveying can become logistically very intensive. Typical seismic acquisition systems consist of the following components. Seismic Source - This is nothing more than an apparatus for delivering seismic energy into the ground. Sources can vary greatly in their size and complexity. All, however, share the following characteristics: They must be repeatable. That is, the nature of the energy delivered into the ground (its amount and the time duration over which it is delivered) should not change as the source is used in different locations and Time of delivery must be controllable. We must be able to tell exactly when the source delivered its energy into the ground. In some cases, we can control the time of delivery. In others, we simply note the time the source delivered its energy. Geophones - These are devices capable of measuring ground motion generated by the seismic source. As we will describe later , these typically convert the ground motion into electrical signals (voltages) that are recorded by a separate device. Recording System - This actually consists of a number of components. In essence, this entire system does nothing more than store the ground motion detected by a number of geophones. This number could be quite large. Today, it is not unusual for oil exploration surveys to record ground motion detected by 1000's of seismometers at a time. In addition to recording ground motion, this system must also control the synchronization of the source. It consists of not only a "black box" to store information but also numerous electrical connections to the geophones and the source and usually a device to select subsets of the installed geophones to record. Seismic Sources Sources of seismic energy come in a variety of sizes and shapes. Virtually anything that impacts, or causes motion on, the surface of the earth will be a source of seismic energy. Unfortunately, most sources are uncontrollable, such as road traffic, wind (this causes noise by making bushes and trees move), aircraft, people walking, etc. For our experiments, we would like to control the source of the ground motion. In this discussion, we will restrict our examples to those sources most commonly used in near-surface (i.e., environmental and engineering) investigations. Three types of sources are most commonly used for both refraction and reflection investigations of the near surface. Impact Sources - Sources that generate seismic energy by impacting the surface of the Earth are probably the most common type employed. Although impact sources can be rather sophisticated in their construction, the most commonly used type of impact source is a simple sledgehammer. In this case, an operator does nothing more than swing the sledgehammer downward onto the ground. Instead of striking the ground directly, it is most common to strike a metal plate lying on the ground. The sledgehammer is usually connected to the recording system by a wire. The moment the sledgehammer strikes the plate, the recording system begins recording ground motion from the geophones. T he principle advantages to using a sledgehammer source are primarily Low Cost and Simple to operate and maintain. The principle disadvantages of this source are It can be difficult to assure that the source is operated in a repeatable fashion, Operation is manually strenuous, Source outputs relatively small amounts of seismic energy. Therefore, it can be difficult to record reliable observations at great distances, and Source outputs seismic energy that tends to be low frequency in nature (i.e. this source generates a lot of surface waves ). Gun Sources - Like impact sources, gun sources generate seismic energy by transferring the kinetic energy of a moving object into seismic energy. In this case, the moving object is a bullet or shot-gun slug. Some sources use blanks instead of bullets or slugs. In this case, energy is transferred from the column of air in the gun's barrel that is set in motion by the blank to the ground. The source shown to the left is a 9-gauge shotgun mounted on a wheeled vehicle. In this case, a 2-oz. steel slug is fired into the ground. Most gun sources are more compact than the source shown to the left. Like the sledgehammer, gun sources must also be connected to the recording system so that you can begin recording ground motion from the geophones at the instant the slug or shell hits the ground. The principle advantages of gun sources are Highly repeatable source, Energy imparted into the ground is larger than is possible from a sledgehammer, and Gun sources generally output higher-frequency energy. This helps to minimize surface wave generation. The principle disadvantages of gun sources are Safety, Equipment is more bulky and expensive than simple impact sources, and Getting permission (permitting) to use this source may be more difficult. Explosive Sources - Explosive sources can impart a large amount of seismic energy into the ground given their relatively small size. These sources can vary in size and type from small blasting caps and shotgun shells to larger, two-phase explosives. All explosive sources are triggered remotely by a devise known as a blasting box. The blasting box is connected to both the explosive and the recording system. At the moment the box detonates the explosive, it also sends a signal to the recording system to begin recording ground motion from the geophones. The principle advantages of explosive sources are Pound for pound, these types of sources impart the most amount of seismic energy into the ground of any of the sources described here, The energy tends to be very high frequency, and because the explosives are usually placed in a shallow borehole, it tends not to be contaminated by surface waves, and Explosive sources are very repeatable. The principle disadvantages of explosive sources are Safety, Permitting. Landowners tend to be nervous about allowing the use of explosives on their property, Data acquisition using explosive sources is much slower than using impact or gun sources. This is primarily because boreholes must be drilled within which the explosives are to be placed, and Explosives tend to be expensive to acquire and maintain. Geophones C ontrary to what you might think, geophones are remarkably simple (yet ingenious) devices. Like gravity meters , the active element of the device consists of a mass hanging on a spring. When the ground moves, the mass (because it has inertia) wants to remain motionless. If you were watching the seismometer as the ground moved, it would look like the mass itself was moving. But, in reality, you are moving with the ground, and the mass is remaining motionless*. Now for the part that I really consider igeneous. Wrapped around the mass is a strand of wire. Surrounding the wire-wrapped mass is a magnet that is fixed to the Earth. As the Earth moves, the magnet moves up and down around the mass. The magnetic field of this moving magnet produces an electrical voltage in the wire. This voltage can be amplified and recorded by a simple voltmeter. It is relatively easy to show that the voltage recorded by the voltmeter is proportional to the velocity (speed) at which the ground is moving**. Shown to the left is an example of a geophone that is representative of those typically used in seismic refraction and reflection work. A quarter is shown for scale. This particular seismometer has had its side cut out so that you can see its working parts. The wire- (copper wire in this case) wrapped mass can be clearly seen inside the geophone. The spring connecting the geophone to the case can not be seen but is just above the mass. The silver colored case just inside the blue plastic external case is magnetized. The black wires coming out from either side of the blue case transmit the variations in voltage to the recording system. The long silver spike below the blue case is used to firmly attach the geophone to the ground. This spike is pressed into the ground by stepping on the top of the geophone until it is completely buried. Different styles of geophone cases are available for use in different environments. Several examples are shown to the right. The geophone shown to the far right (the one without the spike), for example, is designed for use on hard surfaces into which spikes can not be pushed. Geophones used in exploration seismology are relatively inexpensive. Costs ranging from $75 to $150 per geophone are not uncommon. Although this cost per geophone is small, remember that many (1000's) of geophones may be used in the large reflection seismic surveys conducted for the petroleum industry. Near-surface investigations are typically much smaller in scale, both in terms of area covered and in terms of equipment needed. For a near-surface refraction survey, one could use as few as twelve or as many as a hundred geophones. Near-surface reflection surveys use only a moderately greater (24 to 150) amount of geophones at any one time. *Obviously, this is a simplification of what really happens. Because the spring is not perfectly compliant, the mass does in fact move when the Earth moves. It moves in a very complex fashion that can be relatively easily quantified. For our purposes, however, we can make the assumption that the mass remains motionless without loss of generalization. **This type of geophone was first invented in 1906 by a prince of the Russian empire by the name of B. B. Galitizin. Sources of Noise As with all geophysical methods, a variety of noises can contaminate our seismic observations. Because we control the source of the seismic energy, we can control some types of noise. For example, if the noise is random in occurrence, such as some of the types of noise described below, we may be able to minimize its affect on our seismic observations by recording repeated sources all at the same location and averaging the result. We've already seen the power of averaging in reducing noise in the other geophysical techniques we have looked at. Beware, however, that averaging only works if the noise is random. If it is systematic in some fashion, no amount of averaging will remove it. The noises that plague seismic observations can be lumped into three catagories depending on their source. Uncontrolled Ground Motion - This is the most obvious type of noise. Anything that causes the ground to move, other than your source, will generate noise. As you would expect, there could be a wide variety of sources for this type of noise. These would include traffic traveling down a road, running engines and equipment, and people walking. Other sources that you might not consider include wind, aircraft, and thunder. Wind produces noise in a couple of ways but of concern here is its affect on vegetation. If you are surveying near trees, wind causes the branches of the trees to move, and this movement is transmitted through the trees and into the ground via the trees' roots. Aircraft and thunder produce noise by the coupling of ground motion to the sound that we hear produced by each. Electronic Noise - As you've already seen , geophones convert the ground motion they detect to electrical signals. These signals are then transmitted down the cable, amplified by the recording system, and recorded. Thus, anything that can cause changes in the electrical signal in the cable or the recording system causes noise in our recorded data. Electrical noise can come from a variety of sources. For example, dirty or loose connections between the geophones and the cable or the cable and the recording system can produce noise. Wet connections anywhere in the system can cause electrical noise. Wind can also cause electrical noise. This occurs if, for example, the cable is suspended in bushes. As the wind blows the bushes, this moves the cable. The c able is nothing more than a long electrical conductor. As it moves in the Earth's magnetic field, an electrical current is produced in the cable. Geologic Noise - Finally, we can consider any type of subsurface geologic structure that we can not easily interpret to be a source of noise. In seismic refraction surveying, we will assume that the subsurface structure varies laterally only along the line connecting the source to the geophones. If the Earth actually varies significantly away from our line, it is possible for us to misinterpret the seismic waves we record as structure below the geophones instead of structure to the side of the geophones. Like our resistivity observations, we will interpret our seismic observations as if they had been generated from relatively simple earth models. Although these models can be more complex than those used to interpret resistivity observations (we can have dipping layers and topography on the layers), in interpreting refraction seismic observations we must assume that variations occur along the line in which data is collected only. http://dc153.4shared.com/doc/vV__vKWb/preview.html
SEG(美国勘探地球物理学家学会)推出了SEG 维基(SEG Wiki)。大家有兴趣可以访问 wiki.seg.org 网站,肯定对大家有帮助的。SEG维基有以下4个特点: SEG has launched the new SEG Wiki—An Encyclopedia for Applied Geophysics . Breaking new ground in the geosciences industry, the SEG Wiki is a designed to serve up technical content to meet the needs of researchers worldwide. Go to wiki.seg.org to experience these four benefits of the SEG Wiki. The SEG Wiki is a simple, intuitive research tool Navigating through the SEG Wiki is a snap. With consistent navigation links and a handful of contextual "Toolbox" links to help you drill down, the SEG Wiki makes it easy to uncover valuable information. And when the general navigation doesn't get you where you want to go quickly enough, opt for the Wiki's intuitive Search tool. The SEG Wiki focuses exclusively on geosciences topics The SEG Wiki is the first true Wiki that is devoted exclusively to the geosciences. As you browse, there is no need to weave and dodge through irrelevant topics and commentary. The SEG Wiki is committed to providing only focused, pertinent geophysical content. The SEG Wiki is moderated by your peers The SEG Wiki is moderated by members of the geosciences community. SEG President Bob Hardage notes: "The SEG Online Committee developed the vision for this outstanding resource, establishing from its ranks an Online Technical Content Board to steward the project and team with SEG's IT staff to make it happen." Moderators and members of the SEG Online Committee are charged with protecting the valuable information housed in the Wiki, creating a safe browsing environment of legitimacy and integrity. The SEG Wiki is populated by your peers…and Sheriff's Encyclopedic Dictionary The SEG Wiki is a member-content-driven resource site. While its foundational content is built on the foundation of the Encyclopedic Dictionary of Applied Geophysics by Robert Sheriff, continued content contributions come directly from members of and subject matter experts in the geophysical community. "The new SEG Wiki an opportunity for all SEG members to contribute their specialized technical knowledge in a quickly accessible format to the entire SEG Community," said Bill Dragoset, SEG Online Technical Content Board Chairman. Its content is as current as the last commentary posted. Apache Corporation has made a five year, US $250,000 commitment to support the ongoing development of the SEG Wiki. Mike Bahorich, Apache's executive vice president/chief technology officer notes: "Apache started down the path of developing an internal EP Wiki but firmly believes that the natural owners are professional societies. Congratulations to SEG for being the first among the EP-focused societies to have a working wiki. We are pleased to support ongoing development." After spending even a short amount of time on the SEG Wiki, you'll surely be able to add to this list of benefits. Point your browser to the SEG Wiki today at wiki.seg.org .
Offshore staff SYDNEY, Australia – China’s State Oceanic Administration has approved the Environmental Impact Assessment (EIA) for the Beibu Gulf project in the South China Sea. This allows work to start on development of the WZ 6-12 and WZ 12-8 West oil fields . However, the partners await final approval for sanction of the project by the National Development and Reform Commission. Fabrication activities are under way and offshore pipeline installation should start in March. Platform installation should be completed before mid-year, at which point a campaign of four exploration/appraisal wells will begin, to be followed by development drilling. CNOOC anticipates first oil from the Beibu Gulf project by end-2012, building to peak production during 2013. The partners are: CNOOC (51%); Roc Oil (19.60%); Horizon Oil (14.70%); Petsec Petroleum (12.25%); and Oil Australia (2.45%). 2/27/2012 http://www.offshore-mag.com/articles/2012/02/china-sea-oil-field-development.html
March 8, 2012 http://www.ed.gov/news/speeches/new-platform-learning My wife and two children are pretty amused that I have been invited to talk about technology at a cutting-edge conference for innovators and entrepreneurs. I admit that I grew up in a technologically-challenged household. We didn’t even have a television when I was a kid. We were not what you would call early-adopters. But I’ve changed—and the reason I’ve changed is that I’ve seen the tremendous transformational potential of technology in education. I really believe that technology is a game-changer in the field of education in so many ways. It is making us so much more efficient. It allows teachers to personalize education for more and more students. They can track student progress more closely. Technology offers children the opportunity to work at their own pace and provides access to more information through a cell phone than I had through an entire library. Technology enables working adults to learn on their own schedule. It erases geographical barriers to knowledge. Technology is replacing the paper and pencil, the textbook, the chalk board and the globe in the corner of the room. It will soon replace the bubble test on which our accountability system is based. It’s no exaggeration to say that technology is the new platform for learning. Technology isn’t an option that schools may or may not choose for their kids. Technological competency is a requirement for entry into the global economy – and the faster we embrace it – the more we maintain and secure our economic leadership in the 21st century. Fortunately, there are progressive educators in school systems all across America who are finding bold and creative new ways to use technology in the classroom. Just this week, Mark Edwards, the superintendent from Mooresville, North Carolina came to the department to meet with our senior staff. Three years ago, he gave every student in 4th through 12th grade a laptop. Almost overnight they saw gains in school attendance – new forms of collaboration between teachers and students -- and ultimately gains in reading, math and graduation rates. Rather than the kind of whole school instruction that has been common in public education for more than a century – his students now work in small groups and independently pursue areas of interest. He describes his teachers as “roaming conductors” -- circulating around the room reviewing work, challenging students, and answering questions – one-on-one. The parents can track student progress every night from home -- and that’s one reason that the community strongly supported an increase in local taxes to keep the program going. And the cost was not prohibitive – about $225 dollars per student per year. For a decade now, the State of Maine has also given every middle school student a laptop. The Open High School in Utah has completely switched to digital content and they are in the process of providing every student in grades 6-12 with a laptop. In Florida, close to 100,000 students attend virtual schools. Idaho is the first state in the country to require students to get at least two high school credits through on-line courses and they are phasing in laptops for all high school students and teachers. And at the School of One in New York, there are 80 students sitting in a math class working in small groups, large groups or as individuals. Several teachers roam the classroom offering individualized support to the kids. We gave them a grant so they can continue this work and expand it. We’re doing much more to encourage technology in the classroom. In 2010, we issued a comprehensive Education Technology Plan to support the broader trends in education today: Aligning learning materials with the college and career-ready standards that states have developed and adopted. Engaging students by tailoring learning to their needs and interests and providing real-time information to teachers about student learning. Connecting teachers with their peers so they can share learning materials and classroom strategies. Building the infrastructure to support this learning environment and using technology to become more productive. Karen Cator led the development of this plan and she spoke here yesterday. She served in public education for many years and then spent time at Apple. I hope you have an opportunity to talk with her or meet with her because she is eager to bring your ideas to the larger education community. The list of panels at this conference is evidence of the ambition and creativity of the movement to bring technology into the classroom. It focused on assessment and digital ethics. You are talking about supporting teenage entrepreneurs and using interactive art to enhance math education. Some of you are using game design to improve STEM education. And here’s a panel that is bound to raise a few eyebrows: “Supersizing the Classroom – 3000 Students and Beyond.” Now, I must say that I was relieved to see that this was not about pre-school but is in fact about how to improve those dreaded survey courses in college. Clearly, there is a lot of creative thinking happening here and I just want to say that the education community is hungry for your ideas. Educators want the best for their kids. K-12 education is a $650 billion dollar industry in America. Higher education puts the education sector well over a trillion dollars. Unlike in many other nations, however, America education is decentralized. We have 15,000 school districts and 95,000 public schools independently deciding how to teach and in many cases what to teach. That’s one of the strengths of our system and a source of innovation. But decentralization can also complicate the spread of technology. I know that some of you have encountered bureaucratic obstacles in your efforts to work with school systems. Please don’t be discouraged. School leaders are under a lot of pressure today to cope with diminishing resources and rising expectations. They don’t always see how investments in technology can save money down the road. Thankfully, we have partnership like one with former West Virginia Governor Bob Wise and former Florida Governor Jeb Bush who are pushing states to have more tech-friendly policies. So -- just keep doing what you’re doing -- and we will do all we can at the federal level to support the use of technology in education. Let me tell you some of the things we are doing already. First of all, the President is deeply committed to STEM education. His goal is to create an education system that produces more people like you – with the creativity and technical skills -- not only to invent new educational programs and software -- but to help us lead in every other field. We’ve created a learning registry to help teachers and parents discover resources on-line and learn from each other. We have made technology a priority in competitive programs like Race to the Top. And as a nation we have invested heavily over the last 20 years. The E-Rate program generated billions of dollars to upgrade technology infrastructure and today – virtually every school in America has some form of internet access. Through the Recovery Act – the Commerce Department, Department of Agriculture and the Federal Communications Commission expanded broadband services to thousands of additional communities with the plan to connect them all by 2015. Now the FCC is working with providers to support access to low-income children in their homes to help close the digital divide. Insuring educational equity is at the heart of the federal role in education. That is why Congress passed the Elementary and Secondary Act in 1965. Today, our two biggest pots of money target low-income students and students with disabilities – and both of them allow for investments in technology. In higher education, our biggest pot of money is for Pell grants so low-income students can go to college. We’ve gone from about 6 million Pell grants to 9 million Pell grants in the last three years and our community colleges are bursting at the seams. The only way to serve more students is by leveraging technology in innovative ways. In so many ways, technology is a powerful force for educational equity. It can even the playing field instead of tilting it against low-income, minority and rural students – who may not have laptops and i-phones at home. It gives a boost to students with disabilities and students learning to speak English. It opens doors for all students as long as we make sure that the students most in need have access. And it helps teachers working in our toughest schools with our most disadvantaged students by providing them with effective lesson plans and teaching strategies that match their needs. It gives teachers the kind of professional development they have been asking for – individualized to their unique needs. Today, DC and Tennessee are both using technology to create customized teacher training programs. It gives teachers the information they need to figure out what kids need. Unfortunately, assessment in education is behind every other field from medicine to consumer behavior to sports, politics and entertainment. Everyone is getting data in real time and using it to make decisions. Education needs to step up. Ultimately, technology should make a teacher’s jobs easier – and that will make them more effective. We talked to some teachers in a school system that just brought in new technology two months ago and they were already raving about how much time it saves. They said their students are much more engaged. Young people see adults working in front of computers. They know that’s the future. The more that our classrooms mimic the real world, the more likely that our kids will take school seriously. A new Canadian study confirms what we already know intuitively: when technology actively engages students it has a dramatic and positive impact on student performance. Superintendent Mark Edwards from Mooresville, North Carolina also talked about the sense of discovery that his students feel —that they go on-line and talk to someone in another state or another country. With just one click, they go way beyond the walls of their classroom and the pages of their textbooks. Technology-driven learning empowers students and gives them control of the content. It challenges them to think critically and make decisions – the same kinds of challenges you and I face in our work every day. And college students who are struggling with the rising costs of college can get more and more of their material through open education resources saving thousands of dollars over the course of their college career. Along with the Department of Labor, we have a new partnership between community colleges and business to fund the creation of new curriculum for growing fields like health care and green energy – and all of the curriculum that is created will be open-source and publicly available. I recognize that I’m preaching to the choir. Entrepreneurs like you are way ahead of the curve. People like Sal Kahn has made over 2700 learning videos available for free. Products like the ones you all are showcasing here hold the potential to transform classrooms. University partners like MIT, Yale, Tufts and the University of California are doing the same. Learning technology can be a major export industry for America. But don’t think that other countries aren’t thinking about it. Places like China, India, Brazil and Israel are all pushing hard to bring technology into the classroom and create the products that will shape the future of education. American entrepreneurs like you – in partnerships with the kind of teachers we have in this room today -- need to own and lead the field – just as we have in so many other fields. So I’m here today – not just to encourage you – but to plead with you – to invest in education and in the technologies that support learning – to push us and push the field to move in this direction – and to be our full partner in the broader effort to rebuild the American economy with education as the foundation. Now – I also want to leave you with one final thought because this issue too often gets sidetracked into a silly debate over whether we need computers or teachers -- when everyone knows we need both. Next week, thousands of America’s finest musicians -- guitar players, drummers, horn players and singers -- will flood the City of Austin in an annual celebration of cutting-edge music and creativity. Young people from colleges and communities across America will come to watch, talk, dance, and have fun. They’ll have cell phones, i-pads, laptops, and other tools to communicate, socialize, and gather. They’ll see it live and watch on-line. The performers will chronicle their every move on social media. Musicians today use technology in countless ways to get their shot at stardom here at South by Southwest. They download music and create band profiles on the web. They record, share and sell their music without ever leaving their bedrooms. Technology corrects their mistakes in the studio. In fact, the music industry and other art forms like film and photography are so completely infused with technology today – and dependent on it -- that it is hard to imagine them without it. Today, technology pretty much does everything for the musician except for one fundamental thing: It can’t write a song. We have yet to invent a technology that will produce “Born to Run” or “Let it Be.” Even if Beethoven had a computer, the Fifth Symphony would still have come from that mysterious gray matter between his ears – and it’s important to remember that as we think about the role technology plays in education. It’s a tool to help children learn and help teachers teach. It’s a tool to help parents stay abreast of what their children are learning. It’s a tool to hold ourselves and each other accountable – so that we can get better and smarter. At the end of the day – education and technology are about people and ideas. Why is Facebook so popular? Because it brings people together. Why is technology so exciting? Because it tells us so much about ourselves and about others. Why are we here in Austin? (Aside from Texas BBQ!) You could have found a lot of this information without coming to South by Southwest. But you’re here because there is no substitute for face-to-face interaction. Nothing can replace the conversation that leads to inspiration or the handshake that leads to a partnership. The future of American education undoubtedly includes a laptop on every desk and universal internet access in every home. It definitely includes more on-line learning. But a great teacher at the front of the classroom will still make the biggest difference in the lives of our students. All of us can point to a great teacher who inspired us and shaped our lives. So I urge you today to make teachers your partners and your advocates. Their voice carries a long way. They are the ones who will take your product from the drawing board to the classroom. They are the only ones who can make this work. Working together, entrepreneurs and educators like all of you here today can create a world that we can’t even imagine. Our kids are begging for it. They can’t wait. America can’t wait. Thank you.
About 10 miles off the Santa Barbara coast, at the bottom of the Santa Barbara Channel, a series of impressive landmarks rise from the sea floor.They've been there for 40,000 years, but have remained hidden in the murky depths of the Pacific Ocean--until now. They're called asphalt volcanoes. Scientists funded by the National Science Foundation (NSF) and affiliated with the University of California at Santa Barbara (UCSB), the Woods Hole Oceanographic Institution (WHOI), University of California at Davis, University of Sydney and University of Rhode Island, have identified the series of unusual volcanoes Diagram showing formation of an asphalt volcano and associated release of methane and oil. .WHOI Image A slab from an asphalt volcano discovered on the sea-floor of the Santa Barbara Channel. Image by Oscar Pizarro, University of Sydney. http://geology.com/press-release/asphalt-volcanoes/
The mathematics of taste By using ‘genetic programming’ to crossbreed algorithms, researchers help flavor companies figure out what their customers like. The design of aromas — the flavors of packaged food and drink and the scents of cleaning products, toiletries and other household items — is a multibillion-dollar business. The big flavor companies spend tens of millions of dollars every year on research and development, including a lot of consumer testing. But making sense of taste-test results is difficult. Subjects’ preferences can vary so widely that no clear consensus may emerge. Collecting enough data about each subject would allow flavor companies to filter out some of the inconsistencies, but after about 40 flavor samples, subjects tend to suffer “smell fatigue,” and their discriminations become unreliable. So companies are stuck making decisions on the basis of too little data, much of it contradictory. One of the biggest flavor companies in the world has turned to researchers in MIT’s Computer Science and Artificial Intelligence Laboratory (CSAIL) for help. To analyze taste-test results, the CSAIL researchers are using genetic programming, in which mathematical models compete with each other to fit the available data and then cross-pollinate to produce models that are more accurate still. The Swiss flavor company Givaudan asked CSAIL principal research scientist Una-May O’Reilly, postdoc Kalyan Veeramachaneni and the University of Antwerp’s Ekaterina Vladislavleva to help interpret the results of tests in which 69 subjects evaluated 36 different combinations of seven basic flavors, assigning each a score according to its olfactory appeal. For each subject, O’Reilly and her colleagues randomly generate mathematical functions that predict scores according to the concentrations of different flavors. Each function is assessed according to two criteria: accuracy and simplicity. A function that, for example, predicts a subject’s preferences fairly accurately using a single factor — say, concentration of butter — could prove more useful than one that yields a slightly more accurate prediction but requires a complicated mathematical manipulation of all seven variables. After all the functions have been assessed, those that provide poor predictions are winnowed out. Elements of the survivors are randomly recombined to produce a new generation of functions; those are then evaluated for accuracy and simplicity. The whole process is repeated about 30 times, until it converges on a set of functions that accord well with the preferences of a single subject. Because O’Reilly and her colleagues’ method produces profiles of individual test subjects’ tastes, it can sort them into distinct groups. It could be, for instance, that test subjects tend to have strong preferences for either cinnamon or nutmeg but not both. By marketing one product to cinnamon lovers and another to nutmeg lovers, a company could do much better than by marketing one product to both. “For every one of these 36 flavors, someone hated it and someone liked it,” O’Reilly says. “If you try to identify a flavor that the whole panel likes, you end up settling for a little bit less.” O’Reilly and her colleagues haven’t had an opportunity to empirically determine whether their models correctly predict subjects’ responses to new flavors. So to try to establish their model’s accuracy, they instead built another model. First, they developed a set of mathematical functions that represent subjects’ true taste preferences. Then they showed that, given the limitations of particular test designs, their algorithms could still divine those preferences. Although they developed the model purely to validate their approach, O’Reilly says, flavor researchers were intrigued by the possibility of using it to develop more accurate and efficient test protocols. “People have been playing with these techniques for decades,” says Lee Spector, a professor of computer science at Hampshire College and editor-in-chief of the journal Genetic Programming and Evolvable Machines , where the MIT researchers’ latest paper appears. “One of the reasons that they haven’t made a big splash until recently is that people haven’t really figured out, I think, where they can pay off big.” Taste preference, Spector says, “is a pretty brilliant area in which to apply the evolutionary methods — and it looks as though they’re working, also, so that’s exciting.” http://web.mit.edu/newsoffice/2012/what-smells-good-0124.html
圆圈内是北极地区拥有石油和天然气资源的区域 The Arctic holds an estimated 13% (90 billion barrels) of the world's undiscovered conventional oil resources and 30% of its undiscovered conventional natural gas resources, according to an assessment conducted by the U.S. Geological Survey (USGS). Consideration of these resources as commercially viable is relatively recent despite the size of the Arctic's resources due to the difficulty and cost in developing Arctic oil and natural gas deposits. Studies on the economics of onshore oil and natural gas projects in Arctic Alaska estimate costs to develop reserves in the region can be 50-100% more than similar projects undertaken in Texas. Profitable development of Arctic oil and natural gas deposits could be challenging due to the following factors: Equipment needs to be specially designed to withstand the frigid temperatures. On Arctic lands, poor soil conditions can require additional site preparation to prevent equipment and structures from sinking. Long supply lines and limited transportation access from the world's manufacturing centers require equipment redundancy and a larger inventory of spare parts to ensure reliability, while increasing transportation costs. Employees expect higher wages and salaries to work in the isolated and inhospitable Arctic. Natural gas hydrates can pose operational problems for drilling wells in both onshore and offshore Arctic areas. Natural gas development could be especially challenging. Although the Arctic is rich in natural gas, the development of Arctic natural gas resources could be impeded by the low market value of natural gas relative to that of oil. Furthermore, natural gas consumers live far from the region, and transportation costs of natural gas are higher than those for oil and natural gas liquids. Overlapping and disputed claims of economic sovereignty between neighboring jurisdictions also could be an obstacle to developing Arctic resources. The area north of the Arctic Circle is apportioned among eight countries—Canada, Denmark (Greenland), Finland, Iceland, Norway, Russia, Sweden, and the United States. Under current international practice, countries have exclusive rights to seabed resources up to 200 miles beyond their coast, an area called an Exclusive Economic Zone (EEZ). Beyond the EEZ, assessments of "natural prolongation" of the continental shelf may influence countries' seabed boundaries. Along with economic and political challenges, environmental stewardship and regulatory permitting may also affect timelines for exploration and production of Arctic resources. Environmental issues include the preservation of animal and plant species unique to the Arctic, particularly tundra vegetation, caribou, polar bears, seals, whales, and other sea life. The adequacy of existing technology to manage offshore oil spills in an arctic environment is another unique challenge. Spills among ice floes can be much more difficult to contain and clean up than spills in open waters. The Arctic holds an estimated 13% (90 billion barrels) of the world's undiscovered conventional oil resources and 30% of its undiscovered conventional natural gas resources, according to an assessment conducted by the U.S. Geological Survey (USGS). Consideration of these resources as commercially viable is relatively recent despite the size of the Arctic's resources due to the difficulty and cost in developing Arctic oil and natural gas deposits. Studies on the economics of onshore oil and natural gas projects in Arctic Alaska estimate costs to develop reserves in the region can be 50-100% more than similar projects undertaken in Texas. Profitable development of Arctic oil and natural gas deposits could be challenging due to the following factors: Equipment needs to be specially designed to withstand the frigid temperatures. On Arctic lands, poor soil conditions can require additional site preparation to prevent equipment and structures from sinking. Long supply lines and limited transportation access from the world's manufacturing centers require equipment redundancy and a larger inventory of spare parts to ensure reliability, while increasing transportation costs. Employees expect higher wages and salaries to work in the isolated and inhospitable Arctic. Natural gas hydrates can pose operational problems for drilling wells in both onshore and offshore Arctic areas. Natural gas development could be especially challenging. Although the Arctic is rich in natural gas, the development of Arctic natural gas resources could be impeded by the low market value of natural gas relative to that of oil. Furthermore, natural gas consumers live far from the region, and transportation costs of natural gas are higher than those for oil and natural gas liquids. Overlapping and disputed claims of economic sovereignty between neighboring jurisdictions also could be an obstacle to developing Arctic resources. The area north of the Arctic Circle is apportioned among eight countries—Canada, Denmark (Greenland), Finland, Iceland, Norway, Russia, Sweden, and the United States. Under current international practice, countries have exclusive rights to seabed resources up to 200 miles beyond their coast, an area called an Exclusive Economic Zone (EEZ). Beyond the EEZ, assessments of "natural prolongation" of the continental shelf may influence countries' seabed boundaries. Along with economic and political challenges, environmental stewardship and regulatory permitting may also affect timelines for exploration and production of Arctic resources. Environmental issues include the preservation of animal and plant species unique to the Arctic, particularly tundra vegetation, caribou, polar bears, seals, whales, and other sea life. The adequacy of existing technology to manage offshore oil spills in an arctic environment is another unique challenge. Spills among ice floes can be much more difficult to contain and clean up than spills in open waters. http://www.eia.gov/todayinenergy/detail.cfm?id=4650
据MIT新闻网站报道,MIT的科学家研究出比FFT更快的傅立叶变换算法。 The Fourier transform is one of the most fundamental concepts in the information sciences. It’s a method for representing an irregular signal — such as the voltage fluctuations in the wire that connects an MP3 player to a loudspeaker — as a combination of pure frequencies. It’s universal in signal processing, but it can also be used to compress image and audio files, solve differential equations and price stock options, among other things. The reason the Fourier transform is so prevalent is an algorithm called the fast Fourier transform (FFT), devised in the mid-1960s, which made it practical to calculate Fourier transforms on the fly. Ever since the FFT was proposed, however, people have wondered whether an even faster algorithm could be found. At the Association for Computing Machinery’s Symposium on Discrete Algorithms (SODA) this week, a group of MIT researchers will present a new algorithm that, in a large range of practically important cases, improves on the fast Fourier transform. Under some circumstances, the improvement can be dramatic — a tenfold increase in speed. The new algorithm could be particularly useful for image compression, enabling, say, smartphones to wirelessly transmit large video files without draining their batteries or consuming their monthly bandwidth allotments. Like the FFT, the new algorithm works on digital signals. A digital signal is just a series of numbers — discrete samples of an analog signal, such as the sound of a musical instrument. The FFT takes a digital signal containing a certain number of samples and expresses it as the weighted sum of an equivalent number of frequencies. “Weighted” means that some of those frequencies count more toward the total than others. Indeed, many of the frequencies may have such low weights that they can be safely disregarded. That’s why the Fourier transform is useful for compression. An eight-by-eight block of pixels can be thought of as a 64-sample signal, and thus as the sum of 64 different frequencies. But as the researchers point out in their new paper, empirical studies show that on average, 57 of those frequencies can be discarded with minimal loss of image quality. Heavyweight division Signals whose Fourier transforms include a relatively small number of heavily weighted frequencies are called “sparse.” The new algorithm determines the weights of a signal’s most heavily weighted frequencies; the sparser the signal, the greater the speedup the algorithm provides. Indeed, if the signal is sparse enough, the algorithm can simply sample it randomly rather than reading it in its entirety. “In nature, most of the normal signals are sparse,” says Dina Katabi, one of the developers of the new algorithm. Consider, for instance, a recording of a piece of chamber music: The composite signal consists of only a few instruments each playing only one note at a time. A recording, on the other hand, of all possible instruments each playing all possible notes at once wouldn’t be sparse — but neither would it be a signal that anyone cares about. The new algorithm — which associate professor Katabi and professor Piotr Indyk, both of MIT’s Computer Science and Artificial Intelligence Laboratory (CSAIL), developed together with their students Eric Price and Haitham Hassanieh — relies on two key ideas. The first is to divide a signal into narrower slices of bandwidth, sized so that a slice will generally contain only one frequency with a heavy weight. In signal processing, the basic tool for isolating particular frequencies is a filter. But filters tend to have blurry boundaries: One range of frequencies will pass through the filter more or less intact; frequencies just outside that range will be somewhat attenuated; frequencies outside that range will be attenuated still more; and so on, until you reach the frequencies that are filtered out almost perfectly. If it so happens that the one frequency with a heavy weight is at the edge of the filter, however, it could end up so attenuated that it can’t be identified. So the researchers’ first contribution was to find a computationally efficient way to combine filters so that they overlap, ensuring that no frequencies inside the target range will be unduly attenuated, but that the boundaries between slices of spectrum are still fairly sharp. Zeroing in Once they’ve isolated a slice of spectrum, however, the researchers still have to identify the most heavily weighted frequency in that slice. In the SODA paper, they do this by repeatedly cutting the slice of spectrum into smaller pieces and keeping only those in which most of the signal power is concentrated. But in an as-yet-unpublished paper , they describe a much more efficient technique, which borrows a signal-processing strategy from 4G cellular networks. Frequencies are generally represented as up-and-down squiggles, but they can also be though of as oscillations; by sampling the same slice of bandwidth at different times, the researchers can determine where the dominant frequency is in its oscillatory cycle. Two University of Michigan researchers — Anna Gilbert, a professor of mathematics, and Martin Strauss, an associate professor of mathematics and of electrical engineering and computer science — had previously proposed an algorithm that improved on the FFT for very sparse signals. “Some of the previous work, including my own with Anna Gilbert and so on, would improve upon the fast Fourier transform algorithm, but only if the sparsity k” — the number of heavily weighted frequencies — “was considerably smaller than the input size n,” Strauss says. The MIT researchers’ algorithm, however, “greatly expands the number of circumstances where one can beat the traditional FFT,” Strauss says. “Even if that number k is starting to get close to n — to all of them being important — this algorithm still gives some improvement over FFT.” 引自: http://web.mit.edu/newsoffice/2012/faster-fourier-transforms-0118.html
Columbia University recently announced plans to offer a course next semester in which students can study and participate in the movement. The class will be offered through the anthropology department and will be taught by Dr. Hannah Appel, a veteran of the movement. It is called “Occupy the Field: Global Finance, Inequality, Social Movement.” Upperclassmen and graduate students will be able to take the class. “Class requirements will be divided between seminar at Columbia and fieldwork in and around the Occupy movement,” according to the class syllabus. “In addition to scheduled seminar , this class will meet off-campus several times, and students will be expected to be involved in ongoing OWS projects outside of class, to be developed in close conversation with the instructor.” Could this type of class be dangerous for the students who will be involved in it? Appel thinks not. “As a regular participant in the Occupy movement… I can say with absolute certainty that there is no foreseeable risk in teaching this as a field-based class,” she said. She also encourages students not to break the law when they are conducting their fieldwork though, because then there could be problems http://www.eduinreview.com/blog/2012/01/columbia-university-offers-course-allowing-students-to-participate-in-occupy-wall-street/
法国摄影师 Vincent J. Stoker的作品中呈现的废墟,看似不存在却真实存在的世界。他在诠释一些地方,一些本质上的不存在的地方,一些被忽视,被遗失他们本来意义价值和作用的地方,一些不存在于我们日常生活中的美妙的地方。他们奇妙的存在着。这些地方掺杂着于生与死,生机盎然与被遗弃,人类与非人类,这些濒临遗忘和毁灭的异托邦。他们被时间沉淀, 负载着时间的痕迹。过去和未来在当下撞击的火花。 地点 : HETEROTOPIA - 异托邦 是一个现实和虚幻并存的地方. 法国摄影师 Vincent J. Stoker的作品
2011年12月美国著名沉积学家鲍马在得克萨斯州去世,享年79岁。以他名字命名的“鲍马层序”闻名于世。 Complete Bouma sequence in Devonian Sandstone (Becke-Oese, Germany ) http://en.wikipedia.org/wiki/Bouma_sequence Researcher, educator and AAPG Sidney Powers Medalist Arnold H. Bouma died Friday in Frisco, Texas. He was 79. A native of Groningen, The Netherlands, he received his bachelor’s from the State University in Groningen, a masters at State University at Utrecht in geology, sedimentology and paleontology in 1959 and a Ph.D. in sedimentary geology in 1961. His doctoral dissertation, titled “Sedimentology of Some Flysch Deposits: A Graphic Approach to Facies Interpretation,” was published and widely distributed in 1962 and set off numerous laboratory and field research studies and formed the basis of what eventually came to be known in the field as “the Bouma Sequence” – which has been called a “geological milestone of the 20th century.” In 1962, he accepted a Fulbright post-doctoral fellowship at the Scripps Institute of Oceanography in La Jolla, Calif., and in 1966, Bouma immigrated to America with his family to accept an academic post in oceanography at Texas AM University. He taught there until 1975, when he was asked to join the U.S. Geological Survey, initially in the Pacific-Arctic branch and then in the Atlantic-Gulf of Mexico branch. In 1981, he joined Gulf Oil as a senior scientist and working his way up to chief scientist and acting vice president for Gulf Research and Development Co. When Gulf Oil was purchased by Chevron in 1985, Bouma assumed the position of senior research associate with Chevron Oil Field Research Co. Bouma returned to the academic world in 1988 when he was named Charles T. McCord Professor of Geology and Geophysics at Louisiana State University at Baton Rouge. There he taught and served for a few years as director of the Basin Research Institute and head of the School of Geosciences. He retired in 2005. Back in Texas, Bouma became an adjunct professor in the Department of Geology and Geophysics at Texas AM. A 49-year member of AAPG, Bouma was a Charter Member of the Division of Environmental Geosciences, a member of the Division of Professional Affairs, served on the Publications, Education and Marine Geology committees and as an AAPG Distinguished Lecturer. A memorial service will be held at 11:00A.M., Wednesday, December 21, 2011 at Aria Memorial Chapel, 19310 Preston Road Dallas, TX 75252. In lieu of flowers, the family requests any memorials to be sent in honor of Arnold Bouma to the SEPM Foundation endowment fund. http://www.aapg.org/explorer/2011/12dec/bouma_arnold1211.cfm Arnold H. Bouma 简历( http://geoweb.tamu.edu/profile/abouma ) Dr. Arnold Bouma Adjunct Professor 1959-1961 Ph.D. Sedimentary Geology, State University, Utrecht, The Netherlands 1956-1959 M.S. Geology, Sedimentology, Paleontology, State University, Utrecht, The Netherlands 1951-1956 B.S. Geology, State University, Groningen, The Netherlands Bio Arnold H. Bouma received his Ph.D. degree in 1961 at the University of Utrecht, The Netherlands. He and his family emigrated in 1966 to the United States of America to join the Department of Geological Oceanography at Texas AM University. After his stay in College Station he broadened his knowledge in 1975 working for the U.S. Geological Survey. In 1981 he went to the oil industry (Gulf Oil, and later Chevron). In 1988 he moved to Louisiana State University. He returned to Texas AM in 2005 to the department of Geology (retired and busy). Dr. Bouma's main scientific interest is in sedimentary geology with emphasis on deep-water depositional environments. He is currently developing a Center for Shale Studies at Texas AM, which will be worldwide. Research Interests Develop criteria to identify detectable characteristics for the various zones of fine-grained submarine fans in outcrop and in de-compacted equivalents Siltstones, mud-stones and shales from different depositional environments Ancient and resent sediments in marine depositional environments with emphasis on turbidites, submarine canyons, and fans Development of architectural characteristics of marine depositional systems with emphasis on porosity and permeability trends Projects Dr. Bouma is finishing a book on sediments about understanding what the criteria are that makes sediments rich or poor in natural gas. Developing the Center for Shale Studies at Texas AM, including universities and research institutes worldwide. Developing a program at Texas AM in which students from Geology and Geophysics, Geological Oceanography, and Petroleum Engineering can work interactively on data obtained from the oil and gas industry. Experience 2006 - Director of the Center for Shale Studies 2005 - present Adjunct Professor, Department of Geology and Geophysics, Texas AM University. 1990 - 1992 Head, School of Geosciences, Louisiana State University 1988 - 2005 McCord Endowed Professor in Sedimentary Geology, Department of Geology and Geophysics, Louisiana State University 1976 - 1988 held positions of: Chief Scientist, Research Geologist, Project Supervisor, Scientific Advisor and Senior Research Associate of many different projects 1970 - 1975 Professor, Geological Oceanography, Texas AM University 1966 - 1970 Associate Professor, Geological Oceanography, Texas AM University 1963 - 1966 Instructor, Geological Institute, Utrecht, The Netherlands 1962 - 1963 Fullbright Post-doctoral fellowship, Scripps Institution of Oceanography, La Jolla, C. Selected Publications Scott, E.D., Bouma, A.H., and Bryant, W.R., eds., 2002. Depositional Processes and Characteristics of Siltstones, Mudstones, and Shale. Special symposium Gulf Coast Association of Geological Societies, Annual Meeting, Austin, TX, 102 pp and additional illustration, also on CD-ROM Weimer, P., Slatt, R.M., Coleman, J., Rozen, N.C., Nelson, H., Bouma, A.H., Styzen, M.J., and Lawrence, D.T., eds., 2000. Deep-Water Reservoirs of the World. 20th Annual Gulf Coast Section Society of Economic Paleontologists and Mineralogists Bob F. Perkins Research Conference, Houston, TX, 64 pp abstract book and 1105 pp complete papers on CD-ROM Bouma, A.H., and Stone, C.G., eds., 2000. Fine-Grained Turbidite Systems. American Association of Petroleum Geologists Memoir 72, Society for Sedimentary Geology (SEPM) Special Publication 68, 342 pp. Weimer, P., Bouma, A.H., and Perkins, B.F., eds., 1994. Submarine Fans and Turbidite Systems: Sequence Stratigraphy, Reservoir Architecture and Production Characteristics - Gulf of Mexico and International: 15th Annual Gulf Coast Section Society of Economic Paleontologists and Mineralogists Foundation Research Conference, Houston, TX, 440 pp. Bouma, A.H., and Carter, R.M., eds., 1991. Facies Models in Exploration and Development of Hydrocarbon and Ore Deposits: VSP, Utrecht, The Netherlands, 254 pp. Awards Honors 2007 Sidney Powers Memorial Award, AAPG 2007 Honorary Member AAPG 2007 Honorary Member SEPM 2006 Geo-Legend. Houston Geological Society News As part of the Center for Shale Studies, Dr. Bouma plans to involve faculty and students from Geology, Geophysics, Geochemistry and Petroleum Engineering as well as get companies to support the research and students.
An environmental impact assessment (EIA) commissioned by the International Association of Geophysical Contractors (IAGC) has concluded that electromagnetic (EM) techniques used for oil and gas exploration and production in the marine environment have no potential for significant effects on animal groups such as fish, seabirds, sea turtles, and marine mammals. In addition, cumulative effects from EM surveys are negligible compared to natural EM anomalies, induced fields from natural water currents, and anthropogenic EM sources such as those originating from undersea equipment. The EM assessment was funded by the member companies of the IAGC’s EM subcommittee and prepared by LGL environmental research associates of St. John’s, Newfoundland and Labrador, Canada. The goal of the EIA was to provide a comprehensive resource summarizing available literature and potential effects of EM technologies on marine life. Designed for a broad audience, the document provides a basic description of EM survey technologies, naturally-occurring EM fields, and the potential use of these fields by diverse animal groups. The assessment focuses on survey activities considered to have at least some potential to affect marine animals, such as EM, noise, light emissions, and accidental events. Source: http://fb.eage.org/content.php?id=55893
World Energy Statistics Data for 2008 except where noted (data shown below is the latest available as of 08/15/2011): Primary Energy Production (2007) 475 quadrillion Btu Oil Coal Gas Hydro Nuclear Other 35% 28% 23% 6% 6% 2% World Energy Consumption 493 quadrillion Btu United States China Russia Japan India Germany 20% 17% 6% 4% 4% 3% Per Capita Consumption (selected countries) United States Russia Germany Japan China 330 million Btu 216 million Btu 174 million Btu 172 million Btu 65 million Btu Energy-Related Carbon Dioxide Emissions (2009) 30,313 million metric tons of carbon dioxide China United States Europe India Russia Japan 25% 17% 14% 5% 5% 4% http://www.eia.gov/kids/energy.cfm?page=stats
美国麻省理工学院(MIT)在2011年年末(12月19日)宣布,MIT将推出网上学习新计划-命名为MITx。MITx将免费提供网上学习课程和学习工具( ' MITx ' will offer courses online and make online learning tools freely available)。 什么叫MITx? MIT想通过开发MITx来提高MIT校园和全球的教育( MIT seeks through the development of MITx to improve education both on the MIT campus and around the world. )。MITx是MIT教务长 L. 拉斐尔 •莱夫( The initiative is led by MIT Provost L. Rafael Reif)倡导提出的。MITx计划会超越传统的MIT OpenCourseWare (MIT免费开放课程已经过去10年了),不仅校内外学生可以受益,而且增加了互动环节和课程开发工具。我们将来拭目以待 ! 以下是MIT官方对MITx的一些解释和释疑。时间原因,仅仅抛砖引玉! On campus(在MIT校园), MITx will be coupled with an Institute-wide research initiative on online teaching and learning. The online learning tools that MITx develops will benefit the educational experience of residential students by supplementing and reinforcing the classroom and laboratory experiences. Beyond the MIT campus(超越MIT校园), MITx will endeavor to break down barriers to education in two ways. First, it will offer the online teaching of MIT courses to people around the world and the opportunity for able learners to gain certification of mastery of MIT material. Second, it will make freely available to educational institutions everywhere the open-source software infrastructure on which MITx is based. Since it launched OpenCourseWare (OCW) 10 years ago, MIT has been committed to using technology to improve and greatly widen access to education. The launch of MITx represents a next step forward in that effort. 谁是MITx计划的倡导者? 是MIT教务长 L. 拉斐尔 •莱夫( The initiative is led by MIT Provost L. Rafael Reif) MITx什么时候可以激活? MIT计划在2012年春天推出MITx的原型版本。 MIT plans to launch an experimental prototype version of MITx in the spring 2012 timeframe. Once the open learning infrastructure is in stable form, MIT will also release the open-source software infrastructure and will establish ways for other universities, as well as interested individuals, to join MIT in improving and adding features to the technology. Why is MIT announcing this now, before MITx has been built?为什么在MITx建立以前就宣布MITx计划? Many schools and faculty within MIT and other universities are interested in online education and exploring ways in which to offer their content online. MIT wants its community and the communities of other institutions to know that they can continue to look to MIT to bring innovation to online learning and teaching, as it has done with OCW. MIT also wants to make available an adaptable, free platform for any school to use for its own online initiatives. Furthermore, the time is right from a technology perspective, because within MIT we have already gained experience in online technologies through many courses that already include significant online components. These technologies include online tutors, online laboratories, crowd-sourced grading of programs, machine learning and automatic transcription. How will this affect the MIT on-campus education? 对MIT校内教育有何影响? MIT’s residential-based education is the heart of the MIT community, and an MIT degree holds special distinction. MITx will be coupled with an MIT-wide research initiative into online learning that will study ways in which students, whether on campus or part of a virtual community, learn most effectively. To the degree that MITx demonstrates highly effective online learning tools from which campus-based students might benefit, such as self-paced online exercises, those tools will become part of the experience of MIT students. These tools will enable campus faculty to automate some of the more repetitive and less creative tasks, such as grading, thereby liberating more time to devote to innovative ways of teaching the material and to additional contact time with resident students. Is MIT signaling a lack of support for the traditional, residential model of education? Not at all. MIT believes firmly in the residential model of education. MIT’s new initiative in online education is meant not only to improve the experience of traditional, residential MIT students by continuing to innovate with the latest pedagogical technologies, but also to lower the existing barriers between residential campuses and millions of learners around the world. Will MIT students and online-only non-MIT learners use MITx in the same way? No. MIT faculty and students will determine what use to make of the new platform for their on-campus classes: The platform may serve as a way for students to reinforce and explore what they are learning in the classroom and lab. We have observed that the same is true of OCW: MIT’s residential learners use OCW materials to augment their residential experience. Will this platform offer MIT degrees? No. MIT awards MIT degrees only to those admitted to MIT through a highly selective admissions process. If credentials are awarded, will they be awarded by MIT? As online learning and assessment evolve and improve, online learners who demonstrate mastery of subjects could earn a certificate of completion, but any such credential would not be issued under the name MIT. Rather, MIT plans to create a not-for-profit body within the Institute that will offer certification for online learners of MIT coursework. That body will carry a distinct name to avoid confusion. Who can take courses on MITx ? Will there be an admission process? As with OCW, the teaching materials on MITx will be available to anyone in the world for free, and in general, there will not be an admission process. However, credentials will be granted only to students who earn them by demonstrating mastery of the material of a subject. In MITx , what will be free and what will cost money? All of the teaching on the platform will be free of charge. Those who have the ability and motivation to demonstrate mastery of content can receive a credential for a modest fee. What will it cost to get a credential for a given course? MIT is in the process of determining a fee structure for individual courses and groups of courses. The aim is to make credentialing highly affordable. Will MIT remain committed to OpenCourseWare? Yes. OCW will continue as before: It will make course materials from across the MIT curriculum available to the world for free. There will be no reduction in the level of what OCW offers. How will MITx be financed? MIT’s online initiative will be a not-for-profit activity consistent with MIT’s mission, but it is expected to generate positive net income from various revenue sources, including fees for certification from learners who demonstrate mastery of course material. MIT also anticipates substantial interest from foundations, companies and individuals positioned to support the endeavor. MIT will share the expected positive net income with faculty members who develop courses for the platform. Net income from the initiative after revenue sharing will benefit MIT and its mission. OCW provides course material for nearly all MIT classes. Will MITx offer interactive online courses at that same scale? No. MITx will begin by offering a portfolio of selected courses, which will grow over time. The selection of courses will depend on the interests of MIT faculty and online learners and will be determined on a course-by-course basis. What resources will MIT make available to the faculty in support of MITx ? MIT will actively support faculty members in creating online courses. http://web.mit.edu/newsoffice/2011/mitx-faq-1219 http://web.mit.edu/newsoffice/2011/mitx-education-initiative-1219.html http://ocw.mit.edu/index.htm 转载和引用此文的链接: http://tieba.baidu.com/f?kz=1332223291 MITx开放课程的前瞻性与局限性: http://blog.sciencenet.cn/home.php?mod=spaceuid=1750do=blogid=520603 MIT值得学习: http://wap.sciencenet.cn/blog.aspx?mod=spaceuid=41174do=blogid=520238 向MIT致敬: http://blog.sciencenet.cn/home.php?mod=spaceuid=49577do=blogid=520148 MIT启动在线学习行动计划MITx: http://jiao.blogbus.com/logs/182475298.html 先秦网 http://xianqin.5d6d.com/thread-9035-1-1.html 麻省理工明年推线上免费课程平台MITx http://www.pcpop.com/doc/0/746/746801.shtml
Industry Societies AAPG - American Association of Petroleum Geologists API - American Petroleum Institute CSEG – Canadian Society of Exploration Geophysicists EAGE – European Association of Geoscientists and Engineers IAGC – International Association of Geophysical Contractors PESGB - Petroleum Exploration Society of Great Britain SEG – Society of Exploration Geophysicists SPE - Society of Petroleum Engineers Interesting Links Baker Hughes interactive rig count map Hart’s Unconventional Gas Center International Energy Agency’s (IEA) World Energy Outlook and statistics ION Geophysical Seis Matters blog Geophysical Research Groups Consortium for Research in Elastic Wave Exploration Geophysics (CREWES) Memorial University Seismic Imaging Consortium (MUSIC) LITHOPROBE Foothills Research Project (FRP) Signal Analysis and Imaging Group (SAIG) Seismic Heavy Oil Consortium (SHOC) company BHP Billiton Petroleum ( Americas) Inc. CGGVeritas Chevron Corporation ConocoPhillips Devon Energy Corporation Ecopetrol SA Encana Corporation Eni S.p.A. Exxon Mobil Corporation GDF Suez EP Deutschland GmbH Geokinetics Inc. Geophysical Exploration Development Corporation (GEDCO) Geoprocesados, S.A. de C.V. Husky Energy Inc. INOVA Geophysical Equipment Ltd. Landmark Graphics Corporation Marathon Oil Corporation Nexen Inc. PennWest Exploration Petrobras Saudi Aramco Sensor Geophysical Ltd. Shell Canada Limited Statoil ASA Talisman Energy Inc. TGS-NOPEC Tullow Oil p.l.c. Sercel( http://www.sercel.com/Products/land/sensors/digital_sensor.php ) Westgeo( http://www.slb.com/services/westerngeco.aspx )
By Tom Bergin DOHA | Tue Dec 6, 2011 3:56pm GMT DOHA (Reuters) - Royal Dutch Shell Plc has found shale gas in China , a development that could cap imports in a market natural gas producers are hoping will drive demand. An official with Shell's partner, PetroChina ( 601857.SS ), a unit of the country's top energy group, state-owned CNPC, said drilling results from two wells Shell drilled had been positive. "Shell has two vertical wells and they got very good primary production," Professor Yuzhang Liu, Vice president of Petrochina's Research Institute of Petroleum Exploration and Development (RIPED), said in an interview at the sidelines of the World Petroleum Congress (WPC) in Doha. "It's good news for shale gas," Liu, who regularly represents PetroChina at industry events around the world, told Reuters late on Monday. China currently has no commercial production of shale gas, which is natural gas extracted from soft, finely stratified sedimentary rock. It is obtained by hydraulically fracturing the rock and requires large quantities of water and chemicals to extract, which environmentalists say can contaminate groundwater supplies. Some industry executives doubt the boom in shale gas in the United States that has revolutionised the market there could be replicated elsewhere due to difficult geology, the lack of water availability or land access issues. Liu accepted the rock formations in China were "different" from those in the United States but denied this meant they were more challenging or less bountiful. In less than decade, shale gas has transformed the United States from gas shortage to a point where companies are planning to export liquefied natural gas (LNG), fundamentally altering the dynamics of the international gas market. LNG projects freeze and squeeze natural gas into liquid for export in tankers. Many producers who were targeting the United States were forced to rethink their plans, and China, with its booming energy demand, was seen as the answer to their need for a market. A Chinese 'shale gale' as the revolution was termed in America, could jeopardise that market, too. Shell declined to confirm the find but said in a statement; "Shell will complete drilling activities by the year end ... as planned." Chief Executive Peter Voser has previously said he had "great expectations" for Chinese shale but was cautious in his comments to the WPC on Tuesday. "We are going through the exploration phase there and are exactly now analysing what potential is available now in China," he told a news conference. In November 2009, PetroChina and Royal Dutch Shell agreed to jointly evaluate shale gas reserves of the Fushun-Yongchuan block in Sichuan basin. Earlier this year, industry sources said Shell had started drilling two shale gas exploration wells in Fushun. A U.S. Energy Information Administration report in April said China had 1,275 trillion cubic feet (tcf) of technically recoverable shale gas resources -- by far the largest in the world, followed by the United States with 862 tcf and Argentina with 774 tcf. http://uk.reuters.com/article/2011/12/06/uk-shell-chinashale-idUKTRE7B50HH20111206
Arizona The University of Arizona Department of Geosciences http://www.geo.arizona.edu/ http://www.geo.arizona.edu/geophysics/ http://www.geo.arizona.edu/research/geophysics.html California California Institute of Technology Division of Geological and Planetary Sciences http://www.gps.caltech.edu/ Stanford University The Department of Geophysics, School of Earth Sciences http://pangea.stanford.edu/departments/geophysics/ University of California, Davis Department of Geology https://www.geology.ucdavis.edu/ https://www.geology.ucdavis.edu/researc ... index.html University of California, Santa Cruz Department of Earth Planetary Sciences http://es.ucsc.edu/ University of California, San Diego Institute of Geophysics and Planetary Physics http://igpp.ucsd.edu/ University of California, Santa Barbara Department of Earth Sciences http://www.geol.ucsb.edu/ http://www.geol.ucsb.edu/research/topic ... ysics.html University of California, Berkeley Earth Planetary Science http://eps.berkeley.edu/ University of California, Los Angeles Institute of Geophysics and Planetary Physics http://www.igpp.ucla.edu/ University of Southern California Department of Earth Sciences http://dornsife.usc.edu/earth/ http://dornsife.usc.edu/earth/research/ ... hysics.cfm Connecticut Yale University Department of Geology and Geophysics http://www.yale.edu/geology/ University of Connecticut Department of Physics http://www.phys.uconn.edu/ http://www.phys.uconn.edu/research/geophysics/ Colorado Colorado School of Mines Department of Geophysics http://geophysics.mines.edu/ University of Colorado Geophysical Sciences program http://www.colorado.edu/geophysics/ Florida Florida State University Department of Geological Sciences http://www.gly.fsu.edu/ http://www.gly.fsu.edu/geoph.html Miami University Rosenstiel School of Marine Atmospheric Science http://www.rsmas.miami.edu/ Marine Geology Geophysics Division http://www.rsmas.miami.edu/academics/di ... ophysics// Hawaii University of Hawaii, Manoa Department of Geology and Geophysics http://www.soest.hawaii.edu/GG/ Idaho Boise State University Department of Geosciences http://earth.boisestate.edu/ http://earth.boisestate.edu/degrees/und ... eophysics/ University of Idaho Department of Geosciences http://earth.boisestate.edu/ Illinois Northwestern University Department of Earth Planetary Sciences http://www.earth.northwestern.edu/ University of Chicago Department of Geophysical Sciences http://geosci.uchicago.edu/ Indiana Indiana University Geological Sciences Department of Geological Sciences http://geology.indiana.edu http://geology.indiana.edu/geophysics/ Kansas University of Kansas Department of Geology http://www.geo.ku.edu/~geology/ http://www.geo.ku.edu/programs/geophysics/index.html Louisiana Louisiana State University Department of Geology Geophysics http://uiswcmsweb.prod.lsu.edu/geol/ University of New Orleans Department of Earth Environmental Sciences http://ees.uno.edu/ Massachusetts Massachusetts Institute of Technology Department of Earth, Atmospheric and Planetary Sciences (EAPS) http://eapsweb.mit.edu/ Harvard University Department of Earth and Planetary Sciences http://www.eps.harvard.edu/ http://www.geophysics.harvard.edu/ Boston College Department of Earth and Environmental Sciences http://www.bc.edu/schools/cas/geo/ Michigan University of Michigan Department of Earth and Environmental Sciences http://www.lsa.umich.edu/earth/ https://secure.geo.lsa.umich.edu/groups/geophysics/ Michigan Technological University Department of Geological/Mining Engineering Sciences http://www.geo.mtu.edu/ Minnesota University of Minnesota Department of Earth Sciences http://www.geo.umn.edu/ Missouri Missouri University of Science and Technology Department of Geological Sciences Engineering http://gse.mst.edu/ Montana Montana Tech of University of Montana School of Mines and Engineering http://www.mtech.edu/mines/ http://www.mtech.edu/mines/geophysical/ Saint Louis University Department of Earth Atmospheric Sciences http://www.slu.edu/x40906.xml Nevada University of Nevada, Reno Department of Geological Sciences Engineering http://www.unr.edu/cos/geology/ http://www.unr.edu/cos/geology/programs ... ysics.html New Jersey Princeton University Department of Geosciences http://www.princeton.edu/geosciences/ Rutgers University, Newark Department of Earth Environmental Sciences http://geology.newark.rutgers.edu/ New Mexico New Mexico Institute of Mining and Technology Department of Earth Environmental Science http://www.ees.nmt.edu/ http://www.ees.nmt.edu/outside/Geop/ New York Columbia University Department of Earth Environmental Sciences http://eesc.columbia.edu/ Lamont-Doherty Earth Observatory http://www.ldeo.columbia.edu/ Cornell University Department of Earth Atmospheric Sciences http://www.eas.cornell.edu/ http://www.geo.cornell.edu/eas/res_geophys_struc/ Ohio University of Akron Department of Geology and Environmental Science http://www.uakron.edu/geology/ http://www.uakron.edu/geology/academics ... iption.dot Oklahoma University of Tulsa Department of Geosciences http://www.utulsa.edu/academics/college ... ences.aspx Wright State University Department of Earth Environmental Sciences http://www.wright.edu/ees/ Oregon Oregon State University College of Oceanic and Atmospheric Sciences http://www.oce.orst.edu/ Marine Geology and Geophysics Program http://www.oce.orst.edu/index.cfm?conte ... pageID=149 Pennsylvania Pennsylvania State University Department of Geosciences http://www.geosc.psu.edu/ Rhode Island Brown University Department of Geological Sciences http://brown.edu/Departments/Geology/ Tennessee University of Memphis Department of Earth Sciences http://www.memphis.edu/des/ Texas Texas AM University Department of Geology and Geophysics http://geoweb.tamu.edu/ University of Texas, Austin Institute for Geophysics http://www.ig.utexas.edu/ University of Texas, El Paso Department of Geological Sciences http://science.utep.edu/geology/ http://academics.utep.edu/Default.aspx?tabid=42929 Rice University Department of Earth Science http://www.glacier.rice.edu Southern Methodist University The Department of Geological Sciences http://smu.edu/earthsciences/ Utah University of Utah Department of Geology Geophysics http://www.earth.utah.edu/ Virginia Virginia Polytechnic Institute and State University (Virginia Tech) Department of Geosciences http://www.geos.vt.edu/ Washington University of Washington Department of Earth and Space Sciences http://www.ess.washington.edu/ Wyoming University of Wyoming Department of Geology Geophysics http://geology.uwyo.edu/
List of Geophysics Journals with Impact Factors Advances in Geophysics (U.S.A.) 1.571 http://www.elsevier.com/wps/find/bookde ... escription The critically acclaimed serialized review journal for over 50 years, Advances in Geophysics is a highly respected publication in the field of geophysics. Annals of Geophysics (Italy) 0.548 http://www.annalsofgeophysics.eu Annals of Geophysics is an international, peer-reviewed, open-access, online journal. Annals of Geophysics welcomes contributions on primary research on Seismology, Geodesy, Volcanology, Physics and Chemistry of the Earth, Oceanography and Climatology, Geomagnetism and Paleomagnetism, Geophysics and Tectonophysics, Physics and Chemistry of the Atmosphere. It provides: * Open-access, freely accessible online (authors retain copyright) * Fast publication times * Peer review by expert, practicing researchers * Post-publication tools to indicate quality and impact * Worldwide media coverage * Annals of Geophysics is published by Istituto Nazionale di Geofisica e Vulcanologia (INGV), nonprofit public research institution. Applied Geophysics (P.R.China) 0.457 http://www.springerlink.com/content/1672-7975 * Applied Geophysics was started in 2004 by the Chinese Geophysical Society, and today is a unique, comprehensive English language periodical, distributed in China and abroad. * Applied Geophysics creates an academic realm for scientific researchers, engineers, and professors in geophysics, where they can publish and exchange their experiences in scientific research, production results, and production management, aiming to reflect and represent achievements in the Chinese applied geophysics sector, and also to publish the research and practices of geophysicists from around the world. * The journal is designed to promote rapid communication and exchange of ideas between Chinese and world-wide geophysicists. * The publication covers the applications of geoscience, geophysics, and related disciplines in the fields of energy, resources, environment, disaster, engineering, information, military, and surveying. Astronomay Geophysics (U.K.) 0.391 http://www.ras.org.uk/publications/journals AG publishes papers on astronomy, astrophysics, cosmology, planetary science, solar-terrestrial physics, global and regional geophysics, and the history of these topics. AG also focuses on topical items, reports of meetings, science in the news, and acts as a forum for discussion of all matters of interest to professional astronomers and geophysicists. Bulletin of the Seismological Society of America (U.S.A.) 1.143 http://www.bssaonline.org/ The Bulletin of the Seismological Society of America (ISSN 0037-1106) is the premier journal of advanced research in earthquake seismology and related disciplines. It first appeared in 1911 and was issued on a quarterly basis until 1963. Since 1963, it has appeared bimonthly (in February, April, June, August, October, and December). Each issue is composed of scientific papers on the various aspects of seismology, including investigation of specific earthquakes, theoretical and observational studies of seismic waves, inverse methods for determining the structure of the Earth or the dynamics of the earthquake source, seismometry, earthquake hazard and risk estimation, seismotectonics, and earthquake engineering. In addition to full-length papers, each issue contains a section of "Short Notes" for comments on previously published items or for brief, topical contributions. Chinese Journal of Geophysics (P.R.China) 0.639 http://www.agu.org/wps/ChineseJGeo/ The Chinese Journal of Geophysics has been published since 1948. It is a comprehensive journal on geophysics sponsored by the Chinese Geophysical Society (CGS) and the Institute of Geology and Geophysics of Chinese Academy of Sciences. Issues of the journals include articles on solid and applied geophysics, space and atmospheric physics, ocean physics and related fields. The Editor-in-Chief of the journal is Liu Guang-Ding. The electronic English version is published by CGS and distributed by the AGU. Exploration Geophysics (Australia) 0.404 http://www.aseg.org.au/Publications/EG.aspx Exploration Geophysics publishes research in geophysics, reviews, technical papers and significant case histories in minerals, petroleum, mining and environmental geophysics. It is an official publication of the Australia Society of Exploration Geophysicists. Geochemistry Geophysics Geosystems (U.S.A.) 2.626 http://www.agu.org/journals/gc/ Geochemistry, Geophysics, Geosystems (G3) publishes research papers on the chemistry, physics, and biology of Earth and planetary processes. Articles should be of broad interest and interdisciplinary approaches are encouraged, but not required. G3 seeks original scientific contributions pertaining to understanding the Earth as a system, including observational, experimental, and theoretical investigations of the solid Earth, hydrosphere, atmosphere, and biosphere at all spatial and temporal scales. Geophysics (U.S.A.) 1.662 http://segdl.org/geophysics/ Geophysics, published by the Society of Exploration Geophysicists since 1936, is an archival journal encompassing all aspects of research, exploration, and education in applied geophysics. Its articles, generally more than 175 per year in six issues, cover the entire spectrum of geophysical methods, including seismology, potential fields, electromagnetics, and borehole measurements. Geophysics, a bimonthly, provides theoretical and mathematical tools needed to reproduce depicted work, encouraging further development and research. Geophysical and Astrophysical Fluid Dynamics (U.K.) 1.604 http://www.tandf.co.uk/journals/titles/03091929.html Geophysical and Astrophysical Fluid Dynamics exists for the publication of original research papers and short communications, occasional survey articles and conference reports on the fluid mechanics of the earth and planets, including oceans, atmospheres and interiors, and the fluid mechanics of the sun, stars and other astrophysical objects. Geophysical Journal International (U.K.) 2.435 http://www.ras.org.uk/publications/journals GJI is the primary solid-earth geophysics journal based in Europe, publishing the results of research on the earth's internal structure, physical properties, evolution and processes covering all aspects of theoretical, computational and observational geophysics. Geophysical Journal (Ukraine) http://www.igph.kiev.ua/journal.html The journal was created in 1979 on basis of the Geophysical Digest founded in 1956 and published by the INSTITUTE OF GEOPHYSICS NATIONAL ACADEMY OF SCIENCES OF UKRAINE. On the pages of this international journal, we publish new data of theoretical and experimental geophysical investigations, materials on regularities of distribution of various Earth's physical fields, issues of complex research of Plutonic structure of lithosphere, contemporary geodynamics and earthquake prognosis, results of analysis of physical properties of mineral substance in various PT-conditions, works in the field of geothermy, palaeomagnetism, ocean geophysics, minerals search and field work with geophysical methods etc. Methodical and instrumental projects, discussions materials, reviews, announcements about scientific conferences and other information are published as well. Geophysical Prospecting (Europe) 1.772 http://www.eage.org/?evp=1187 Geophysical Prospecting publishes the best in primary research in geoscience with a particular focus in exploration geophysics. The scope of the journal covers the potential field, electromagnetic and seismic methods applied to exploration and monitoring. The journal welcomes theoretical and numerical studies as well as case studies and review papers. Contributors are from industry and academia. The goal of the journal is to provide a valuable forum for sharing experiences and new ideas among workers in exploration geophysics. Geophysical Research Letters (U.S.A.) 2.606 http://www.agu.org/journals/gl/ GRL is a Letters journal; limiting manuscript size expedites the review and publication process. GRL also publishes a limited number of frontier articles, by invitation from Editors. GRL's mission is to disseminate concisely-written, high-impact research reports on major scientific advances in AGU disciplines . With this goal, the Editorial Board evaluates manuscripts submitted to GRL according to the following criteria: * High impact innovative results with broad geophysical implications at the forefront of one or several AGU disciplines. * Results with immediate impact on the research of others and requiring rapid publication. * Instrument or methods manuscript introducing an innovative technique that makes new science advance possible, with immediate applications to AGU disciplines. Geotectonics (Russia) 1.000 http://www.maik.rssi.ru/journals/geoteng.htm Geotectonics publishes articles on general and regional tectonics, structural geology, geodynamics, and experimental tectonics and considers the relation of tectonics to the deep structure of the earth, magmatism, metamorphism, and mineral resources. Reviews of scientific articles and books, information on scientific life, and advertisements of scientific literature and cartographic materials and devices are also published. The journal was founded in 1965. Journal of Applied Geophysics (International) 1.294 http://www.elsevier.com/wps/find/journa ... escription The Journal of Applied Geophysics with its key objective of responding to pertinent and timely needs, places particular emphasis on methodological developments and innovative applications of geophysical techniques for addressing environmental, engineering, and hydrological problems. Related topical research in exploration geophysics and in soil and rock physics is also covered by the Journal of Applied Geophysics. Journal of the Balkan Geophysical Society (Balkan peninsula countries) http://www.balkangeophysoc.gr/ Journal of the Balkan Geophysical Society publishes original scientific papers, review articles from different fields of Geophysics, short scientific reports (letters to the editor), etc. The Journal is published in English. The BGS Council chooses the Editorial Board and the headquarters of the Journal. All Member Countries give their financial support to the Journal. The Council determines the frequency of the Journal. Journal of Environmental and Engineering Geophysics (U.S.A.) 0.698 http://www.eegs.org/Publications/JEEG.aspx The Journal of Environmental Engineering Geophysics (JEEG; ISSN 1083-1363) is the peer-reviewed journal of the Environmental and Engineering Geophysical Society (EEGS). JEEG welcomes manuscripts on new developments in near-surface geophysics applied to environmental, engineering, and mining issues as well as novel near-surface geophysics case histories. JEEG is published four times a year and is available in print as an EEGS member benefit, by subscription, and electronically through GeoScienceWorld and the SEG Digital Library. Journal of Geodesy (International) 2.429 http://www.springer.com/earth+sciences+ ... ournal/190 The Journal of Geodesy is an international journal concerned with the study of scientific problems of geodesy and related interdisciplinary sciences. It presents peer-reviewed papers on theoretical or modeling studies, and on results of experiments and interpretations. In addition to original research papers, the journal publishes commissioned review papers on topical subjects and special issues arising from chosen scientific symposia or workshops. The journal covers the whole range of geodetic science and reports on theoretical and applied studies in research areas such as positioning; reference frame; geodetic networks; modeling and quality control; space geodesy; remote sensing; gravity fields, and geodynamics. Journal of Geodynamics (International) 1.812 http://www.elsevier.com/wps/find/journa ... escription The Journal of Geodynamics is an international and interdisciplinary forum for the publication of results and discussions of solid earth research in geodetic, geophysical, geological and geochemical geodynamics, with special emphasis on the large scale processes involved. Papers addressing interdisciplinary aspects, analyses, results and interpretation will receive special attention. Original research papers, including 'letters', as well as topical reviews are invited on: • Earth rotation • Rheology and mineral properties of the deep earth, physical properties of rocks and their dependence on pressure, temperature and chemical composition • Upper mantle - lower mantle; lithosphere - asthenosphere • Mantle convection, hot spots and plumes, heat flow and the thermo-mechanical evolution of the earth • Plate kinematics, plate tectonics and plate dynamics, driving mechanisms • Stress field; horizontal and vertical crustal movements • Evolution of continents and oceans, including the formation and destruction of oceanic lithosphere, orogenic processes and basin evolution • Crust-mantle interaction, chemical recycling • Sea surface and ocean bottom topography, including variations of sea level • Dynamic interpretation and modelling of potential fields, including isostasy, glacial isostasy • Magma formation, differentiation, transport and emplacement, including modelling of volcanic eruptions • Dynamic consequences of natural events, including source dynamics, seismic modelling, seismo-tectonics, modelling of earthquakes, impacts • Data aquisition and analysis for geodynamics, including the use of SLR, VLBI, GPS, etc • Integrated models and non-linear processes Journal of Geophysical Research (U.S.A.) 3.082 http://www.agu.org/journals/jgr/ Journal of Geophysical Research (JGR) publishes original scientific research on the physical, chemical, and biological processes that contribute to the understanding of the Earth, Sun, and solar system and all of their environments and components. JGR is currently organized into seven disciplinary sections (Atmospheres, Biogeosciences, Earth Surface, Oceans, Planets, Solid Earth, Space Physics). Sections may be added or combined in response to changes in the science. Journal of Geophysics and Engineering (P.R.China) 0.787 http://iopscience.iop.org/1742-2140 Journal of Geophysics and Engineering includes extensive coverage of research and developments in geophysics and in related areas of engineering. Although focusing primarily on applied science and engineering the journal also publishes papers on all earth-physics disciplines from global geophysics to applied and engineering geophysics, including geodynamics, natural and controlled-source seismology, oil, gas and mineral exploration, petrophysics and reservoir geophysics. Marine Geophysical Researches 0.729 http://www.springer.com/earth+sciences+ ... rnal/11001 Marine Geophysical Research (MGR) has a long-established reputation for high quality geophysical research and data on deep ocean basins. Reflecting international efforts to better understand the global mid-ocean ridge system, its focus has broadened to include studies of continental margin geophysics, structure, stratigraphy and sediment deposition processes. The editors of MGR anticipate a rising rate of advances in this sphere in coming years, reflecting the diversity and complexity of processes in the margins. Near Surface Geophysics (Europe) 0.838 http://nsg.eage.org/ Near Surface Geophysics is an international journal for the publication of research and development in geophysics applied to near surface. It places emphasis on geological, hydrogeological, geotechnical, environmental, engineering, mining, archaeological, agricultural and other applications of geophysics as well as physical soil and rock properties. Geophysical and geoscientific case histories with innovative use of geophysical techniques are welcome, which may include improvements on instrumentation, measurements, data acquisition and processing, modelling, inversion, interpretation, project management and multidisciplinary use. The papers should also be understandable to those who use geophysical data but are not necessarily geophysicists. New Zealand Journal of Geology and Geophysics (New Zealand) 1.167 http://www.royalsociety.org.nz/publicat ... nals/nzjg/ • Aims: New Zealand is well respected for its growing research activity in the geosciences, particularly in circum-Pacific earth science. The New Zealand Journal of Geology and Geophysics plays an important role in disseminating field-based, experimental, and theoretical research to geoscientists with interests both within and beyond the circum-Pacific. • Scope of submissions: The New Zealand Journal of Geology and Geophysics publishes original research papers, review papers, short communications, book reviews, letters, and forum articles. We welcome submissions on all aspects of the earth sciences relevant to New Zealand, the Pacific Rim, and Antarctica. The subject matter includes geology, geophysics, and soil science. Nonlinear Processes in Geophysics (Europe) 1.152 http://www.nonlinear-processes-in-geophysics.net/ • Nonlinear Processes in Geophysics (NPG) is an international, interdisciplinary journal for the publication of original research furthering knowledge on nonlinear processes in all branches of Earth, planetary and solar system sciences. The editors encourage submissions that apply nonlinear analysis methods to both models and data. • The journal maintains sections for research articles, review articles, brief communications, comments and replies, and book reviews, as well as "Special Issues". Pure and Applied Geophysics (Switzerland) 0.938 http://www.springer.com/birkhauser/geo+ ... journal/24 pure and applied geophysics (pageoph), a continuation of the journal "Geofisica pura e applicata", publishes original scientific contributions in the fields of solid Earth, atmospheric and oceanic sciences. Regular and special issues feature thought-provoking reports on active areas of current research and state-of-the-art surveys. REVIEWS OF GEOPHYSICS (U.S.A.) 8.021 http://www.agu.org/journals/rg/ • Reviews of Geophysics ranks first in “Geochemistry and Geophysics” since 1998 in Journal Citation Reports 2008. • The objectives of Reviews of Geophysics are to provide an overview of geophysics and the directions in which it is going and to serve as an integrating force in geophysics. Authorship is by invitation, but suggestions from readers and potential authors are welcome. • Reviews of Geophysics distills and places in perspective previous scientific work in currently active subject areas of geophysics. Contributions evaluate overall progress in the field and cover all disciplines embraced by AGU. RUSSIAN GEOLOGY AND GEOPHYSICS (Russia) 1.000 http://www.agu.org/wps/rgg/ Russian Geology and Geophysics publishes original theoretical and methodological papers and reviews in all areas of geology and geophysics, with special attention to geological issues of Siberia and Asia as a whole. Seismological Research Letters (U.S.A) 1.826 http://srl.geoscienceworld.org/ The bimonthly Seismological Research Letters serves as a general forum for informal communication among seismologists, as well as between seismologists and those nonspecialists interested in seismology and related disciplines. The contents of SRL include contributed articles on topics of broad seismological interest, opinion pieces on current seismological topics, News and Notes about seismology in the U.S. and internationally, Transitions notes about seismologists, special earthquake reports, and letters to the editor. SURVEYS IN GEOPHYSICS (International) 3.179 http://www.springer.com/earth+sciences+ ... rnal/10712 • Surveys in Geophysics publishes refereed overview articles on physical, chemical and biological processes occurring within the Earth, on its surface, in its atmosphere and in the near-Earth space environment, including relations with other bodies in the solar system. Observations, their interpretation, theory and modeling are presented in relation to relevant disciplines in the Geosciences and related areas. • Published articles present balanced and well constructed reviews of recent advances in areas of topical interest, written for the broad community of earth scientists in academia, government and industry. • The subjects covered in Surveys in Geophysics comprise all aspects of the solid Earth, geodesy, oceans and atmosphere, meteorology and climate, hydrology, environmental issues, solar-terrestrial and space physics, plus the physics of the Moon and the terrestrial-type planets. Tectonophysics (International) 1.935 http://www.elsevier.com/wps/find/journa ... escription The prime focus of Tectonophysics will be high-impact original research and reviews in the fields of kinematics, structure, composition, and dynamics of the solid earth at all scales. Tectonophysics particularly encourages submission of papers based on the integration of a multitude of geophysical, geological, geochemical, geodynamic, and geotectonic methods with focus on: • Kinematics and deformation of the lithosphere based on space geodesy (e.g. GPS, InSAR), neoteoctonic studies, tectonic geomorphology, and geochronology; • Structure, composition, and thermal state of the crust and mantle and their evolution in various time scales based on geophysical and geochemical studies; • Structural geology, folding, faulting, fracturing, analysis of stress and strain, and rock mechanics; • Orogenesis, tectonism, thermochronology, surficial processes, land-climate interactions, and lithospheric-asthenospheric interactions; • Active tectonics, seismology, mechanisms of earthquakes and volcanism, geological hazards and their societal impacts; • Rheology and numerical modelling of geodynamic processes; • Laboratory measurements of physical and chemical parameters of crustal and mantle rocks, and their application to geophysics and petrology; • Innovative development, including testing, of new methods in geophysics and geodynamics. Tectonics (U.S.A. and Europe) 3.287 http://www.agu.org/journals/tc/ Tectonics contains original scientific contributions in analytical, synthetic, and integrative tectonics. Papers are restricted to the structure and evolution of the terrestrial lithosphere with dominant emphasis on the continents. The Eggs (Europe) http://www.the-eggs.org/ Newsletter of European Geosciences Union (E.G.U.) The Leading Edge (U.S.A.) http://library.seg.org/tle/ The Leading Edge complements Geophysics, SEG's peer-reviewed publication long unrivalled as the world's most respected vehicle for dissemination of developments in exploration and development geophysics. TLE is a gateway publication, introducing new geophysical theory, instrumentation, and established practices to scientists in a wide range of geoscience disciplines. Most material is presented in a semitechnical manner that minimizes mathematical theory and emphasizes practical applications. TLE also serves as SEG's publication venue for official society business.
Timeline of a mass extinction New evidence points to rapid collapse of Earth’s species 252 million years ago Since the first organisms appeared on Earth approximately 3.8 billion years ago, life on the planet has had some close calls. In the last 500 million years, Earth has undergone five mass extinctions, including the event 66 million years ago that wiped out the dinosaurs. And while most scientists agree that a giant asteroid was responsible for that extinction, there’s much less consensus on what caused an even more devastating extinction more than 185 million years earlier. The end-Permian extinction occurred 252.2 million years ago, decimating 90 percent of marine and terrestrial species, from snails and small crustaceans to early forms of lizards and amphibians. “The Great Dying,” as it’s now known, was the most severe mass extinction in Earth’s history, and is probably the closest life has come to being completely extinguished. Possible causes include immense volcanic eruptions, rapid depletion of oxygen in the oceans, and — an unlikely option — an asteroid collision. While the causes of this global catastrophe are unknown, an MIT-led team of researchers has now established that the end-Permian extinction was extremely rapid, triggering massive die-outs both in the oceans and on land in less than 20,000 years — the blink of an eye in geologic time. The researchers also found that this time period coincides with a massive buildup of atmospheric carbon dioxide, which likely triggered the simultaneous collapse of species in the oceans and on land. With further calculations, the group found that the average rate at which carbon dioxide entered the atmosphere during the end-Permian extinction was slightly below today’s rate of carbon dioxide release into the atmosphere due to fossil fuel emissions. Over tens of thousands of years, increases in atmospheric carbon dioxide during the Permian period likely triggered severe global warming, accelerating species extinctions. The researchers also discovered evidence of simultaneous and widespread wildfires that may have added to end-Permian global warming, triggering what they deem “catastrophic” soil erosion and making environments extremely arid and inhospitable. The researchers present their findings this week in Science , and say the new timescale may help scientists home in on the end-Permian extinction’s likely causes. “People have never known how long extinctions lasted,” says Sam Bowring, the Robert R. Schrock Professor of Earth, Atmospheric and Planetary Sciences (EAPS) at MIT. “Many people think maybe millions of years, but this is tens of thousands of years. There’s a lot of controversy about what caused , but whatever caused it, this is a fundamental constraint on it. It had to have been something that happened very quickly.” Rocks in a hard place Bowring worked with a group of American and Chinese researchers to pinpoint the extinction’s duration. The group analyzed volcanic ash beds from Meishan, a region in southern China where an old limestone quarry exposes rocks containing abundant fossils from the Permian period, as well as the very first fossils that signified a recovery from extinction, during the Triassic period. The rocks of the region have been widely studied as the best global example of the Permian-Triassic Boundary (PTB). The group collected clay samples from ash beds both above and below rock layers from the PTB. In the lab, they separated out zircon, a robust mineral that can survive intense geological processes. Zircon contains trace amounts of uranium, which can be used to date the rocks in which it is found. Bowring and his colleagues analyzed 300 of the “best-looking” grains of zircon, and found the rocks above and below the mass-extinction period spanned only a 20,000-year phase. Bowring says now that researchers are able to precisely date the end-Permian extinction, scientists will have to re-examine old theories. For example, many believe the extinction may have been triggered by large volcanic eruptions in Siberia that covered 2 million square kilometers of Earth — an area roughly three times the size of Texas. “In the old days you could say, ‘Oh, it’s about the same time, therefore it’s cause and effect,’” Bowring says. “But now that we can date to plus or minus 20,000 years, you can’t just say ‘about the same.’ You have to demonstrate it’s exactly the same.” ‘Something unusual going on’ The group also analyzed carbon-isotope data from rocks in southern China and found that within the same period, the oceans and atmosphere experienced a large influx of carbon dioxide. Dan Rothman, a professor of geophysics in EAPS, calculated the average rate at which carbon dioxide entered the oceans and atmosphere at the time, finding it to be somewhat less than today’s influx due to fossil fuel emissions. “The rate of injection of CO 2 into the late Permian system is probably similar to the anthropogenic rate of injection of CO 2 now,” Rothman says. “It’s just that it went on for … 10,000 years.” Rothman says the total amount of CO 2 pumped into Earth over this time period was so immense that it’s not immediately clear where it all came from. “It’s just not easy to imagine,” Rothman says. “Even if you put all the world’s known coal deposits on top of a volcano, you still wouldn’t come close. So something unusual was going on.” David Bottjer, professor of earth sciences and biological sciences at the University of Southern California, views the group’s results as strong evidence for one of the extinction’s most likely causes. “This is the most precise set of dates that have been produced for analysis of the end-Permian mass extinction,” Bottjer says. “Because these dates are analyzed in conjunction with geochemical and fossil information they provide unique evidence … that this mass extinction was probably caused by an enormous input of carbon dioxide into the atmosphere and oceans caused by volcanic eruptions.” http://web.mit.edu/newsoffice/2011/mass-extinction-1118.html
The production and use of non-hydropower renewable energy sources were up in recent years. Wind and biofuels consumption (the dark blue and red bars) increased about 16 times and 8 times, respectively, between 2000 and 2010. Overall consumption of renewable energy, including hydropower, represented about 8% of total energy consumption in the United States in 2010. Wind: Electricity generation from wind increased from about 6 billion kilowatthours in 2000 to about 95 billion kilowatthours in 2010. Improved technology has decreased the cost of producing electricity from wind. In addition, several policies contributed to growth in wind power: Federal production tax credits and grants provided financial incentives to entities that generate electricity using renewable technologies that are eligible for these programs. State-level Renewable Portfolio Standards (RPS) require electricity providers to generate or acquire a certain portion of their power supply from renewable sources. Over half of the states have enforceable renewable portfolio standards and mandated renewable capacity policies. Some states established voluntary goals for renewable generation. Compliance with RPS policies may require or allow for the trading of renewable energy credits (see RECs below). Establishment of renewable energy credits (RECs) , also known as green certificates, green tags, or tradable renewable certificates, created market mechanisms giving market participants new opportunities to transact for energy generated by renewable sources. RECs can be traded between two parties or through a third party, often a marketer. Biofuels: Biofuels such as ethanol and biodiesel are transportation fuels derived from biomass materials. Fuel ethanol from corn is the primary biofuel used in the United States. Biofuels are usually blended with petroleum fuels, such as gasoline and diesel fuel, but they can also be used on their own. In 2010, Americans consumed about 13 billion gallons of fuel ethanol, compared to less than 2 billion gallons in 2000. About 99% of this fuel ethanol was added to gasoline in mixtures up to 10% ethanol and 90% gasoline. Nearly all gasoline sold in the United States contains some ethanol. Federal and state requirements and incentives encouraging the production and use of biofuels include: The Volumetric Ethanol Excise Tax Credit (VEETC) provides blenders with a 45-cent-per-gallon credit for each gallon of ethanol mixed with gasoline for use as a motor fuel. The federal "Renewable Fuels Standard" requires that 36 billion gallons of biofuels be used in the United States per year by 2022. Several states have their own renewable fuel standards or requirements. Biomass—biofuels, wood, and organic waste—is the largest single source of renewable fuel in the United States. However, when the types of biomass are considered as separate categories, hydroelectric power generation is the largest source of renewable energy. Hydroelectric generation increases in some years and decreases in others, primarily due to variation in the amounts of rainfall and snowfall in areas where major hydroelectric dams are located. http://www.eia.gov/todayinenergy/detail.cfm?id=3850
中国石油网消息 (通讯员雷娜 柯本喜) 2011年7月12日下午,美国普渡大学教授Maarten V de Hoop博士应邀到东方物探做技术交流,主要介绍其领导的GMIG (Geo-Mathematical Imaging Group)项目组近年研究成果。东方物探公司有关科技专家和相关研究单位的40余名技术人员参加了会议。 普渡大学(Purdue University)是美国顶尖的研究型大学之一,Maarten V de Hoop教授是该校计算和应用数学中心主任和GMIG项目负责人,在反演算法和数值分析研究上造诣颇深。De Hoop教授研究组针对频率域波动方程(Helmholtz方程)正演中的大型稀疏方程组,创造性地提出了HSS解法,该算法把大型稀疏方程组分解为一系列不同尺度的非稀疏方程组,从而极大地提高了计算效率,减少计算机内存需求,并且易于并行处理。鉴于此,可大大提高全波形反演运算速度,缩短计算时间,将进一步推动三维全波形反演技术的实用化。 http://news.cnpc.com.cn/system/2011/07/19/001341495.shtml
American Geophysical Union (U.S.A.) 美国地球物理联合会 The American Geophysical Union (AGU), which was established in 1919 by the National Research Council and for more than 50 years operated as an unincorporated affiliate of the National Academy of Sciences, is now a nonprofit corporation chartered under the laws of the District of Columbia. The Union is dedicated to the furtherance of the geophysical sciences through the individual efforts of its members and in cooperation with other national and international scientific organizations. http://www.agu.org/ Australian Society of Exploration Geophysicists (Australia)澳大利亚勘探地球物理学家学会 The Australian Society of Exploration Geophysicists (ASEG) is a learned society of approximately 1,200 members, embracing professional earth scientists specializing in the practical application of the principles of physics and mathematics to solve problems in a broad range of geological situations. http://www.aseg.org.au/ Balkan Geophysical Society (Balkan peninsula countries)巴尔干地球物理学会 The Balkan Geophysical Society is the collaboration of Albanian Geophysical Society, Bulgarian Geophysical Society, Hellenic Geophysical Union, Association of Hungarian Geophysicists, Romanian Society of Geophysics, The Chamber of Geophysical Engineers of Turkey and Association of Geophysicists of Serbia http://www.balkangeophysoc.gr/ Environmental and Engineering Geophysical Society (U.S.A.)美国环境与工程地球物理学会 The Environmental and Engineering Geophysical Society (EEGS) is an applied scientific organization founded in 1992. The mission is to promote the science of geophysics especially as it is applied to environmental and engineering problems; to foster common scientific interests of geophysicists and their colleagues in other related sciences and engineering; to maintain a high professional standing among its members; and to promote fellowship and cooperation among persons interested in the science. http://www.eegs.org/ European Association of Geoscientists Engineers (Europe)欧洲地球科学家与工程师学会 EAGE is a professional association for geoscientists and engineers. Founded in 1951, it is an organization with a worldwide membership providing a global network of commercial and academic professionals. The association is truly multi-disciplinary and international in form and pursuits. All members of EAGE are professionally involved in (or studying) geophysics, petroleum exploration, geology, reservoir engineering, mining and civil engineering. The EAGE operates two divisions: the Oil Gas Geoscience Division and the Near Surface Geoscience Division. http://www.eage.org/ European Geosciences Union (Europe)欧洲地球科学联合会 European Geosciences Union (EGU), founded in 2002 as a merger of the European Geophysical Society (EGS) and the European Union of Geosciences (EUG), is a dynamic, innovative, and interdisciplinary learned association devoted to the promotion of: the sciences of the Earth and its environment and of planetary and space sciences; cooperation between scientists. http://www.egu.eu/ Royal Astronomical Society (U.K.)英国皇家天文学会 The Royal Astronomical Society (RAS), founded in 1820, encourages and promotes the study of astronomy, solar-system science, geophysics and closely related branches of science. http://www.ras.org.uk/ Seismological Society of America (U.S.A.)美国地震学会 The Seismological Society of America (SSA) is an international scientific society devoted to the advancement of seismology and its applications in understanding and mitigating earthquake hazards and in imaging the structure of the earth. http://www.seismosoc.org/ Society of Exploration Geophysicists (U.S.A)美国勘探地球物理学家学会 The Society of Exploration Geophysicists (or SEG) is a nonprofit organization dedicated to promoting the science of geophysics and the education of exploration geophysicists. http://www.seg.org/
秘鲁 Cotahuasi 峡谷是世界上最深的峡谷,深度为3354米,是美国大峡谷的2倍左右深(Grand Canyon:1737米).美国最深的峡谷也不是大峡谷(Grand Canyon),而是地狱峡谷(Hells Canyon),深度为2436米. Satellite image of southwestern Peru. The Pacific ocean is in the southwest corner of the mage but covered by a layer of white stratus clouds. Two deep canyons can be seen in the image. The eastern canyon was cut by the Rio Camana river and the western canyon was cut by the Rio Ocona. The large white area between these canyons is the snow-capped peak of Nudo Coropuna, a stratovolcano. At an elevation of 6617 meters it is the highest mountain in the Cordillera Occidental. The snowcap to the west is on Nevado Solimana, another stratovolcano at an elevation of 6117 meters. The main tributary of the Rio Ocona is the Rio Cotahuasi. The bottom of the Cotahuasi Canyon is 3354 meters below the top of the adjacent plateau. NASA Image http://geology.com/records/deepest-canyon.shtml
世界有史以来最大的地震是1960年智利瓦尔迪维亚省遭遇里氏9.5级地震,系自1900年有记录以来全世界发生的最强烈地震,致死1655人。那次地震继而触发海啸,波及夏威夷群岛、日本和菲律宾群岛。 World's Largest Recorded Earthquake 9.5 Magnitude - May 22, 1960 near Valdivia, Chile "The Great Chilean Earthquake" The World’s largest earthquake with a instrumentally documented magnitude occurred on May 22, 1960 near Valdivia, in southern Chile. It has been assigned a magnitude of 9.5 by the United States Geological Survey. It is referred to as the "Great Chilean Earthquake" and the "1960 Valdivia Earthquake. The United States Geological Survey reports this event as the "largest earthquake of the 20th Century". Other earthquakes in recorded history may have been larger, however this is the largest earthquake that has occurred since accurate estimates of magnitude became possible in the earnly 1900's. Local Damage from Ground Motion and Tsunamis The earthquake occurred beneath the Pacific Ocean off the coast of Chile. Ground motion from this earthquake destroyed and damaged many buildings. The Chilean government estimated that about 2,000,000 people were left homeless. It was fortunate that the earthquake occurred in the middle of the afternoon and was preceded by a powerful foreshock. That foreshock frightened everyone from their buildings, placing them outside when the main earthquake occurred. Most of the damage and deaths were caused by a series of tsunamis that were generated by the earthquake. These waves swept over coastal areas moments after the earthquake occurred. They tore buildings from their foundations and drowned many people. There are many different casualty estimates for this earthquake. They range from a low of 490 to a high of "approximately 6000". Most of the casualties were caused by tsunamis in Chile and from ground motion. However, people as far away as the Philippines were killed by this event. Tsunami Damage This is one of the few earthquakes that has killed large numbers of people at distant locations. Tsunamis generated by the earthquake traveled across the Pacific Ocean at a speed of over 200 miles per hour. Changes in sealevel were noticed all around the Pacific Ocean basin. Fifteen hours after the earthquake a tsunami with a runup of 35 feet swept over coastal areas of Hawaii. Many shoreline facilities and buildings near coastal areas were destroyed. Near Hilo, Hawaii, 61 people were reported killed by the waves. In California, many small boats were damaged as the waves swept through marinas. At Crescent City, a wave had a runup of about 5 feet and caused damage to shoreline structures and small boats. Waves up to 18 feet high hit the island of Honshu, Japan about 22 hours after the earthquake. There it destroyed more than 1600 homes and left 185 people dead or missing. Another 32 people were killed in the Philippines about 24 hours after the earthquake. Damage also occurred on Easter Island and Samoa. Subsidence and Uplift The United States Geological Survey reports that there was about five feet of subsidence along the Chilean coast from the south end of the Arauco Peninsula to Quellon on Chiloe Island. This left a number of buildings below waterlevel at high tide. As much as ten feet of uplift occurred at Isla Guafo. Tectonics This was a megathrust earthquake that occurred at a depth of about 20 miles where the Nazca Plate is subducting beneath the South American Plate. It produced a 500 mile long rupture zone extending from Talca, Chile to the Chiloe Archipelago. Numerous large earthquakes have occurred in this area before and after the May 22, 1960 event. Damage in Hawaii (Quoted from: Tsunami in Hawaii . Lander, James F., and Lockridge, Patricia A., 1989, in: United States Tsunamis 1690-1988 : U.S. Dept. of Commerce, National Oceanic and Atmospheric Administration.) "A devastating earthquake (magnitude 8.6) off the coast of central Chile generated a tsunami affecting the entire Pacific Basin. In general the wave action along Hawaiian shores was quiet, resembling that of the tide, although it had a shorter period and a greater range. It killed 61 and seriously injured 43. In Hilo Bay, however, the third wave was converted into a bore that flooded inland to the 6 m contour. Nearly 240 hectares (600 acres) inland of Hilo harbor were inundated, and all the deaths and $23.5 million of the damage occurred in this area. (The estimates of damage in Hawaii vary from $75 million in Talley and Cloud (1962), to $20 million in Wall (1960). A total of about $24 million for Hawaii is given by the Hawaiian office of Civil Defense.) In nearly half of this area total destruction occurred. In the area of maximum destruction, only buildings of reinforced concrete or structural steel, and a few others sheltered by these buildings, remained standing--and even these were generally gutted. Frame buildings either were crushed or floated nearly to the limits of flooding. Dozens of automobiles were wrecked; a 10-metric ton tractor in a showroom was swept away; heavy machinery, mill rollers, and metal stocks were strewn about. Rocks weighing as much as 20 metric tons were plucked from a sea wall and carried as far as 180 m inland. Damage elsewhere on the Island of Hawaii was restricted to the west and southern coasts, where about a dozen buildings, mostly of frame construction, were floated off their foundations, crushed, or flooded. There was half a million dollars of damage on the Kona coast alone. Six houses were destroyed at Napoopoo. On Maui the damage was concentrated in the Kahului area on the north coast. A warehouse and half a dozen houses were demolished, and other warehouses, stores, offices, and houses, and their contents were damaged. A church floated 6.1 m away from its foundation. Other buildings were damaged at Paukukalo, just outside and west of the harbor. At Spreckelsville and Paia, east of Kahului, houses were damaged, and one house at each place was demolished. Additional damage occurred at Kihei on the south coast and Lahaina on the west coast. On the island of Molokai there was some damage to houses, fish ponds, and roads, and a beachhouse was demolished on the Island of Lanai. The islands of Kauai and Oahu escaped with only minor damage. Fifty houses at Kuliouou, an eastern suburb of Honolulu, were flooded, and $250,000 in damage was done. Elsewhere on Oahu no damage was reported, even where there was inundation of areas occupied by houses. On Kauai, so far as is known, the only damage consisted of one frame building being floated off its foundation on the south coast. " Damage in California (Quoted from: Tsunami on West Coast of United States . Lander, James F., and Lockridge, Patricia A., 1989, in: United States Tsunamis 1690-1988 : U.S. Dept. of Commerce, National Oceanic and Atmospheric Administration.) "The largest wave height in California was measured at the Crescent City tide gage was 1.7 m. Waves of 1.5 m were observed at Stenson Beach. The amplitude was more than 1.4 m at Santa Monica. The amplitude at Port Hueneme was 1.3 m and 1.2 m at Pacifica. The tsunami was recorded widely along the Pacific coast with amplitudes less than 1 m. Two vessels valued at $30,000 were lost at Crescent City. Major damage was reported in the Los Angeles and Long Beach harbors. An estimated 300 small craft were set adrift and about 30 sunk including a 24 m yacht which smashed into bridge piers partially disabling the bridge. The Yacht Center lost 235 boat landing slips and 110 more were destroyed at the Colonial Yacht Anchorage and Cerritos Yacht Anchorage for a loss of $300,000. A skin diver, Raymond Stuart, was missing and presumed drowned at Cabrillo Beach, but no death certificate was found. In the harbor currents estimated to be 22 km/hr snapped and washed out pilings. Many thousands of liters of gasoline and oil spilled from the overturn of the boats prompting fears of a fire. Several buoys and navigational aids were swept away at Terminal Island. The Coast Guard landing including the tide gage was washed 5.6 km to sea but was rescued. A mess boy fell 6 m from the bridge of the first ship to attempt to leave the harbor the next day. The ship returned to harbor so his injuries could be treated at the hospital. The accident was blamed on rough seas. At San Diego, ferry service was interruped after one passenger-laden ferry smashed into the dock at Coronado knocking out eight pilings. A second ferry was forced 1.5 km off couse and into a flotilla of anchored destroyers. More than 80 m of dock were destroyed. A 100 ton dredge rammed the concrete pilings supporting the Mission Bay bridge tearing out a 21 m section. A 45 m bait barge smashed eight slips at the Seaforth Landing before breaking in half and sinking. The currents swept 12 and 30 m floats from the San Diego Harbor Masters Pier on Shelter Island and swept away two sections of dockage at the Southwest Yacht Club at Point Loma. At Santa Monica the water fell so low that the bottom of the breakwater was nearly exposed. Eight small craft snapped mooring lines but were taken in tow. One surge swept more than 91 m up the beach flooding a parking lot just off the Pacific coast Highway. At Santa Barbara a drifting oil exploration barge repeatedly rammed the new dredge causing at least $10,000 in damage. An additional $10,000 was done elsewhere including damage to 40 small craft set adrift there." http://geology.com/records/largest-earthquake/
世界上最深的海沟——马里亚那海沟(平均深度8000米,距离日本列岛最近处不过200公里) The Greatest Ocean Depth: Challenger Deep in the Mariana Trench is the deepest point in Earth's oceans. The bottom there is 10,924 meters (35,840 feet) below sea level. If Mount Everest, the highest mountain on Earth, were placed at this location it would be covered by over one mile of water. The Challenger Deep is named after the British survey ship Challenger II, which discovered this deepest location in 1951. Map of the Mariana Trench - Deepest Point in Earth's Oceans - Image by CIA Exploring the Challenger Deep The Challenger Deep was first explored by Jacques Piccard and Don Walsh in the Trieste bathyscaphe in 1960 . They reached a depth of 10,916 meters (35,814 feet). In 2009 researchers from Woods Hole Oceanographic Institution completed the deepest dive by an unmanned robotic vehicle in the Challenger Deep. Their Nereus robotic vehicle reached a depth of 10,902 meters. Why is the ocean so deep here? The Mariana Trench is located at a convergent plate boundary. Here two converging lithospheric plates collide with one another. At this collision point, one of the plates descends into the mantle. At the line of contact between the two plates the downward flexure forms a trough known as an ocean trench. An example of an ocean trench is shown in the diagram below. http://geology.com/records/deepest-part-of-the-ocean.shtml
Each of the brain’s 100 billion neurons forms thousands of connections with other neurons. These connections, known as synapses, allow cells to rapidly share information, coordinate their activities, and achieve learning and memory. Breakdowns in those connections have been linked to neurological disorders including autism and Alzheimer’s disease, as well as decline of memory during normal aging http://web.mit.edu/newsoffice/2011/artificial-synapses-1026.html
A receiver, which enables hydrocarbon indicators to be determined in a range of environments, being deployed by a specialist crane operator. Image courtesy of EMGS. Schematic view of a controlled source electromagnetic (CSEM) survey. Image courtesy of EMGS. An illustration of MMT surveying. A natural plane-wave source is represented by horizontal lines (+-+-), with higher frequencies being attenuated by the conductive water layer. Image courtesy of EMGS http://www.offshore-technology.com/features/featureno-stone-unturned-advanced-exploration-methods/
How far can wind power go toward reducing global carbon emissions from electricity production? With the world’s energy needs growing rapidly, can zero-carbon energy options be scaled up enough to make a significant difference? How much of a dent can these alternatives make in the world’s total energy usage over the next half-century? As the MIT Energy Initiative approaches its fifth anniversary next month, this five-part series takes a broad view of the likely scalable energy candidates. 引自: http://web.mit.edu/newsoffice/2011/energy-scale-part2-1025.html
CGGVeritas results from the combination of Compagnie Générale de Géophysique (CGG) and Veritas DGC Inc. (Veritas) in early 2007. Those two companies were pioneers in the advancement of geophysical exploration going back all the way to 1931. Here are a few highlights of the historical steps our Company has taken to become CGGVeritas today: 2010s 2011 CGGVeritas celebrates its 80th anniversary. 2010 Launch of BroadBand Seismic technology for recording broader bandwidths. 2000s 2009 CGGVeritas acquires Wavefield Inseis, a Norwegian pure-play seismic company. 2008 Record year, with net income at $503M and all financial objectives achieved. 2007 CGG and Veritas combine to create CGGVeritas , a leading global geophysical services and equipment company. 2006 CGG celebrates its 75th anniversary. CGG and Veritas DGC enter into a definitive merger agreement. 2005 Veritas DGC celebrates its 40th anniversary and acquires Hampson-Russell seismic interpretation software group. Veritas DGC builds new Global Processing Facility (powered by 64-bit AMD Opteron™ dual-core processors) in Houston, doubling its seismic data processing power. CGG launches Eye-D reservoir solutions service, and acquires Exploration Resources, increasing its fleet to 13 vessels. 2004 CGG launches WaveVista, wave equation depth imaging software. Sercel buys Thales Underwater Systems, Orca Instrumentation and Createch Industrie. David B. Robson retires from Veritas DGC; Thierry Pilenko takes over as Chairman and CEO. 2003 Sercel acquires Sodera, one of the main suppliers of airguns. 2002 CGG’s Kuala Lumpur data processing center becomes one of the Company’s three main regional hubs, after London and Houston. 2001 CGG purchases two seismic survey vessels and multi-client data from Aker Maritime. 2000 Veritas opens new headquarters building in Houston, U.S.A. and installs three more Data Visualization Centers in Crawley, U.K., Calgary, Canada, and Perth, Australia. 1990s 1999 Robert Brunck becomes Chairman and CEO of CGG. Sercel acquires Syntron, market leader in marine geophysical equipment. Veritas DGC acquires Time Seismic Exchange, a growing land seismic data library company in Canada, and Guardian Data Systems, a data archiving and transcription company based in Australia. 1998 CGG carries out offshore surveys in the Gulf of Mexico. Veritas DGC vessel, the SR/V Veritas Viking, sets record by towing the industry's first 12,000-meter streamer. Veritas DGC installs industry-first, new-generation Data Visualization Center in Houston, USA. 1997 CGG is listed on the New York Stock Exchange. Veritas DGC acquires Rees Geophysical (a land seismic acquisition company) in Oman. 1996 Digicon and Veritas combine to form Veritas DGC Inc. which immediately upgrades its asset base, installing new HP and SUN computer systems and an NEC SX-4 supercomputer to enhance data processing capabilities. 1994 CGG carries out first 4D seismic surveys. Digicon becomes the first geophysical company to offer pre-stack time migration (3D MOVES). 1993 CGG launches 3D seismic vessel ‘Harmattan’, able to tow five streamers. Veritas, now employing about 450 staff, goes public on the Toronto Stock Exchange. 1992 Veritas launches 'SAGE' data processing system, probably the most advanced production processing system available at this time. 1980s 1988 Digicon launches Massively Parallel Processing (MPP) initiative, including development of new SeismicTANGO data processing system to replace DISCO. 1987 Digicon records its first non-exclusive 3D marine data library program (in Mobile Bay, Gulf of Mexico). Hampson-Russell Software is founded in Calgary, Canada. 1984 In Massy, CGG installs the largest computer of the time, the Cray 1S. 1983 Digicon opens new data processing center in Brisbane, Australia - a significant expansion into new Asia Pacific markets. 1982 Veritas processes the industry's first-ever 3D seismic survey in Canada. 1981 CGG listed on Paris Stock Exchange and introduces combo crews (combined vibroseismic-explosive crews). Digicon employee John Sherwood invents DMO (Dip Move Out) data processing technique. 1980 Digicon develops and markets ‘DISCO’ seismic data processing software running on DEC's VAX 11/780 computer system. 1970s 1979 Digicon deploys the geophysical industry's first-ever digital marine seismic streamer - the DSS-240. Digicon becomes the first geophysical company to offer commercial depth migration. 1978 Veritas purchases FPS (Floating Point Systems) CPUs to replace Array Processors, achieving substantial increase in processing speed. CGG performs first 3D survey in the North Sea. 1977 CGG opens data processing center in Houston, USA. 1976 CGG opens data processing centers in London, UK, and Denver, USA. 1974 In Calgary, Rafael B. Cruz Associates Ltd. is purchased by David B. Robson and renamed Veritas , the Latin word meaning "truth". 1971 CGG introduces 3D seismic exploration with "wide-line profiling" and is the first contractor to tow three parallel streamers. Digicon opens second overseas data processing center in East Grinstead, U.K. 1970 Now with approximately 300 employees worldwide, Digicon opens its first overseas data processing center in Singapore. 1960s 1969 CGG develops a "migration" processing algorithm. Digital Consultants reincorporates as Digicon Inc. and goes public on the American Stock Exchange. 1968 In Calgary, CGG opens first data processing center outside France. Sercel launches the SN 328 (48-trace digital amplifier). 1967 CGG installs EMR computers. Digital Consultants deploys its first land seismic crew. 1966 CGG opens first seismic data processing center in Massy, France. Digital Consultants install state-of-the-art SDS-9300 computer that allowed multi-trace, multi-task programming without tape output. First marine project - QC work onboard two wooden-hulled marine seismic vessels in the North Sea, where WWII mines were still drifting! 1965 Digital Consultants Inc. is founded in Houston by six engineers and geophysicists who share the vision of bringing evolving digital computing technology to the geophysical industry - a new concept. The Company carries out its first data interpretation job in the North Sea. 1964 Early days of single-vessel seismic exploration. 1963 Introduction of "deconvolution" in data processing. 1962 SMG is renamed Sercel and introduces the AS 626 (24-trace transistor amplifier). 1960 CGG uses "multiple coverage" technology to analyze traces, and develops "Dropter", the first non-explosive seismic source technique. 1950s 1958 Dual-vessel seismic exploration. 1956 SMG is created as an offshoot of the electronics department of CGG. 1954 CGG buys its first IBM 604 computer and acquires an MT4 analogue computing center (for processing field data). 1953 CGG becomes a limited liability company. Discovery of reserves at Parentis, France. 1940s 1949 French crews survey the Gabon forest on behalf of SPAEF. 1947 First seismic surveys in the Aquitaine basin . 1930s 1932 First CGG survey in West Africa. 1931 Compagnie Générale de Géophysique (CGG) is founded. Marcel Champin becomes Chairman.
据 www.geology.com 网站报道,世界最严重石油泄漏事件主要起因于以下三个方面:1)战争;2)钻井失控;3)油船事故。 Gulf War Oil Spill (1991 - Kuwait) 1991年海湾战争科威特石油泄漏,估计泄漏11000000桶。 During the Gulf War, Iraqi forces invaded Kuwait. As they were being driven out by Coalition forces they opened pipeline valves at the Sea Island Oil Terminal, spilling the oil onto the ground. They also spilled the cargo of tankers into the Persian Gulf. During their retreat they set many fires at wells and pipeline terminals. It is impossible to determine the total volume of oil spilled but the total could be about 11,000,000 barrels ( 1 , 2 , 3 ). Lakeview Gusher (1910-11 - California, USA) 1910年美国加利福尼亚 Lakeview石油井喷。估计泄漏9,000,000桶 The Lakeview Gusher was an out-of-conrol oil well that spilled an estimated 9,000,000 barrels ( 4 , 5 ) of oil in Kern County, California. The well delivered oil faster than crews were able to route it into storage tanks. The pressurized well erupted like a geyser, spilling oil onto the ground for over one year until it played out naturally. Deepwater Horizon (2010 - Gulf of Mexico) 2010墨西哥湾深水水平井石油泄漏,估计泄漏四百九十万桶原油 。 The Deepwater Horizon Oil Spill is an ongoing spill in the Gulf of Mexico. It began on April 20, 2010 when an explosion destroyed the Deepwater Horizon drilling rig, causing a pressurized flow of oil near the wellhead on the Gulf of Mexico floor in over 5,000 feet of water. Numerous attempts to stop the leak in that difficult environment were partially successful. The well was finally killed on September 19, 2010. The amount of oil lost is unknown because accurate estimates can not be made from ocean floor video observations. The high estimate from the government-appointed Flow Rate Technical Group is 4.9 million barrels ( 6 ). Ixtoc (1979 - Gulf of Mexico) 1979墨西哥湾IXtoc油井泄漏,估计泄漏三百三十万桶原油 Ixtoc was an exploratory well being drilled by Pemex, Mexico's government-owned oil company, in the Bay of Campeche, Gulf of Mexico. It was located about 60 miles northwest of Ciudad del Carmen in water about 160 feet deep. The spill was triggered when the drilling rig lost mud circulation and pressure reduction on the reservoir triggered a blowout. The oil caught fire and the rig collapsed into the ocean. The estimated amount of oil spilled was 3.3 million barrels ( 7 , 8 ). Atlantic Empress (1979 - West Indies) 1979年在西印度群岛“大西洋皇后号”油船泄漏,估计泄漏2,123,800 桶原油 The Atlantic Empress was a Greek oil tanker that collided with another ship off the coast of Trinidad and Tobago on July 19, 1979. About 2,123,800 barrels of oil were spilled ( 9 ). Mingbulak (1992 - Uzbekistan) The Mingbulak oil spill occurred on March 2, 1992 at the Mingbulak oil field in the Fergana Valley of Uzbekistan. The spill was caused by a blowout that caught fire and burned for two months. About 2,110,000 barrels of oil were contained behind an emergency dam ( 10 ). ABT Summer (1991 - Atlantic Ocean) The ABT Summer was a tanker that was severely damaged by an explosion on May 28, 1991 off the coast of Angola. It was carrying a cargo of about 1,920,000 barrels of crude oil ( 11 ). The tanker sank in the Atlantic. Castillio de Bellver (1983 - Atlantic Ocean) The Castillio de Bellver was severely damaged by a fire on August 6, 1983 off the coast of South Africa with about 1,870,000 barrels of oil on board ( 12 ). The tanker washed aground and broke in two. The stern drifted from shore and sank in the Atlantic. Amoco Cadiz (1978 - Atlantic Ocean) The Amoco Cadiz was a very large crude carrier that encountered an extreme storm and ran aground on the coast of Brittany, France on March 16, 1978. The ship had about 1,600,000 barrels of oil onboard ( 13 ). A rip in the hull from the grounding started the spill. The ship broke up over the next few days, spilling most of the oil. MT Haven (1991 - Mediterranean) The MT Haven was a very large crude carrier that caught fire and sank in the Mediterranean Sea off the coast of Italy on April 11, 1991. It was carrying 1,140,000 barrels of crude oil ( 14 ). Odyssey (1988 - Mediterranean) They Odyssey was an oil tanker that sank off the coast of Nova Scotia, Canada on November 10, 1988. It was caught in a North Atlantic storm and was broken up by an on board explosion. It was carrying 977,000 barrels of crude oil ( 15 ). http://geology.com/articles/largest-oil-spills-map/
On October 13, 2011, Libya resumed natural gas exports to Italy via the 340-mile, Greenstream Pipeline (Greenstream), which is jointly owned by the Eni S.p.A. and the National Oil Company of Libya. Natural gas delivery imports to Sicily, Italy, at the Gela receipt point, are now about 150 million cubic feet per day (MMcf/d). http://www.eia.gov/todayinenergy/detail.cfm?id=3570
MIT林肯实验室的研究人员最近开发了一种新的雷达技术,可以隔墙(固体墙)提供实时视频。隔墙观景不再是科幻小说中的内容。这项技术在军事上和反恐领域、刑侦上无疑是一大好消息!但是如果用于非法领域那可能是一种“灾难”,人类还会有隐私吗? http://web.mit.edu/newsoffice/2011/ll-seeing-through-walls-1018.html The ability to see through walls is no longer the stuff of science fiction, thanks to new radar technology developed at MIT’s Lincoln Laboratory. Much as humans and other animals see via waves of visible light that bounce off objects and then strike our eyes’ retinas, radar “sees” by sending out radio waves that bounce off targets and return to the radar’s receivers. But just as light can’t pass through solid objects in quantities large enough for the eye to detect, it’s hard to build radar that can penetrate walls well enough to show what’s happening behind. Now, Lincoln Lab researchers have built a system that can see through walls from some distance away, giving an instantaneous picture of the activity on the other side. The researchers’ device is an unassuming array of antenna arranged into two rows — eight receiving elements on top, 13 transmitting ones below — and some computing equipment, all mounted onto a movable cart. But it has powerful implications for military operations, especially “urban combat situations,” says Gregory Charvat, technical staff at Lincoln Lab and the leader of the project. Waves through walls Walls, by definition, are solid, and that’s certainly true of the four- and eight-inch-thick concrete walls on which the researchers tested their system. At first, their radar functions as any other: Transmitters emit waves of a certain frequency in the direction of the target. But in this case, each time the waves hit the wall, the concrete blocks more than 99 percent of them from passing through. And that’s only half the battle: Once the waves bounce off any targets, they must pass back through the wall to reach the radar’s receivers — and again, 99 percent don’t make it. By the time it hits the receivers, the signal is reduced to about 0.0025 percent of its original strength. But according to Charvat, signal loss from the wall is not even the main challenge. “ amplifiers are cheap,” he says. What has been difficult for through-wall radar systems is achieving the speed, resolution and range necessary to be useful in real time. “If you’re in a high-risk combat situation, you don’t want one image every 20 minutes, and you don’t want to have to stand right next to a potentially dangerous building,” Charvat says. The Lincoln Lab team’s system may be used at a range of up to 60 feet away from the wall. (Demos were done at 20 feet, which Charvat says is realistic for an urban combat situation.) And, it gives a real-time picture of movement behind the wall in the form of a video at the rate of 10.8 frames per second. Filtering for frequencies One consideration for through-wall radar, Charvat says, is what radio wavelength to use. Longer wavelengths are better able to pass through the wall and back, which makes for a stronger signal; however, they also require a correspondingly larger radar apparatus to resolve individual human targets. The researchers settled on S-band waves, which have about the same wavelength as wireless Internet — that is, fairly short. That means more signal loss — hence the need for amplifiers — but the actual radar device can be kept to about eight and a half feet long. “This, we believe, was a sweet spot because we think it would be mounted on a vehicle of some kind,” Charvat says. Even when the signal-strength problem is addressed with amplifiers, the wall — whether it’s concrete, adobe or any other solid substance — will always show up as the brightest spot by far. To get around this problem, the researchers use an analog crystal filter, which exploits frequency differences between the modulated waves bouncing off the wall and those coming from the target. “So if the wall is 20 feet away, let’s say, it shows up as a 20-kilohertz sine wave. If you, behind the wall, are 30 feet away, maybe you’ll show up as a 30-kilohertz sine wave,” Charvat says. The filter can be set to allow only waves in the range of 30 kilohertz to pass through to the receivers, effectively deleting the wall from the image so that it doesn’t overpower the receiver. “It’s a very capable system mainly because of its real-time imaging capability,” says Robert Burkholder, a research professor in Ohio State University’s Department of Electrical and Computer Engineering who was not involved with this work. “It also gives very good resolution, due to digital processing and advanced algorithms for image processing. It’s a little bit large and bulky for someone to take out in the field,” he says, but agrees that mounting it on a truck would be appropriate and useful. Monitoring movement In a recent demonstration, Charvat and his colleagues, Lincoln Lab assistant staff John Peabody and former Lincoln Lab technical staff Tyler Ralston, showed how the radar was able to image two humans moving behind solid concrete and cinder-block walls, as well as a human swinging a metal pole in free space. The project won best paper at a recent conference, the 2010 Tri-Services Radar Symposium. Because the processor uses a subtraction method — comparing each new picture to the last, and seeing what’s changed — the radar can only detect moving targets, not inanimate objects such as furniture. Still, even a human trying to stand still moves slightly, and the system can detect these small movements to display that human’s location. The system digitizes the signals it receives into video. Currently, humans show up as “blobs” that move about the screen in a bird’s-eye-view perspective, as if the viewer were standing on the wall and looking down at the scene behind. The researchers are currently working on algorithms that will automatically convert a blob into a clean symbol to make the system more end-user friendly. “To understand the blobs requires a lot of extra training,” Charvat says. With further refinement, the radar could be used domestically by emergency-response teams and others, but the researchers say they developed the technology primarily with military applications in mind. Charvat says, “This is meant for the urban war fighter … those situations where it’s very stressful and it’d be great to know what’s behind that wall.”
本门课程的最后1次课,我们会组织大家进行课堂讨论。同学们分组就以下材料中的其中一部分进行文献调研,写出调研报告,准备5-8分钟的PPT汇报材料。希望同学们认真准备,组内同学认真讨论,增强团队精神,做出好的成果! 参考资料如下:(同学们还可在网上google新的资料) 1 Marine seismic source http://www.freepatentsonline.com/6639873.html 2 marine seismic streamer http://www.mitchamindustries.com/Products/detail.php?pId=116 seg_marine_hydrophones_streamer_cable.doc (SEG 1987)(点击只读就可以了,不要管密码) 3 marine seismic navigation http://www.slb.com/services/characterization/wireline_open_hole/borehole_seismic/seismic_navigation_positioning.aspx 4 Q-Marine A fully calibrated, point-receiver marine seismic acquisition system for locating, defining, and actively managing offshore reservoirs throughout field life. 5 Wide-Azimuth Innovative marine acquisition techniques such as multi-azimuth (MAZ), wide-azimuth (WAZ), and rich-azimuth (RAZ) are aimed at addressing the illumination problems inherent in traditional narrow-azimuth marine seismic. 6 Coil Shooting Coil Shooting single-vessel full-azimuth (FAZ) acquisition is a technique of acquiring marine seismic data while following a circular path—taking geophysics further by enhancing on current multi- and wide-azimuth techniques. 7 Dual Coil Shooting Dual Coil Shooting multivessel full-azimuth acquisition further extends the capabilities of the Coil Shooting technique by allowing acquisition of full-azimuth seismic data with very long offsets through the use of multiple vessels traveling in continuous circles. 8 DISCover DISCover deep interpolated streamer coverage, is designed to efficiently deliver 3D seismic data with an enhanced bandwidth, providing increases in both low frequencies for deeper penetration and high frequencies for improved resolution. 9 CLA — Continuous Line Acquisition CLA – Continuous Line Acquisition significantly increases the efficiency of marine seismic data acquisition operations by shooting and collecting data during vessel turns. 10 4D Seismic Technology WesternGeco differentiated technologies offer a complete 4D solution from feasibility studies to inversion and history matching. 11 Q-Seabed Q-Seabed technology delivers the highest-quality multicomponent data in the most efficient manner possible, with many years of experience to ensure the best results, every time. 12 Multicomponent Seismic Technology With more than eighty 4C surveys completed worldwide, proprietary 4C technology from WesternGeco provides high-quality and cost-effective multicomponent data that can reduce the cost of reservoir development. 13 Related services and products Environmental Excellence in Marine Operations
BGP launches new seismic vessel Published: Sep 23, 2011 Offshore staff ZHUOZHU HEBEI, China – BGP has launched its new 3D, 12-streamer seismic vessel BGP Prospector at Sekwang Heavy Industry in Korea. The vessel was built for high-end surveys and can tow as many as 12 8,000-m (5-mi) long streamers with 100 m (328 ft) separation, says BGP. When it enters service, it will be BGP’s flagship vessel. The vessel is designed by Lloyds (NVC 830 CD) with an overall length of 100 m (328 ft) and width of 24 m (79 ft). As one of the new NVC series, it has a typical endurance of 80 days and a cruising speed of 15 knots, Specifications: Main propulsion system diesel engine Bergen B32:40L8P; designed draught: 6.4 m; accommodation: 28 single and 19 double cabins; helideck: 23 m (75 ft) 15.6 ton (14 metric ton); work boats: 2 x 30 Norpower; and streamer winches. 09/23/2011 http://www.offshore-mag.com/index/article-display/2675384085/articles/offshore/geology-geophysics/asia-pacific/2011/september/bgp-launches_new_seismic.html?cmpid=EnlOSGeoOctober132011
俄罗斯拥有全球最大的天然气储量,煤炭储量全球第二,石油储量全球第八。(Russia holds the world's largest natural gas reserves, the second largest coal reserves, and the eighth largest crude oil reserves.) 2009年俄罗斯超过沙特成为世界第一大原油生产国。(Russia was the largest producer of crude oil in 2009, surpassing Saudi Arabia. ) 俄罗斯拥有全球最大的天然气储量,是全球第二大天然气生产国。(Russia has the largest natural gas reserves in the world and it is the second-largest producer of natural gas. ) 俄罗斯是全球发电量和电能消费最多的国家之一,220百万多千瓦的装机容量(Russia is one of the top producers and consumers of electric power in the world, with more than 220 million kilowatts of installed generation capacity. ) http://www.eia.gov/countries/country-data.cfm?fips=RS
安哥拉是非洲第二大石油生产国。2010年安哥拉的石油产量相比2003年翻了一倍。安哥拉是美国第八大原油进口国,是中国第二大原油供应国。 Angola has emerged as Africa's second largest oil producer; its oil production has grown 147% since 2000. Angola is the eighth largest supplier of crude oil to the United States and the second largest crude supplier to China, according to data for January through July 2011. Angola is still rebuilding from a 27-year civil war that ended in 2002. Security issues remain, especially in the disputed oil-rich Cabinda exclave . Border disputes have halted some oil developments. 引自: http://www.eia.gov/todayinenergy/detail.cfm?id=3490
The Korea National Oil Corporation(韩国国家石油公司,简称KNOC) is the largest entity in the country's upstream sector with a daily production capacity of 50 thousand bbl/d in 2009 at its overseas production sites. KNOC has executed its strategic plan to develop into a top-50 oil company by 2012 with a production capacity of 300 thousand bbl/d and 2 billion barrels of oil and gas reserves. KNOC has pursued this goal through both acquisitions of overseas companies as well as cooperation with major international and national oil companies. 韩国国家石油公司在国内的勘探区块 韩国国家石油公司在国外的勘探区块 http://www.eia.gov/countries/cab.cfm?fips=KS
China produced almost half the world's coal in 2010, three times more than the United States, the world's second largest producer, and almost as much as the next 10 highest producing countries combined. While coal is found abundantly across the globe (outside of the Middle East), proven recoverable reserves and production are highly concentrated, with the top five producing nations accounting for over 75% of global production. The top coal producers have remained relatively consistent since 2000. Among the top five producers, only the fifth rank has changed; Indonesia's coal production grew 368% from 2000-2010, moving it from 10th globally to overtake Russia as the fifth largest producer. China also saw strong growth, increasing production by 188% over that time period. U.S. coal production, on the other hand, increased by only 1% from 2000-2010. Growth in global coal production was heavily concentrated among the top five producers. From 2000 to 2010, global coal production rose 66%, from five billion tons per year to over eight billion tons per year. However, combined production in the top five producing nations grew by 98% during this period, while production in the rest of the world grew by only 7% (see chart below). ( http://www.eia.gov/todayinenergy/detail.cfm?id=3350 )
Adam Guy Riess (born December 1969, Washington, D.C. ) is an American astrophysicist at Johns Hopkins University and the Space Telescope Science Institute and is widely known for his research in using supernovae as Cosmological Probes. Riess shared both the 2006 Shaw Prize in Astronomy and the 2011 Nobel Prize in Physics with Saul Perlmutter and Brian P. Schmidt for providing evidence that the expansion of the universe is accelerating ..( http://en.wikipedia.org/wiki/Adam_Riess ) Riess graduated from The Massachusetts Institute of Technology in 1992 where he was a member of the Phi Delta Theta fraternity. He received his PhD from Harvard University in 1996. Riess' PhD thesis was supervised by Robert Kirshner and resulted in measurements of over twenty new type Ia supernovae and a method to make Type Ia supernovae into accurate distance indicators by correcting for intervening dust and intrinsic inhomogeneities.( http://en.wikipedia.org/wiki/Adam_Riess ) Riess, now a professor of astronomy and physics at Johns Hopkins University, shares the prize with Brian Schmidt and Saul Perlmutter. Perlmutter and Schmidt each headed research teams that in 1998 presented evidence that expansion of the universe was accelerating. Riess was part of Schmidt’s international High-z Supernova Search Team. ( http://web.mit.edu/newsoffice/2011/riess-nobel-prize.html ) For almost a century, the universe had been known to be expanding as a consequence of the Big Bang about 14 billion years ago. However, the discovery that this expansion is accelerating was “astounding,” according to the Nobel committee.( http://web.mit.edu/newsoffice/2011/riess-nobel-prize.html Riess, Perlmutter and Schmidt also shared the $1 million Shaw Prize in Astronomy for discovering the acceleration of the universe’s expansion. Reiss, who was born in Washington, D.C., earned his PhD from Harvard in 1996, and was awarded a MacArthur “genius” grant in 2008. Riess is the 77th MIT-connected winner of the Nobel Prize. See all of MIT's winners at http://web.mit.edu/ir/pop/awards/nobel.html . He will also be on campus on Oct. 20 to deliver the Department of Physics's Pappalardo Distinguished Lecture .http://web.mit.edu/newsoffice/2011/riess-nobel-prize.html Curriculum Vitae–Adam Guy Riess( http://www.stsci.edu/~ariess/Awards.htm ) Office Johns Hopkins University 3400 North Charles Street Baltimore, MD 21218 (410) 516-4474 ariess@stsci.edu Education Harvard University, Ph.D., Astrophysics, 1996 Harvard University, A.M., Astrophysics, 1994 Massachusetts Institute of Technology, B.S, Physics, Minor in History 1992 Positions Held Johns Hopkins University, Professor of Physics and Astronomy, 2006 Space Telescope Science Institute, Assistant Astronomer 1999, Full Astronomer 2004 U.C. Berkeley, Miller Fellow, 1996-1999 Harvard University, Doctoral Student, 1992-1996 Lawrence Livermore National Laboratory, Research Associate, Summer 1992 Massachusetts Institute of Technology, Undergraduate Research Assistant, 1990-1992 Honors and Awards– Recognition by Peers Einstein Medal, 2011 Gilman Scholor, Johns Hopkins University, 2011 Thomson Reuters Citation Laureate, 2010 National Academy of Sciences, 2009 MacArthur Fellow, 2008 American Academy of Arts and Sciences, 2008 Kavli Frontier of Science Fellow, 2007 Gruber Prize in Cosmology, 2007 Shaw Prize, Hong Kong, 2006 Townes Prize in Cosmology, UC Berkeley, 2005 Raymond and Beverly Sackler Prize, Tel-Aviv University, 2004 International Academy of Astronautics, Laurels for Achievement Award, 2004 Helen B. Warner Prize, American Astronomical Society, 2003 Bok Prize, Harvard University, 2001 AURA Science Award, 2000 STScI Science Merit Award, 2000, 2001 Trumpler Award, Astronomical Society of the Pacific, 1999 Harvard GSAS Merit Fellow, 1995 Harvard Distinction in Teaching Award, 1994 Margaret Weyerhaeuser Jewett Memorial Fellowship, 1993 Phi Beta Kappa at MIT, GPA: 4.94/5.00 Honors and Awards– Public Recognition Discover Magazine “Twenty under 40”, 2008 Esquire Magazine “Best and Brightest” Award, 2003 Discover Magazine Innovator Award, Finalist, 2003 Time Magazine Innovator Award, 2000 Science Magazine’s Research “Breakthrough of the Year”, 1998 Supervised Students and Postdocs Dr. Steve Rodney, Postdoctoral Fellow, JHU, 2010-present Mr. Dan Scolnic, Graduate Student, JHU, 2007-present Dr. Mark Huber, Postdoctoral Fellow, JHU, 2007-present Dr. Andre Martel, Postdoctoral Fellow, JHU, 2006-present Miss. Bridget Faulk, Graduate Student, JHU, 2006-present Dr. Joao Souza, Postdoctoral Fellow, STScI, 2005-present Dr. Hubert Lampeitl, Postdoctoral Fellow, STScI, 2005-present Dr. Louis Strolger, Postdoctoral Fellow, STScI, 2002-2005 Mr. Josh Younger, Undergraduate Research Assistant, STScI, 2005 Mr. Chris Carpenter, Undergraduate Research Assistant, Harvard, 1996 Teaching, Communication, Service Johns Hopkins University, taught Physics 171.118, Spring 2008, 2009,2010,2011 Johns Hopkins University, taught Physics 171.112, Spring 2007 Scientific American Magazine, “From Slowdown to Speedup”, by A. G. Riess and M. S. Turner, February 2004 Decadal Survey Program Prioritization Panel, 2009 Johns Hopkins Astrophysics Faculty Search, Chair 2009 Johns Hopkins Discovery Working Group, co-chair, 2008 The Universe, NHK Japan, 2010 400 Years of The Telescope, NPR 2008 Hubbles Amazing Universe, National Geographic 2008 “Scientific American Frontiers”, Guest, PBS, 2004 “60 Minutes”, Guest, CBS, 2003 “Science Friday”, Guest, NPR, 2001 “NOVA”, Guest, PBS, 2000,2005 “Jim Lehrer News Hour”, Guest, PBS, 1998 “Headline News”, Guest, CNN, 1998 “Science Friday”, Guest, NPR, 1998 Most Important Publications Riess, A. G. et al. 1998, “Observational Evidence from Supernovae for an Accelerating Universe and a Cosmological Constant”, AJ, 116, 1009 Riess, A. G., et al. 2004, “Type Ia Supernova Discoveries at z 1 From the Hubble Space Telescope: Past Deceleration and Constraints on Dark Energy Evolution”, ApJ, 607, 665 Riess, A. G., Press, W. H., Kirshner, R. P. 1996, “A Precise Distance Indicator: Type Ia Supernova Multicolor Light Curve Shapes” ApJ, 473, 88 Riess, A. G., et al. 2007, “New Hubble Space Telescope Discoveries of Type Ia Supernovae at z 1: Narrowing Constraints on the Early Behavior of Dark Energy”, ApJ, 659, 98 Riess, A. G. et al., 2001, “The Farthest Known Supernova: Support for an Accelerating Universe and a Glimpse of the Epoch of Deceleration”, ApJ, 560, 49 Riess, A. G., Macri, L., Casertano, S., Sosey, M., Lampeitl, H., Ferguson, H. C., Filippenko, A. V., Jha, S. W., et al., A Redetermination of the Hubble Constant with the Hubble Space Telescope from a Differential Distance Ladder, 2009, ApJ, 699, 539 Riess, A. G., Macri, L., Casertano, S., Lampeitl, H., Ferguson, H. C., Filippenko, A. V., Jha, S. W., Li, W., et al., A 3% Solution: Determination of the Hubble Constant with the Hubble Space Telescope and Wide Field Camera 3, 2011, ApJ, 730, 119 Riess, A. G. et al., 1999, “BVRI Photometry of 22 Distant Type Ia Supernovae”, AJ, 117, 707
Researchers led by MIT professor Daniel Nocera have produced something they’re calling an “artificial leaf”: Like living leaves, the device can turn the energy of sunlight directly into a chemical fuel that can be stored and used later as an energy source.( http://web.mit.edu/newsoffice/2011/artificial-leaf-0930.html ) The 'artificial leaf,' a device that can harness sunlight to split water into hydrogen and oxygen without needing any external connections, is seen with some real leaves, which also convert the energy of sunlight directly into storable chemical form. Photo: Dominick Reuter
3000 BC The Mesopotamians of that era used rock oil in architectural adhesives, ship caulks, medicines, and roads. 2000 BC The Chinese refined crude oil for use in lighting and heating. 600–700 AD Arab and Persian chemists discovered that petroleum’s lighter elements could be mixed with quicklime to make Greek fire, the napalm of its day. 1750 A French military officer noted that Indians living near Fort Duquesne (now the site of Pittsburgh) set fire to an oil-slicked creek as part of a religious ceremony. As settlement by Europeans proceeded, oil was discovered in many places in northwestern Pennsylvania and western New York — to the frequent dismay of the well-owners, who were drilling for salt brine. Mid–1800s Expanding uses for oil extracted from coal and shale began to hint at the value of rock oil, encouraging the search for readily accessible supplies. 1859 Oil was first discovered when a homemade rig drilled down 70 feet and came up coated with oil. This rig was near Titusville (in northwestern Pennsylvania) and was owned by "Colonel" Edwin L. Drake. 1890s Mass production of automobiles began creating demand for gasoline. Before this, kerosene used for heating had been the main oil product. 1920 With 9 million automobiles in the United States, gas stations were opening everywhere. 1950–present With the growing use of automobiles, oil became our most used energy source . 1960 The Organization of Petroleum Exporting Countries ( OPEC ) was formed by Iran, Iraq, Kuwait, Saudi Arabia, and Venezuela. The group has since grown to include 11 member countries. 1970 Production of petroleum (crude oil and natural gas plant liquids) in the U.S. lower 48 States reached its highest level at 9.4 million barrels per day. Production in these States has been declining ever since. 1972 Oil well productivity for the Nation reached a high of 18.6 barrels per day per well. 1973 Referred to as the Arab Oil Embargo, several Arab OPEC nations embargoed, or stopped selling, oil to the United States and Holland to protest their support of Israel in the Arab-Israeli “Yom Kippur” War. Later, the Arab OPEC nations added South Africa, Rhodesia, and Portugal to the list of countries that were embargoed. Arab OPEC production was cut by 25 percent, causing some temporary shortages and the tripling of oil prices. Some filling stations ran out of gasoline, and cars had to wait in long lines for gasoline. 1973 In reaction to the Arab Oil Embargo of 1973, Congress passed laws that tried to protect consumers from gasoline shortages and high prices. The price controls of the Emergency Petroleum Allocation Act of 1973 were generally considered a failure, and they were later repealed. 1975 Congress passed the Energy Policy and Conservation Act of 1975 aimed at increasing oil production by giving price incentives. This act also created the Strategic Petroleum Reserve (SPR) and required an increase in the fuel efficiency (miles per gallon) of automobiles. 1978–80 The Iranian Revolution, which began in late 1978, resulted in a drop of 3.9 million barrels per day of crude oil production from Iran from 1978 to 1981. At first, other OPEC countries made up for the drop in Iranian production. In 1980, the Iran-Iraq War began, and many Persian Gulf countries reduced output as well. By 1981, OPEC production was about one-fourth lower than it had been in 1978, and prices had doubled. 1980–85 OPEC kept prices high by producing less oil. Saudi Arabia acted as a “swing producer,” cutting more production than any other OPEC country. But high prices caused less oil to be used. For example, cars became smaller, using less gasoline. The drop in oil consumption meant that less oil needed to be produced. Thus, oil production from Saudi Arabia fell from 9.9 million barrels per day in 1980 to 3.4 million barrels per day in 1985. 1981 The U.S. Government responded to the oil crisis of 1978-1980 by removing price and allocation controls on the oil industry. For the first time since the early 1970s, market forces (supply and demand) set domestic crude oil prices. 1986 In 1986, Saudi Arabia stopped holding back production, and other OPEC members increased production. This caused an oil glut, and prices were almost cut in half. Oil consumption grew quickly in the late 1980s because prices remained low. 1988 Alaska’s production at Prudhoe Bay peaked at 2.0 million barrels per day and fell to 1.0 million barrels per day in 1999. By then, U.S. total output had dropped to 7.8 million barrels per day, 31% below its peak. 1990–91 Iraq invaded Kuwait on August 2, 1990, causing crude oil and product prices to rise suddenly and sharply. Prices rose even higher when the United Nations (UN) limited the amount of oil that could be purchased from these countries. Between the end of July and August 24, 1990, the world price of crude oil climbed from about $16 per barrel to more than $28 per barrel. The price rose even higher in September, reaching about $36 per barrel. As UN troops began seeing military successes in Iraq, concerns about long-term supply problems were eased and oil prices dropped again. 1990 The Clean Air Act Amendments of 1990 required many changes to gasoline and diesel fuels to make them pollute less. The use of these cleaner fuels was phased-in during the 1990s. Since 1995, “reformulated” gasoline has been used in places with the worst pollution problems. Since 1993 For the first time, the United States imported more oil and refined products from other countries than it produced — owing to growing petroleum demand and declining U.S. production. 1997–98 The Asian financial crisis that occurred in 1997 had worldwide economic effects. As the Asian economies shrank, their demand for petroleum products declined. The slow demand for petroleum, along with the reluctance of OPEC to cut its production quotas, led to the plummet of oil prices in 1998. 2001 The Nation’s petroleum production measured an average of 11.0 barrels of oil per day per well, 41% below the 1972 peak. U.S. petroleum consumption reached 19.7 million barrels per day, an all-time high. Of every 10 barrels of petroleum consumed in the United States, more than 4 barrels were consumed in the form of motor gasoline. The transportation sector alone accounted for two-thirds of all petroleum used in the United States. To meet demand, crude oil and petroleum products were imported at the rate of 11.9 million barrels per day, while exports measured 1.0 million barrels per day. Net imports (imports minus exports) of crude oil and petroleum products more than doubled between 1985 and 2001. The five leading suppliers of petroleum to the United States that year were Canada, Saudi Arabia, Venezuela, Mexico, and Nigeria. 2005 The record-setting hurricane season of 2005 caused massive damage to the U.S. petroleum and natural gas infrastructure. The Gulf of Mexico, one of the nation's largest sources of oil and gas production, was dealt a one-two punch by Hurricanes Katrina and Rita during August and September. The Energy Policy Act of 2005 was passed. It required increased use of renewable fuels for transportation and new measures to reduce pollution from gasoline and diesel. Gasoline prices broke $3.00 per gallon for the first time. 2006 Refineries began using more ethanol, a renewable fuel, in response to the Energy Policy Act. 2008 For the first time, crude oil price broke $100 per barrel and gasoline prices broke $4.00 per gallon. EIA网站上给出了石油及其利用的历史轨迹,很客观,特别是认为中国人在公元2000以前就开始利用原油点灯和加热。同时还列举了与石油相关的重大事件,请大家参考! 2010 On April 20, 2010, an explosion and fire occurred on the offshore drilling rig Deepwater Horizon, which had been drilling an exploratory well in the Gulf of Mexico. The accident killed 11 crewmembers and left oil leaking from the unfinished well into the ocean for months. On May 27, 2010, Secretary of the Interior Salazar announced a 6-month hold or "moratorium" on deepwater drilling. 参考资料: http://www.eia.gov/kids/energy.cfm?page=tl_petroleum
The Gulf of Mexico area, both onshore and offshore, is one of the most important regions for energy resources and infrastructure. Gulf of Mexico offshore oil production accounts for 29 percent of total U.S. crude oil production and offshore natural gas production in the Gulf accounts for 12 percent of total U.S. production. Over 40 percent of total U.S. petroleum refining capacity is located along the Gulf coast, as well as almost 30 percent of total U.S. natural gas processing plant capacity. http://www.eia.gov/special/gulf_of_mexico/index.cfm 图中4个粉红色圆圈代表战略石油储备基地,墨西哥湾内的深红色散点是美国的油气平台
据EIA最近公布的国际能源展望2011的研究表明,到2035年中国和印度的能源消费将占世界的一半。 Strong economic growth leads China and India to more than double their combined energy demand by 2035, accounting for one-half of the world's energy growth according to EIA's recently released International Energy Outlook 2011 (IEO2011). The IEO2011 projects that China and India together will consume 31% of the world's energy in 2035, up from 21% in 2008. China, which surpassed the United States as the world's largest energy consumer in 2009, is the predominant driver of growing energy demand. By 2035, China's projected energy consumption is 68% higher than U.S. energy consumption. Global energy consumption grows 53% between 2008 and 2035, representing an average annual growth rate of 1.6%. Energy growth varies greatly between developed and developing countries. Energy demand in Organization for Economic Cooperation and Development (OECD) and non-OECD nations, which was nearly the same in 2007, diverges sharply in the projection as non-OECD growth further accelerates, averaging 2.3% per year compared to only 0.6% per year for OECD nations. At this rate, non-OECD nations account for 83% of global growth and consume 67% more energy than OECD nations by 2035, although their energy consumption is still far lower on a per capita basis. Additional IEO2011 highlights include: World oil prices remain high, but consumption of petroleum and other liquids continues to grow; both conventional and unconventional liquid supplies are used to meet rising demand. Natural gas has the fastest growth rate (1.6%) among fossil fuels over the 2008-2035 projection period. China and, to a lesser extent, India and the other nations of non-OECD Asia consume coal in place of more expensive fuels in the Reference case, which assumes no policy changes that would restrict the use of coal. China alone accounts for 76% of the projected net increase in world coal use, and India and the rest of non-OECD Asia account for another 19% of the increase. Renewable energy is projected to be the fastest growing source of primary energy over the next 25 years, but fossil fuels remain the dominant source of energy. 参考资料 http://www.eia.gov/todayinenergy/detail.cfm?id=3130
An airplane’s digital flight-data recorder, or “black box,” holds massive amounts of data, documenting the performance of engines, cockpit controls, hydraulic equipment and GPS systems, typically at regular one-second intervals throughout a flight. Inspectors use such data to reconstruct the final moments of an accident, looking for telltale defects that may explain a crash. http://web.mit.edu/newsoffice/2011/black-box-analysis-0912.html 飞机“黑匣子”什么样子?
According to Oil and Gas Journal (OGJ), the U.K. had 2.9 billion barrels of proven crude oil reserves in 2011, the most of any E.U. member country. In 2010, the U.K. produced 1.4 million barrels per day (bbl/d) and consumed 1.6 million bbl/d of oil. ( http://www.eia.gov/countries/cab.cfm?fips=UK ) 2000年-2012年英国石油产量与石油消费对比图 2010年英国石油出口(左)与进口国家分布图,石油主要从挪威进口
Source: U.S. Energy Information Administration, International Energy Statistics . Note: Latest data available for the U.S. are 2009, international data are 2008. Coal reserves are relatively stable from year to year. Download CSV Data The United States leads the world with over 260 billion short tons of recoverable coal reserves—28% of total global reserves and 50% more than Russia, which possesses the world's second largest reserves. Despite significant U.S. coal production since the industrial revolution , recoverable domestic coal reserves at current mining levels would last 222 years. Coal reserves are reported by coal types : bituminous and anthracite (46%), subbituminous (41%), and lignite (12%). Appalachia is the largest producer of bituminous and anthracite coal, while large quantities of subbituminous coal are produced in the Powder River Basin (covering much of Wyoming , as well as parts of Montana). Texas leads lignite production. http://www.eia.gov/todayinenergy/detail.cfm?id=2930 #
As part of its Energy and Financial Markets Initiative, EIA is assessing the various factors that may influence oil prices — physical market factors as well as those related to trading and financial markets. This website describes 7 key factors that could influence oil markets. The analysis explores possible linkages between each factor and oil prices, and includes regularly-updated graphs that depict aspects of those relationships. EIA's traditional coverage of physical fundamentals such as energy consumption, production, inventories, spare production capacity, and geopolitical risks continues to be essential. EIA is also assessing other influences, such as futures market trading activity, commodity investment, exchange rates, and equity markets, as it seeks to fully assess energy price movements. This analysis was published on June 16, 2011 and covers the period from 2000 forward. Several charts include projections through 2012 from EIA's Short Term Energy Outlook . Charts are updated with new data on a monthly, quarterly, and annual basis according to the schedule below. The analysis will be updated as needed. Feedback is welcome and can be submitted via the feedback form at the bottom of every page on this site. http://www.eia.gov/finance/markets/
The United States consumed 19.1 million barrels per day (MMbd) of petroleum products during 2010, making us the world's largest petroleum consumer. The United States was third in crude oil production at 5.5 MMbd. But crude oil alone does not constitute all U.S. petroleum supplies. Significant gains occur, because crude oil expands in the refining process, liquid fuel is captured in the processing of natural gas, and we have other sources of liquid fuel, including biofuels. These additional supplies totaled 4.2 MMbd in 2010. In 2010 the United States imported 11.8 million barrels per day (MMbd) of crude oil and refined petroleum products. We also exported 2.3 MMbd of crude oil and petroleum products during 2010, so our net imports (imports minus exports) equaled 9.4 MMbd. Petroleum products imported by the United States during 2010 included gasoline, diesel fuel, heating oil, jet fuel, chemical feedstocks, asphalt, and other products. Still, most petroleum products consumed in the United States were refined here. Net imports of petroleum other than crude oil were 2% of the petroleum consumed in the United States during 2010. About Half of U.S. Petroleum Imports Come from the Western Hemisphere Some may be surprised to learn that 49% of U.S. crude oil and petroleum products imports came from the Western Hemisphere (North, South, and Central America, and the Caribbean including U.S. territories) during 2010. About 18% of our imports of crude oil and petroleum products come from the Persian Gulf countries of Bahrain, Iraq, Kuwait, Qatar, Saudi Arabia, and United Arab Emirates. Our largest sources of net crude oil and petroleum product imports were Canada and Saudi Arabia. Sources of Net Crude Oil and Petroleum Product Imports: Canada (25%) Saudi Arabia (12%) Nigeria (11%) Venezuela (10%) Mexico (9%) It is usually impossible to tell whether the petroleum products you use came from domestic or imported sources of oil once they are refined. Reliance on Petroleum Imports has Declined U.S. dependence on imported oil has dramatically declined since peaking in 2005. This trend is the result of a variety of factors including a decline in consumption and shifts in supply patterns. 2 The economic downturn after the financial crisis of 2008, improvements in efficiency, changes in consumer behavior and patterns of economic growth, all contributed to the decline in petroleum consumption. At the same time, increased use of domestic biofuels (ethanol and biodiesel), and strong gains in domestic production of crude oil and natural gas plant liquids expanded domestic supplies and reduced the need for imports. http://www.eia.gov/energy_in_brief/foreign_oil_dependence.cfm
Source: U.S. Energy Information Administration, Form EIA-860 Annual Electric Generator Report , and Form EIA-860M (see Table ES3 in the March 2011 Electric Power Monthly) Note: Data for 2010 are preliminary. Generators with online dates earlier than 1930 are predominantly hydroelectric. Data include non-retired plants existing as of year-end 2010. This chart shows the most recent (summer) capacity data for each generator. However, this number may change over time, if a generator undergoes an uprate or derate. Source: U.S. Energy Information Administration, Form EIA-860 Annual Electric Generator Report , and Form EIA-860M (see Table ES3 in the March 2011 Electric Power Monthly ) http://www.eia.gov/energy_in_brief/age_of_elec_gen.cfm Which types of power plants are oldest? The current fleet of electric power generators has a wide range of ages. The Nation's oldest power plants tend to be hydropower generators. Most coal-fired plants were built before 1980. There was a wave of nuclear plant construction from the late 1960s to about 1990. The most recent waves of generating capacity additions include natural gas-fired units in the 2000s and renewable units, primarily wind, coming online in the late 2000s. What is the age of U.S. generating capacity? About 530 gigawatts, or 51% of all generating capacity, were at least 30 years old at the end of 2010 (see chart below). Most gas-fired capacity is less than 10 years old, while 73% of all coal-fired capacity was 30 years or older at the end of 2010. The 'other' category includes solar, biomass, and geothermal generators, as well as landfill gas, municipal solid waste, and a variety of small-magnitude fuels such as byproducts from industrial processes (e.g., black liquor, blast furnace gas). What are the trends for each type of generator? Learn more about trends in generating capacity additions by fuel type in the following articles: Coal — Today in Energy , June 28, 2011 Nuclear — Today in Energy , June 30, 2011 Natural Gas — Today in Energy , July 5, 2011 Hydropower — Today in Energy , July 8, 2011 Wind — Today in Energy , July 13, 2011 Oil — Today in Energy , July 18, 2011
2011年8约17日google首页纪念费玛诞辰410周年 今天是法国业余数学家费玛(Pierre de Fermat)诞辰410周年.费玛时间最小原理在地震学和地震勘探中有举足轻重的应用作用。我们做地球物理的要感谢他的理论。费玛最短时间原理在地震学中的应用英文表述如下: 谷歌Doodle纪念皮耶·德·费玛:“业余数学家之王”( http://news.cnfol.com/110817/101,1587,10497441,00.shtml ) 北京时间2011年8月17日,刚过了12点,GOOGLE今天的Doodle又更新了。将鼠标移至今天的Doodle上方会发现这样一句话:“我发现了一个美妙的关于这个定理的证法 ,可惜这里 doodle 地方太小,写不下。” 这实际上是谷歌(GOOGLE)在用这种方式是纪念著名的业余数学家 皮耶·德·费玛的诞辰410周年。关于皮耶·德·费玛 Pierre de Fermat “业余数学家之王”皮耶·德·费玛Pierre de Fermat的故事: 皮耶·德·费玛(Pierre de Fermat)是一个17世纪的法国律师,也是一位业余数学家。之所以称皮耶·德·费玛「业余」,是由于皮耶·德·费玛具有律师的全职工作。著名的数学史学家贝尔(E. T. Bell)在20世纪初所撰写的著作中,称皮耶·德·费玛为”业余数学家之王“。贝尔深信,费玛比皮耶·德·费玛同时代的大多数专业数学家更有成就。17世纪是杰出数学家活跃的世纪,而贝尔认为费玛是17世纪数学家中最多产的明星。费玛的父亲多米尼克·费玛(Dominique Fermat)是一位皮货商,同时也是波蒙特-洛门地区的第二执政官。皮耶·德·费玛的母亲克莱儿·德·隆格(Claire de Long)则出身于国会法官世家。费玛于1601年8月出生(于8月20日在波蒙特-洛门受洗),而父母一心要栽培皮耶·德·费玛成为地方首长。皮耶·德·费玛幼年在杜鲁斯求学,30岁时就任同一地的请愿委员,同年与露薏丝·隆格(Louise Long)结婚,育有三子二女,其中一个儿子克雷门·山缪·费玛(Clement Samuel Fermat)成了皮耶·德·费玛科研上的主要助手,并在费玛逝世后,整理出版了皮耶·德·费玛的工作成果。事实上,这份出版品也就是今日闻名已久的费玛最后定理之出处。 由于家境富裕,父亲特意给皮耶·德·费玛请了两个家庭教师,不入学校而在家里接受系统教育。小时后的费玛虽称不上是神童,却也相当聪明。费玛父亲比较开通,并不宠爱孩子,因此费尔玛学习十分努力,文科、理科都学得不差,不过,皮耶·德·费玛最喜欢的功课,还是数学。1617年,费玛准备考大学,父亲希望皮耶·德·费玛读法律,费玛也喜欢这门学科,所以没有多大的争议,就接受了父亲的安排。毕业后,费玛接受一个事务所的聘请,成了一名律师。由于工作认真,并热心于社会福利事业,30岁那年,皮耶·德·费玛被选为家乡-图卢兹的地方议会议员。 费玛洁身自好,并不汲汲于名利,因此,平时比较空闲。闲余时间,皮耶·德·费玛常看些古书,尤其爱读古希腊的数学名著。皮耶·德·费玛不时作些题目,并进行数学研究,与当时的数学名家,如巴斯卡、笛卡儿、渥里斯等人通信,交流心得体会。费玛虽说是一位业余的数学爱好者,但由于皮耶·德·费玛刻苦钻研,又敢于进行创造性的思考,所以取得的成果丰硕。皮耶·德·费玛在解析几何、数论、无穷小分析〈微积分之前身〉和概率论方面,都有重要之贡献。费玛私淑戴奥弗多斯,来研究数论,师从希腊几何学家,特别是阿波罗尼,来研究曲线,皮耶·德·费玛曾和其皮耶·德·费玛的人重建阿波罗尼失传的著作“On Plane Loci”。在代数上已有所得后,皮耶·德·费玛献身于曲线的学习,而写成《Ad Locos Planos et SolidosIsagoge》(平面和立体轨迹入门)一书。费玛对于轨迹的研究有一般性的方法,这是古希腊所未能办到的。我们不知皮耶·德·费玛的坐标几何是如何孕育出来的,皮耶·德·费玛对韦达利用代数解几何问题应是相当熟悉,但更可能的是皮耶·德·费玛将阿波罗尼的结论直接转换成代数式。在1638年笛卡儿发表其《La Ge`ome`trie》大作后的第二年,费玛寄给皮耶·德·费玛一份如何找切线的论文。皮耶·德·费玛与笛卡儿并列为解析几何的发明者。 检查极大和极小问题时,皮耶·德·费玛先使一代数方程的变数作微小的变动,然后使这变动消失。皮耶·德·费玛还运用无穷小的思想到求积问题上,已具今日微积分的雏形。这也是费玛的卓越成就之一,皮耶·德·费玛在牛顿出生前的13年,提出了有关微积分的主体概念。牛顿以及同时代的莱布尼兹共同探讨运动、加速、力、轨道以及应用数学上连续变化的理论,而这也是后世所称的微积分。在数论方面,一直到高斯提出皮耶·德·费玛的贡献之前,费玛的研究始终左右著数论的研究方向。皮耶·德·费玛写过许多关于数论的定理,但顶多只给予简略的证明,数论上有许多重要事项与费玛的名字相连,皮耶·德·费玛可说是近代数论的开创者。。皮耶·德·费玛的费玛大定理:“xn+yn=zn,n大于等于3时,没有正整数解“,成为古今数学一大谜,多少的数学家投入这个问题,但直到今日仍无法完全解决。德国数学家P.Wolfshehl在1908年过世时遗赠十万玛克给Gottingen大学里的德国科学学术院,悬赏能够解决费玛大定理的人。这奖金已吸引了数千人,然而没有一个人提出正确的证法。此问题误证之多,数学史上无出其右。 费玛和帕斯卡是概率论早期的创立者,本来概率论是因应保险事业的发展而产生,但刺激数学家思考概率论的一些特殊问题,往往来自赌博者的请求。皮耶·德·费玛与巴斯卡分享开创概率论的荣誉。 (完) http://baike.baidu.com/view/1227061.htm
T his summer, a few dozen Boston-area high school students chose to spend their mornings toiling away with a variety of materials to create working marvels of engineering. They’re this year’s participants in the Engineering Design Workshop, a month-long program that gives teenagers a hands-on experience with the joys and challenges of engineering. Director Ed Moriarty, an instructor at MIT’s Edgerton Center, hesitates to categorize the workshop’s main goal as anything other than “fun.” But if students manage to learn a few basic engineering principles along the way, then all the better, he says. Twenty-two students make up this year’s cohort, a number that has grown steadily over the last decade. Most come from the John D. O’Bryant School of Math and Science in the Roxbury Crossing neighborhood of Boston, but the group also includes several students from other local high schools. Moriarty says the camp is run on a “pay-what-you-can” basis, with the majority of students attending for free. Projects developed during the program vary widely from year to year, depending on the interests of the students. None of the activities are prescribed; instead, students take part in brainstorming sessions on the first day, and things develop from there. Typically, the “counselors” — a mix of undergraduate and graduate students from MIT and other local universities — present a few ideas, and the students decide which projects they’d most like to work on. “I don’t care what they end up doing. I just care that they care,” Moriarty says. This year, the 22 students divided themselves into five projects: a modified Razor scooter, equipped with a motor and brakes; a sound system of giant tower speakers; remote-controlled “anything” (which ended up including cars, fish, birds and even a flying turtle); a mosaic tiger meticulously assembled from pieces of stained glass; and an electric cello. Each student is allotted $100 to spend on materials for his or her group’s project; this way, projects that attract more students have a larger budget to work with. Counselors help them purchase supplies online and work with them on the construction from the ground up. Moriarty and the counselors agree that it’s mostly about the process and not the final result — but still, the workshop produces some impressive finished pieces. The modified Razor scooter can attain speeds of up to 30 miles per hour. The stained-glass tiger is slated to be installed in the lobby of the O’Bryant School during a special ceremony this fall. And last week, on the morning of the last day of camp, a happy group of campers listened to music on the finished pair of booming tower speakers. Ixchel Garcia, a 15-year-old sophomore who helped build the speakers, says the camp has reinforced her desire to pursue engineering as a career. When asked what her group would do with their product, she said they planned to leave the sound system as a gift for the lab. “MIT gave us this camp, so we wanted to give them something back.” http://web.mit.edu/newsoffice/2011/video-edgerton-workshop-0805.html
Bringing Digital Geology Back To Life Advancements in technology rooted in classic geologic concepts are giving mainstream geologists a whole new spectrum of interpretation tools. Bill Ross, Landmark For years, the development of modern digital technologies for geology and well log interpretation has lagged behind constantly evolving software tools for geophysics. It wasn’t so long ago, 2006 in fact, that former AAPG Distinguished Lecturer Cindy A. Yeilding of BP gave a popular talk at local society meetings titled “Is the workstation killing geology?” In it, she cited serious limitations of the digital workstation, including aesthetically pleasing maps that are not always geologically valid, failure to recreate best practices based on the first principles of geology, and the lack of stratigraphic interpretation tools for mainstream users. She was, however, optimistic that one day geologists would be able to create, iterate, collaborate, and capture their projects in a completely digital framework. The day Yeilding hoped for is finally dawning. In the years since she nailed the shortcomings of geologic software, dramatic progress has been made. New technologies like Landmark ’s Dynamic Frameworks to Fill capability – an integral part of the DecisionSpace Desktop environment – are bringing digital geology back to life. Next-generation interpretation and mapping tools designed specifically for mainstream geoscientists combine classic geologic concepts in sequence stratigraphy and structural geology with automated processes and intuitive interfaces to improve quality, efficiency, and performance. How? For one thing, technology workspaces enable geologists and geophysicists to build a properly sealed, three-dimensional “framework” of structural and stratigraphic surfaces, fault networks, and unconformities as a natural part of interpreting seismic and well data. They can interactively fill selected intervals with 2-D or 3-D reservoir properties computed automatically from well logs. And all it takes to generate consistent, high-quality structure or property maps from an integrated, multi-surface framework is a few clicks of the mouse. Now, mapping is a byproduct of accurate 3-D framework construction. What’s more, dynamic updating tools allow geologists to change an interpretation or add a new pick and watch every related part of the framework shift accordingly – without manual intervention. Saving a sealed framework with reservoir properties to a common project database makes it accessible to every member of the team through a unified, multi-discipline workspace. Geological and geophysical workflows in a digital environment like this leverage two new additional technologies built on classic geologic concepts. One of these is “conformance.” All geologists know that the majority of stratigraphic units comprising sedimentary basin fill are relatively parallel or “conformable.” That is, layer thicknesses tend to remain uniform over large areas. This fundamental principle represents a valuable tool that can assist geologists in correlating logs, identifying discontinuities – faults and unconformities – and building more accurate stratigraphic and structural frameworks. What modern conformance technology essentially does is use a well-sampled surface – a seismic horizon or marker bed with numerous well tops – as a reference to guide, or conform, the shape of poorly sampled surfaces above or below it. With conformance technology, geoscientists can interpret stratigraphic layers between wells at essentially the same lateral resolution as the most detailed surface available. Apart from picking tops or seismic, the process is automated. http://www.epmag.com/Magazine/2011/7/item85078.php
A warning for shale gas investors By Steve Hargreaves @ CNNMoney August 3, 2011: 5:22 AM ET Possible SEC investigation highlights how hard it is for investors to value emerging shale gas companies. NEW YORK (CNNMoney) -- Recent reports of an investigation by the Securities and Exchange Commission into whether shale gas companies are overstating their gas reserves highlights the challenges investors face in navigating this emerging sector. Last week a research note from the investment management firm Robert W. Baird, citing industry lawyers, said the SEC is looking into whether shale gas companies may be overestimating the amount of natural gas they hold beneath the ground. The investigation is most likely politically motivated and not entirely unwelcome, the note said, sparked by congressional calls for SEC action following a scathing report in the New York Times questioning the reserves held by some shale gas firms. "We view it as appropriate and expected for the SEC to evaluate compliance with new regulations if compliance is publicly questioned," Christine Tezak, an energy and environmental policy analyst at Baird, wrote in the note. "A regulatory investigation may provide a clearer investment horizon than a 'trial' in the press." The SEC would not confirm or deny if an investigation is underway. Extracting natural gas from shale is a relatively new phenomenon. It's been made possible in just the last few years thanks to advances in drilling technology and the broader use of hydraulic fracturing . Known as fracking, it's a controversial process that injects water, sand and chemicals deep into the ground to crack the shale rock and unleash the gas. The process has sparked concern over its effects on the water . The fracking public relations mess Gas from the Northeast's Marcellus shale, Texas's Barnett Shale and Arkansas' Fayettville Shale, among others, promises vast amounts of cleaner-burning fuel for the nation's energy use for decades to come. Its also caused the share price of firms involved in the space to surge over the last few years. But it may be hard for the SEC, the companies themselves, and investors in general to determine just how much gas these firms hold in the ground - a key metric in determining the stock price for any energy company. "The history of these wells is so limited," said Neal Dingmann, a Houston-based analyst at investment bank SunTrust Robinson Humphrey. "It's going to be a very touchy call to determine what you can book on these reserves." Dingmann said it's not uncommon for a shale gas well to see its production fall 70% in the first year. He said the hope is that they then continue to produce gas at the much slower but steadier rate over the next several decades. But until several decades pass, no one will really know for sure. Most analysts, including Dingmann, believe there is lots of gas there. So do the biggest names in the energy businesses. Exxon Mobil ( XOM , Fortune 500 ) would not have paid $40 billion for shale gas producer XTO last year if it thought the company was spinning a yarn when it came to its reserves. Interest in shale gas by other oil majors like BP ( BP ) and Chevron ( CVX , Fortune 500 ) continues, with the smaller shale firms like Chesapeake ( CHK , Fortune 500 ), Range ( RRC ), Devon ( DVN , Fortune 500 ) and EOG ( EOG , Fortune 500 ) the periodic subject of takeover talk. But the Times isn't the only one to question the viability of this resource. Petroleum geologist and noted oil-supply skeptic Arthur Berman has been arguing for years that shale gas estimates are overstated by at least 100%. "Shale gas in the U.S. is an important and permanent feature of supply," Berman wrote on his blog earlier this week. "But it will not fulfill mainstream expectations of either supply or cost." Retail investors should at least be aware of the debate.
Measuring Fractures – Quality and Quantity By BOB HARDAGE Click to Enlarge As has been emphasized in the three preceding articles of this series, when a shear (S) wave propagates through a rock unit that has aligned vertical fractures, it splits into two S waves – a fast-S (S1) mode and a slow-S (S2) mode. The S1 mode is polarized in the same direction as the fracture orientation; the S2 mode is polarized in a direction orthogonal to the fracture planes. This month we translate the principles established by laboratory experiments discussed in the preceding articles of this series into exploration practice. Figure 1 displays examples of S1 and S2 images along a profile that crosses an Austin Chalk play in central Texas. Click to Enlarge The Austin Chalk reflection in the S2 image occurs later in time than it does in the S1 image because of the velocity differences between the S1 and S2 modes that propagate through the overburden above the chalk. Subsurface control indicated fractures were present where the S2 chalk reflection dimmed but the S1 reflection did not. This difference in reflectivity strength of the S1 and S2 modes occurs because, as shown last month (June EXPLORER), when fracture density increases, the velocity of the slow-S mode becomes even slower. In this case, the S2 velocity in the high-fracture-density chalk zone reduces to almost equal the S-wave velocity of the chalk seal, which creates a small reflection coefficient at the chalk/seal boundary. When fracture density is small, S2 velocity in the chalk is significantly faster than the S-wave velocity in the sealing unit, and there are large reflection coefficients on both the S1 and S2 data profiles. Using this S-wave reflectivity behavior as a fracture-predicting tool, a horizontal well was sited to follow the track of a second S2 profile that exhibited similar dimming behavior for the Austin Chalk. The S2 seismic data and the drilling results are summarized on figure 2 . Data acquired in this exploration well confirmed fractures occurred across the two zones A and B where the S2 reflection dimmed and were essentially absent elsewhere. The seismic story summarized here is important whenever a rigorous fracture analysis has to be done across a prospect. If fractures are a critical component to the development of a reservoir, more and more evidence like that presented here is appearing that emphasizes the need to do prospect evaluation with elastic-wavefield seismic data that allow geology to be imaged with both P waves and S waves. The value of S-wave data is that the polarization direction of the S1 mode defines the azimuth of the dominant set of vertical fractures in a fracture population, and the reflection strength of the S2 mode, which is a qualitative indicator of S2 velocity, infers fracture density. The Earth fracture model assumed here is a rather simple one in which there is only one set of constant-azimuth vertical fractures. What do you do if there are two sets of fractures with the fracture sets oriented at different azimuths? That situation will be discussed in next month’s article. 转自AAPG 2011 july Explorer
MIT researchers have found a way to improve the energy density of a type of battery known as lithium-air (or lithium-oxygen) batteries, producing a device that could potentially pack several times more energy per pound than the lithium-ion batteries that now dominate the market for rechargeable devices in everything from cellphones to cars. The work is a continuation of a project that last year demonstrated improved efficiency in lithium-air batteries through the use of noble-metal-based catalysts. In principle, lithium-air batteries have the potential to pack even more punch for a given weight than lithium-ion batteries because they replace one of the heavy solid electrodes with a porous carbon electrode that stores energy by capturing oxygen from air flowing through the system, combining it with lithium ions to form lithium oxides. The new work takes this advantage one step further, creating carbon-fiber-based electrodes that are substantially more porous than other carbon electrodes, and can therefore more efficiently store the solid oxidized lithium that fills the pores as the battery discharges. "We grow vertically aligned arrays of carbon nanofibers using a chemical vapor deposition process. These carpet-like arrays provide a highly conductive, low-density scaffold for energy storage," explains Robert Mitchell, a graduate student in MIT's Department of Materials Science and Engineering (DMSE) and co-author of a paper describing the new findings in the journal Energy and Environmental Science . During discharge, lithium-peroxide particles grow on the carbon fibers, adds co-author Betar Gallant, a graduate student in MIT's Department of Mechanical Engineering. In designing an ideal electrode material, she says, it's important to "minimize the amount of carbon, which adds unwanted weight to the battery, and maximize the space available for lithium peroxide," the active compound that forms during the discharging of lithium-air batteries. "We were able to create a novel carpet-like material — composed of more than 90 percent void space — that can be filled by the reactive material during battery operation," says Yang Shao-Horn, the Gail E. Kendall Professor of Mechanical Engineering and Materials Science and Engineering and senior author of the paper. The other senior author of the paper is Carl Thompson, the Stavros Salapatas Professor of Materials Science and Engineering and interim head of DMSE. In earlier lithium-air battery research that Shao-Horn and her students reported last year, they demonstrated that carbon particles could be used to make efficient electrodes for lithium-air batteries. In that work, the carbon structures were more complex but only had about 70 percent void space. The gravimetric energy stored by these electrodes — the amount of power they can store for a given weight — "is among the highest values reported to date, which shows that tuning the carbon structure is a promising route for increasing the energy density of lithium-air batteries," Gallant says. The result is an electrode that can store four times as much energy for its weight as present lithium-ion battery electrodes. In the paper published last year, the team had estimated the kinds of improvement in gravimetric efficiency that might be achieved with lithium-air batteries; this new work "realizes this gravimetric gain," Shao-Horn says. Further work is still needed to translate these basic laboratory advances into a practical commercial product, she cautions. Because the electrodes take the form of orderly "carpets" of carbon fibers — unlike the randomly arranged carbon particles in other electrodes — it is relatively easy to use a scanning electron microscope to observe the behavior of the electrodes at intermediate states of charge. The researchers say this ability to observe the process, an advantage that they had not anticipated, is a critical step toward further improving battery performance. For example, it could help explain why existing systems degrade after many charge-discharge cycles. Ji-Guang Zhang, a laboratory fellow in battery technology at the Pacific Northwest National Laboratory, says this is "original and high-quality work." He adds that this research "demonstrates a very unique approach to preparing high-capacity electrodes for lithium-air batteries." http://web.mit.edu/newsoffice/2011/better-battery-storage-0725.html
据美国EIA报道,2009年和2010年美国本土电价最高的地区是纽约( http://www.eia.gov/todayinenergy/detail.cfm?id=2330 )。我们中国的电价地区差异有这么大吗?请知情者提供资料,谢谢! Wholesale electricity prices in New York City are the highest in the contiguous U.S. Wholesale, on-peak electricity prices in New York City are the highest in the contiguous United States. In 2010, the average day-ahead, on-peak spot price of electricity in New York City was $65 per megawatt hour, higher than in neighboring New England and Mid-Atlantic regions. There are three main reasons for higher prices in New York City: high-cost, in-city generation; often insufficient in-city generation to meet demand; and limited transmission capacity leading into the city. New York City imported approximately two-thirds of its power from outside the city limits in 2010. While the city has generating capacity equal to 80% of its annual peak load, many of these units are operated infrequently because it is usually less expensive to buy power produced outside the city. Transmission lines leading into the city are often congested when the amount of cheaper imported power reaches the limit of the transmission lines. Transmission congestion can also occur during thunderstorm alerts, where transmission capacity is curtailed into the city for reliability reasons. Since the cost of transmission congestion is reflected in wholesale prices in the New York Independent System Operator, or NYISO market, wholesale prices in New York City rise above those upstate. When demand for electricity grows in the city, the wholesale price goes up as more expensive units located in the city are dispatched to meet demand. The increased cost of generating electricity in the city is often driven by high natural gas prices resulting from pipeline congestion leading into the city. New York City is the only place in the country where generator price bids into RTO markets are routinely mitigated (bid replaced by a cost-based value calculated by the NYISO staff) to avoid the potential exercise of market power.
On Friday(2011.7.15) President Obama announced his intent to nominate Charles McConnell to serve as assistant secretary of the Department of Energy’s Office of Fossil Energy . This position is subject to Senate confirmation. Mr. McConnell currently serves the office as Chief Operating Officer. Below is Mr. McConnell’s biographical sketch provided by the White House . Charles McConnell, Nominee for Assistant Secretary for Fossil Energy, Department of Energy Charles McConnell is the Chief Operating Officer in the Office of Fossil Energy at the U.S. Department of Energy (DOE). Prior to joining DOE in 2011, Mr. McConnell served as Vice President of Carbon Management at Battelle Energy Technology from 2009-2011, with responsibility for business and technology management. He previously spent 31 years with Praxair, Inc., in various positions in the U.S. and Asia, including as Global Vice President. Mr. McConnell has held a number of advisory positions including chairmanships of the Gasification Technologies Council and the Clean Coal Technology Foundation of Texas. He has served on the FutureGen Advisory Board in Texas, the Gulf Coast Carbon Center, TP Syngas Company, the Pittsburgh Coal Conference and the Coal Utilization Research Council. Mr. McConnell holds a B.S. in Chemical Engineering from Carnegie-Mellon University and an M.B.A. in Finance from Cleveland State University.
水平井技术促进了页岩气产量提高 Rapid increases in natural gas production from shale gas formations resulted from widespread application of two key technologies, horizontal drilling and hydraulic fracturing. Horizontal drilling lets producers access far more natural gas from relatively thin shale deposits. In Texas' Barnett shale, the Nation's most developed shale play, the number of producing horizontal wells rose from fewer than 400 in 2004 to more than 10,000 during 2010. Click on the map above to see how horizontal drilling has displaced traditional vertical drilling since 1997 in the Barnett shale. As the animation shows, producers have drilled some horizontal wells within the city of Fort Worth, and even on the property of the Dallas-Fort Worth airport, where wells began to appear in 2007 (near the end of the animation). The sharpened focus on horizontal drilling has generated steady and significant increases in natural gas production (see chart below). Annual production from horizontal wells exceeded that from vertical wells for the first time in 2006, and presently accounts for about 90% of total Barnett natural gas production. Starting in the late 1990s, drilling in the Barnett grew rapidly, initially in the form of vertical wells. Since about 2003, however, the number of producing horizontal wells (red dots in the animation) has increased considerably, surpassing vertical wells (black dots) in 2007 and accounting for about 70% of producing wells in the Barnett during 2010. Shale deposits are typically thin layers of rock that cover a wide area. Horizontal drilling lets producers drill through a much greater extent of gas-producing rock in such a formation. Horizontal wells can traverse 5,000 feet or more of a given shale deposit, while a vertical well would simply go through the deposit, tapping only a small vertical layer of shale. When combined with hydraulic fracturing to break apart the relatively impermeable shale, horizontal wells allow considerably greater gas production than vertical wells, more than enough to make up for their greater expense. http://www.eia.gov/todayinenergy/detail.cfm?id=2170
The sheet of paper looks like any other document that might have just come spitting out of an office printer, with an array of colored rectangles printed over much of its surface. But then a researcher picks it up, clips a couple of wires to one end, and shines a light on the paper. Instantly an LCD clock display at the other end of the wires starts to display the time. Almost as cheaply and easily as printing a photo on your inkjet, an inexpensive, simple solar cell has been created on that flimsy sheet, formed from special “inks” deposited on the paper. You can even fold it up to slip into a pocket, then unfold it and watch it generating electricity again in the sunlight. Graduate student Miles Barr hold a flexible and foldable array of solar cells that have been printed on a sheet of paper. Photo: Patrick Gillooly The new technology, developed by a team of researchers at MIT, is reported in a paper in the journal Advanced Materials , published online July 8. The paper is co-authored by Karen Gleason, the Alexander and I. Michael Kasser Professor of Chemical Engineering; Professor of Electrical Engineering Vladimir Bulović; graduate student Miles Barr; and six other students and postdocs. The work was supported by the Eni-MIT Alliance Solar Frontiers Program and the National Science Foundation. The technique represents a major departure from the systems used until now to create most solar cells, which require exposing the substrates to potentially damaging conditions, either in the form of liquids or high temperatures. The new printing process uses vapors, not liquids, and temperatures less than 120 degrees Celsius. These “gentle” conditions make it possible to use ordinary untreated paper, cloth or plastic as the substrate on which the solar cells can be printed. It is, to be sure, a bit more complex than just printing out a term paper. In order to create an array of photovoltaic cells on the paper, five layers of material need to be deposited onto the same sheet of paper in successive passes, using a mask (also made of paper) to form the patterns of cells on the surface. And the process has to take place in a vacuum chamber. The basic process is essentially the same as the one used to make the silvery lining in your bag of potato chips: a vapor-deposition process that can be carried out inexpensively on a vast commercial scale. The resilient solar cells still function even when folded up into a paper airplane. In their paper, the MIT researchers also describe printing a solar cell on a sheet of PET plastic (a thinner version of the material used for soda bottles) and then folding and unfolding it 1,000 times, with no significant loss of performance. By contrast, a commercially produced solar cell on the same material failed after a single folding. “We have demonstrated quite thoroughly the robustness of this technology,” Bulović says. In addition, because of the low weight of the paper or plastic substrate compared to conventional glass or other materials, “we think we can fabricate scalable solar cells that can reach record-high watts-per-kilogram performance. For solar cells with such properties, a number of technological applications open up,” he says. For example, in remote developing-world locations, weight makes a big difference in how many cells could be delivered in a given load. http://web.mit.edu/newsoffice/2011/printable-solar-cells-0711.html
http://geology.com/press-release/deep-hydrocarbons/ Forming Hydrocarbons in the Deep Earth Extreme temperatures and pressures can convert methane into complex hydrocarbons Republished from a April 2011 press release by the Lawrence Livermore National Laboratory .
C an Hydrocarbons Form in the Mantle Without Organic Matter? Could Deep Source Hydrocarbons Migrate Up Into Oil and Gas Reservoirs? Republished from a Carnegie Institution press release, July 2009. This artistic view of the Earth's interior shows hydrocarbons forming in the upper mantle and transported through deep faults to shallower depths in the Earth's crust. The inset shows a snapshot of the methane dissociation reaction studied in this work. Image courtesy A. Kolesnikov and V. Kutcherov. Enlarge Image Deep Earth Hydrocarbons? The oil and gas that fuels our homes and cars started out as living organisms that died, were compressed, and heated under heavy layers of sediments in the Earth's crust. Scientists have debated for years whether some of these hydrocarbons could also have been created deeper in the Earth and formed without organic matter. Now for the first time, scientists have found that ethane and heavier hydrocarbons can be synthesized under the pressure-temperature conditions of the upper mantle -the layer of Earth under the crust and on top of the core. The research was conducted by scientists at the Carnegie Institution's Geophysical Laboratory, with colleagues from Russia and Sweden, and is published in the July 26, advanced on-line issue of Nature Geoscience . Methane (CH 4 ) is the main constituent of natural gas, while ethane (C 2 H 6 ) is used as a petrochemical feedstock. Both of these hydrocarbons, and others associated with fuel, are called saturated hydrocarbons because they have simple, single bonds and are saturated with hydrogen. High Temperatures and Pressures in a Lab Using a diamond anvil cell and a laser heat source, the scientists first subjected methane to pressures exceeding 20 thousand times the atmospheric pressure at sea level and temperatures ranging from 1,300 F° to over 2,240 F°. These conditions mimic those found 40 to 95 miles deep inside the Earth. The methane reacted and formed ethane, propane, butane, molecular hydrogen, and graphite. The scientists then subjected ethane to the same conditions and it produced methane. The transformations suggest heavier hydrocarbons could exist deep down. The reversibility implies that the synthesis of saturated hydrocarbons is thermodynamically controlled and does not require organic matter. The scientists ruled out the possibility that catalysts used as part of the experimental apparatus were at work, but they acknowledge that catalysts could be involved in the deep Earth with its mix of compounds. Historical Experiments and Predictions "We were intrigued by previous experiments and theoretical predictions," remarked Carnegie's Alexander Goncharov a coauthor. "Experiments reported some years ago subjected methane to high pressures and temperatures and found that heavier hydrocarbons formed from methane under very similar pressure and temperature conditions. However, the molecules could not be identified and a distribution was likely. We overcame this problem with our improved laser-heating technique where we could cook larger volumes more uniformly. And we found that methane can be produced from ethane." The hydrocarbon products did not change for many hours, but the tell-tale chemical signatures began to fade after a few days. Professor Kutcherov, a coauthor, put the finding into context: "The notion that hydrocarbons generated in the mantle migrate into the Earth's crust and contribute to oil-and-gas reservoirs was promoted in Russia and Ukraine many years ago. Opportunities for Research The synthesis and stability of the compounds studied here as well as heavier hydrocarbons over the full range of conditions within the Earth's mantle now need to be explored. In addition, the extent to which this 'reduced' carbon survives migration into the crust needs to be established (e.g., without being oxidized to CO 2 ). These and related questions demonstrate the need for a new experimental and theoretical program to study the fate of carbon in the deep Earth." This research was supported by the U.S. Department of Energy, the National Nuclear Security Agency through the Carnegie/DOE Alliance Center, the National Science Foundation, the W.M. Keck Foundation, and the Carnegie Institution. The Carnegie Institution for Science (www.CIW.edu) has been a pioneering force in basic scientific research since 1902. It is a private, nonprofit organization with six research departments throughout the U.S. Carnegie scientists are leaders in plant biology, developmental biology, astronomy, materials science, global ecology, and Earth and planetary science. http://geology.com/press-release/mantle-hydrocarbons/
The Strategic Petroleum Reserve exists, first and foremost, as an emergency response tool the President can use should the United States be confronted with an economically-threatening disruption in oil supplies. A Presidentially-directedrelease hasoccurredtwo times under these conditions.First,in 1991, at the beginning of Operation Desert Stormthe United States joined its allies in assuring the adequacy of global oil supplies when war broke out in the Persian Gulf. An emergency sale of SPR crude oil was announcedthe day the war began.The secondwas in September 2005 after Hurricane Katrina devastated the oil production, distribution,and refining industries in the Gulf regions of Louisiana and Mississippi. Hurricane Katrina's impact was so great, in fact, that SPR emergency oil loans preceded thePresident's decision to drawdown and sell oil from the Reserve.The first of several emergency loan requests from refinerswas received and approvedwithin 24 hours of Hurricane Katrina making landfall. In addition to national energy emergencies, crude oil hasbeen withdrawn many timesfrom the SPR sitesfor other reasons. Small quantities of oil are routinely pumped from the storage caverns in tests of the reserve's equipment. And in several instances, oil has been removed from the caverns under the legal authority to "exchange" SPR crude oil. This authority allows the SPR to negotiate exchanges wherethe SPRultimately receives more oil than it released; in other words, the exchanges can be used to acquire additional oil for the SPR. The Hurricane Katrina loans, mentioned above, were conducted usingthe exchange authority as were a series of loans resulting from Hurricanes Gustav and Ike in September 2008. The following provides abrief description of the times when crude oil has been released from the SPR.For a list of releases, click here . Crude OilSales and Emergency Drawdowns Twice the Administration has conducted test sales to ensure the readiness of the Reserve and its personnel to carry out a Presidentially-ordered drawdown. The first took place in 1985 andthe second in the months immediately preceding 1991's Operation Desert Storm. 1985 Test Sale. Oil has been pumped into and out of the Reserve's storage sites many times in routine tests. But until 1985, the competitive sales process had never been tested outside of simulationsrun inside the government. In 1985 Congress and the Administration agreed it was time to test the full system, both the pumps and paperwork, that would be needed to release oil from the Reserve in the event of an energy emergency. When it extended the Energy Policy and Conservation Act in June 1985, Congress authorized the Department to conduct test sales for up to 5 millionbarrelsthat would involve the private sectorin the competitivesales process for the first time. On November 18, 1985, the Department announced that it would begin acceptingoffers for the crude oil. One week later, on November 26, 1985, 17 companies submitted offers. Since no energy emergency existed at the time, the law governing the sale specified that the Energy Department could not accept anyoffer for less than 90 percent of market price for similar quality crudes. On November 27, the Department announced that it would sell one million barrels to the five highest bidders who offered prices ranging from $27.69 to $31.25 per barrel. By December 4, the first contract had been awarded, and the first oil delivery occurred on December 11. By January 8, 1986, all oil had been delivered and the test sale was successfully concluded. 1990-1991 Desert Shield/Desert Storm. The 1990 incursion by Saddam Hussein's Iraqi troops into neighboring Kuwait set into motion the first Presidentially- ordered, emergency use of the Strategic Petroleum Reserve. When Saddam's forces breached the Kuwaiti border on August 2, 1990, world oil prices shot upward. With the Middle East accounting for nearly half the crude oil the United States was importing at the time, concerns escalated over a possible disruption in oil supplies. Five days after the invasion, the United States hurriedly dispatched the 82nd Airborne and several fighter squadrons to the Persian Gulf, beginning Operation Desert Shield . On September 27, 1990, Secretary of Energy James D. Watkins, after consulting with President George H. W. Bush, ordered a 5-million-barrel test sale of Strategic Petroleum Reserve crude oil to "demonstrate the readiness of the system under real life conditions." Stressing that the test was not an emergency drawdown, Watkins nonetheless emphasized that increasing the familiarity of the private sector with the Reserve's sales process was important "should it become necessary in the future to conduct an emergency strategic stock drawdown in coordination with our allies." On October 10, 1990, the Energy Department announced that it would sell just under 4 million barrels of crude oil to 11 firms that submitted the highest offers from the 33 companies that had responded to the Department's solicitation. Theamount soldwas less than the 5 million barrelsoffered because of a lack of bids for one of the six types of crude oil the Department advertised for sale. The first crude oil moved out of the Reserve on October 19, 1990,and the test sale was completed on December 3, 1990. Saddam's aggression continued, however, and on January 16, 1991, President Bush in a nationally televised address announced that U.S. and allied warplanes had begun attacks against Baghdad and other military targets in Iraq. Simultaneously, the President announced that the United States would begin releasing a portion of its Strategic Petroleum Reserve stocks as part of an international effort to minimize world oil market disruptions. Immediately following the President's address, Secretary Watkins directed the Energy Department to prepare for a drawdown of 33.75 million barrels of Strategic Petroleum Reserve oil, the proportional amount assigned to the United States under a coordinated emergency response plan drawn up by the International Energy Agency. Theoil was released overa 45-day delivery period. Operation Desert Shield had become Desert Storm , and the first emergency use of the Strategic Petroleum Reserve had been authorized. MORE INFO Read the DOE press releases issued during the Desert Storm drawdown Less than 12 hours after the President's authorization, on January 17, 1991, the Energy Department released the crude oil sales notice, and on January 28, 1991, 26 companies submitted offers. The rapid decision to release crude oil from government-controlled stocks in the United States and other OECD countries helped calm the global oil market, and prices began to moderate. On January 30, 1991, the Energy Department accepted offersfrom 13 companies offering the best prices for 17.3 million barrels ofReserve oil. The total volume sold during the Desert Storm drawdown was just over half the amount offered by the Government, primarily because industry offers for the higher-sulfur "sour" crude oil were substantially lower than bids for the lower-sulfur "sweet" crude. "We clearly must remain sensitive to the market by making available the crude oil the industry is saying it really needs and not allowing bargain hunters to take advantage of the taxpayers," Watkins said in announcing his decision to accept only thoseoffers that were above 97.5 percent of benchmark prices of comparable crude oils. On February 5, 1991, the first crude oil in the emergency drawdown was delivered. On February 23, 1991, allied ground forces moved into Iraq and Kuwait, and Hussein's troops began to pull back. Four days later, on February 27, President Bush ordered a cease fire, and on March 3, Iraqi leaders formally accepted cease fire terms. The Persian Gulf war was over. World oil markets had remained remarkably calm throughout most of the war, due largely to the swift release of the Strategic Petroleum Reserve oil in combination with other oil response measures taken around the world. By April 3, 1991, the Energy Department had completed its contractual obligations, delivering the last of the 17.3 million barrels. In wrapping up the first-ever emergency drawdown the Strategic Petroleum Reserve, Energy Secretary Watkins said, "We have sent an important message to the American people that their $20 billion investment in an emergency supply of crude oil has produced a system that can respond rapidly and effectively to the threat of an energy disruption." The 2005 Hurricane Katrina Drawdown. Hurricane Katrina entered the Gulf of Mexico in late August 2005 and caused massive damage tooil production facilities, terminals,pipelines, and refineries. All Gulf of Mexico production, which equates to about 25% of domestic production, was shut ininitially. In addition, import terminals were closed; some pipelines and several refineries were inoperable. Gasoline prices spiked nationwide in reaction to the disruptions and the supply levels of gasoline and other refined products were impacted. Because of these disruptions,on September 2, 2005, President George W. Bush issued a Finding of a Severe Energy Supply Interruption as defined in section 161(d) of the Energy Policy and Conservation Act (EPCA), 42 U.S.C. 6 241(d) . President Bushauthorized and directed the Secretary of Energy to drawdown and sell crude oil from the Strategic Petroleum Reserve at a rateto be determined by Secretary of Energy Samuel W. Bodman. MORE INFO Read the President's Statement Read Secretary Bodman's Statement Read the IEA News Announcement Notice of Sale Amendment to Notice of Sale The United States' Hurricane Katrina sale waspart of a coordinated emergency response with the International Energy Agency (IEA), a coalition of 27 member countries that supports energy supply security through energy policy cooperation. The IEA set a goal to make available 60million barrels of crude oil and refinedproducts to help mitigatethe impact of the disruptions in the global flow of crude oil while efforts were underway to restore operations ofoffshoreproduction platforms,refineries and other facilities. IEA member nationsdelivered to the United States much needed gasoline and other products during this period. On September6, 2005, the Department of Energy issued a Notice of Sale,offering30 million barrels of crude oil (15 million barrels each of sweet andsour). The competitive sale was conducted on-line for the first timeusingtheStrategic Petroleum Reserve's Crude Oil Sales Offer Program . Offers were dueby4:00 p.m., Central Daylight Time, September 9, 2005 (see September 6, 2005, Techline ). MORE INFO Summary of Offers Results of Notice of Sale The results of the Hurricane Katrina sale were announced on September 14, 2005 (see September 14, 2005, Techline ). Of the 30 million barrels offered for sale, 14 offers requesting 19.2 million barrels (14.8 million barrels of sweet and 4.4 million barrels of sour)were receivedfromsevencompanies. DOE evaluated eachoffer and determined that five companies had submitted successful offers for 11 million barrels. Awards were made for delivery of 10.8 million barrels of sweet and 200 thousand barrels of sour crude oil. The firstoil deliverycommenced on September 26, 2005from the Bryan Mound site (deliveries arecompleted in batches as arranged for by the purchaser) (see September 29, 2005, Techline ). Thelast drawdown and sale deliverywas scheduled for December 2005. The total U.S. response to Hurricane Katrina,considering both the emergency loansof 9.8 million barrels and the 11 million barrels ofoil that was sold,was 20.8 million barrels. Exchange Agreements Oil has been released from the Strategic Petroleum Reserveten times under exchange arrangements (similar to loans)with private companies. The Energy Policy and Conservation Act (P.L. 94-163, enacted December 22, 1975)gives the Energy Department the authority to exchange oil from the Reserve for the purpose of acquiring additional oil for the stockpile. 1996 Pipeline Blockage. In late April 1996, the ARCO Pipe Line Company incurred an operational emergency when its 20-inch pipeline from the Texas Gulf Coast to Cushing, Oklahoma, became blocked by a waxy crude, interrupting its oil deliveries to the midcontinent. On May 3, 1996, under an emergency crude oil lease exchange agreement with the Seaway Pipeline Company, the Energy Department agreed to supply up to one million barrels of crude oil to enable the start up of its Freeport-to-Cushing pipeline to continue the flow of oil to the midcontinent refineries, avoiding any refinery shutdown. Under the terms of the agreement, ARCO would pay the Government a fee, plus a future price differential for leasing the oil, and would replace the oil with an equivalent grade of crude within six months. Under this lease, the Strategic Petroleum Reserve delivered a total of 900,416 barrels of crude oil to the Seaway Pipeline System. All the oil was returned by November 25, 1996. 1998 Maya Exchange. During 1998, the Department conducted an exchange of the 11 million barrels of Maya crude oil stored at the Bryan Mound site for 8.5 million barrels of other higher value crude oil. The Maya crude oil was acquired from Mexico in the early 1980s, as part of a purchase agreement between the Department and Petroleos Mexicanos, Mexico's national oil company. Since that time, the Maya has been segregated in a single cavern at Bryan Mound because its lower API gravity and greater sulfur content made it significantly different from the other inventory. This had the effect of reducing the site's operational flexibility, efficiency, and drawdown capability during an energy emergency. On August 13, 1998, the Reserve solicited offers to deliver crude oil which would meet the Reserve's quality specifications, in exchange for the Maya. On August 27, 1998, the Reserve received offers from seven companies, and on August 28, an exchange contract was awarded to P.M.I. Norteamerico S.A. de C.V. of Houston, Texas. Subsequently, P.M.I. delivered a total of 8.5 million barrels of light sour Olmeca and Isthmus crude oils to Bryan Mound from October 1998 through early January 1999. In return, the Reserve transferred title of Maya ownership to P.M.I.; however, the Maya crude remained in the custody of the Reserve until October 1999. This exchange decreased the Reserve's total inventory by about 2.5 million barrels, but because of the higher quality of the oil received in the exchange, it did not decrease the value of the inventory. Additionally, it benefited the Reserve by increasing the quantity of Bryan Mound's light sour crude oil stream and improved the site's storage and drawdown capabilities. 2000 Ship Channel Blockage. In June 2000, a commercial dry dock collapsed into the Calcasieu ship channel just north of the Intracoastal Waterway near Lake Charles, Louisiana. The channel served as the primary route used by nearby CITGO and Conoco refineries, two of the largest in Louisiana. The blockage meant that both refineries faced production curtailments in a matter of days if crude oil could not be supplied to them. In less than 30 hours after being approached by the companies, the Energy Department had made arrangements to exchange oil from the Strategic Reserve to relieve the refineries' supply problems. On June 15, 2000, the Energy Department agreed to exchange 500,000 barrels from the Strategic Reserve's West Hackberry site with CITGO in return for an equivalent quantity, plus an exchange premium,of crude oil from the company after the shipping lanes were reopened (see June 15, 2000, Techline ). The next day, June 16, 2000, the Department reached an exchange agreement for the same amount with Conoco (see June 16, 2000, Techline ). Crude oil from the Reserve began flowing to the refineries on June 18, 2000. Within a week, the U.S. Corps of Engineers had reopened the shipping channel, and on July 29, CITGO delivered replacement crude oil back to the Reserve. On August 4, Conoco delivered an equivalent quantity of crude oil to the Reserve, completing the exchange. 2000 Heating Oil Exchange. With U.S. consumers facing the winter of 2000-01 with commercial heating oil stocks much lower than typical, the Clinton Administration on July 10, 2000, announced its intent to establish a Home Heating Oil Reserve (see July 10, 2000, Techline ). The goal was to establish a 2-million barrel reserve to provide an emergency fuel source for consumers in the Northeast. The heating oil was to be stored in aboveground tank farms leased from private companies (see Northeast Heating Oil Reserve ). To acquire the storage facilities and heating oil, the Energy Department offered to exchange crude oil from the Strategic Petroleum Reserve. By the end of August 2000, the Department had contracts in place with three companies to provide the terminal capacity and with two companies to supply the heating oil. (see August 29, 2000, Techline ). To acquire the first-year use of storage facilities, the Department agreed to provide 117,667 barrels of crude oil to Equiva Trading Company, Morgan Stanley Capital Group, Inc., and Amerada Hess Corporation. (After the initial year, the Administration began requesting direct appropriations to cover the costs of leasing commercial tank storage.) To obtain the 2 million barrels of heating oil, the Department provided 2,718,000 barrels of crude oil to Equiva Trading Company and the Morgan Stanley Capital Group, Inc. These companies offered the most favorable exchange terms to the government in an open competition. Even with the establishment of the Northeast Home Heating Oil Reserve (above), low distillate inventories in the Northeast continued to alarm the Administration in the fall of 2000. On September 22, 2000, President Clinton directed the Secretary of Energy to enter into time exchange agreements with oil companies for up to 30 million barrels of crude oil (see September 25, 2000, Techline ). Under the exchange agreements, companies were to return a like quantity, plus a bonus percentage of similar crude oil, in the fall of 2001. An initial group of offerors was selected on October 4, 2000, (see October 4, 2000, Techline ). When two of the selected offerors could not provide the necessary financial guarantees, the Energy Department reissued a solicitation for 7 million barrels of crude oil on October 16, 2000 (see October 16, 2000, Techline ) and awarded final contracts on October 24, 2000 (see October 24, 2000, Techline ). The average bonus percentage from these initial awards was 4.5 percent, for a total of 31.2 million barrels of exchange oil to be returned to the Reserveby a specified date. However, market conditions in2001 made it advantageous to the government toaccept deferral ofsome of these deliveries until 2002and 2003. Companies scheduled to supply oil to the Reserve agreed to provide an additional 3.3 million barrelsas a condition ofallowing later deliveries, bringing the total amount of oil to bereturned under the time exchange to 34.5 million barrels. In December 2002, with oil supplies tightening due to the curtailment of exports from Venezuela, Energy Secretary Spencer Abraham authorized the Department toaccept further deferrals of the 5.3 million barrels that remained to be delivered.The renegotiated delivery schedules resulted in an additional premium of600 thousandbarrelsfor delivery by early 2004, resulting in a total return volume of 35.1 million barrels. No further deferrals were permitted andthe Exchange 2000 initiative is nowcompleted. 2002 Hurricane Lili. When Hurricane Lili disrupted normal commercial oil shipments into Gulf Coast distribution hubs in October 2002, a limited exchange of Strategic Petroleum Reserve was carried out to permit a major oil pipeline operator to continue critical crude shipments to refineries in Memphis and the Midwest. The action began on September 30, when the Energy Department was informed that the Capline pipeline, a major interstate oil carrier that originates in Louisiana, might not be able to deliver needed oil supplies to customers, including the Williams refinery in Memphis, due to curtailments of incoming oil deliveries because of Hurricane Lili. The Capline operator, Shell Pipeline Co. LP, was concerned that using oil stocks from its Sugarland terminal in St. James Parish, Louisiana, to keep the Capline pipeline flowing would cause stock levels in the tanks to drop below the safety threshold for protection against hurricane-force winds. By October 1, Strategic Petroleum Reserve staff had worked out an arrangement with the Capline Pipeline System to temporarily relocate up to 296,000 barrels ofoil from the Strategic Petroleum Reserve's Bayou Choctaw site to keep stocks in Shell's tanks at acceptable levels. The SPR temporarily relocated a lesser amountof98,000 barrels from the Bayou Choctaw site to the Capline tanks. This allowed Shell to continue supplying oil to Williams and other refineries in the Midwest that rely on the Capline pipeline. When commercial oil deliveries returned to normal the next week, Shell pumped the SPR crude back to the government's storage site. Because the SPR oil sent to Shell displaced oil in a connecting pipeline that served the Placid Refinery in Port Allen, Louisiana, thecrude oilreturned SPR oil went directly to the Placid Refinery. Under the exchange agreement, DOE received a comparable grade of replacement oil within 60 days plus premium barrels. (See October 7, 2002, Techline .) 2004Hurricane Ivan Exchange. Hurricane Ivan struck theGulf of Mexico in mid-September 2004 and disrupted both Outer Continental Shelf production and import vessels deliveringcargoes to Gulf terminals. Most of the production shut in was in the fields east of Louisiana and was sweet oil used in refining gasoline and distillate products. The Department of Energy received several emergency requests from refiners for assistance in securing supplies of crude oil adequate to avoid cutting back on refining operations. To relieve their shortages, the SPR loaned a total of 5.4 million barrels of sweet crude oil to five companies (Placid Refining, Shell Trading, Conoco Phillips, Astra Oil, and Premcor). The crude oil was delivered to the refinersduring September and early October 2004. By April 2005, theloaned oil had beenrepaid to the SPR, plus233,924 premium barrels paidto the Government in return for the time-exchange. (See November 8, 2004, Techline ) 2005 Hurricane Katrina Exchange. In late August 2005 Hurricane Katrina entered the Gulf of Mexico as a Category5hurricane, causing massive damage to offshore oil production facilities. The destruction continued when she madelandfall as a Category3 hurricane near New Orleans, Louisiana,on August 29, 2005.By the time she was finished, significantdamage to production platforms, terminals, pipelines and refineries had occurred, leavingmany facilitiesinoperable for weeks - and some for several months. MORE INFO First Loan Announced Summary of Exchanges Immediately after learning of Hurricane Katrina's devastating impact, the Secretary of Energy approved six emergency requests for loansof crude oil from refiners whose scheduled deliveries had been disrupted. Without the SPR loans, the refineries faced severe reductions in processing rates or shutdown of their operations. The loans enabled them to continue refining crude oil into products such as gasoline, heating oil, and jet fuel for the Nation.The terms of the loans required repayment ofcrude oil that meets the specifications of the SPR,including premium barrelsto be paid to the Government.The first oil delivery occurred on September 3, 2005, and continued in a series of batchesthrough October, totaling 9.8million barrels.During Fall 2005, 4.2 million barrels of oil and accompanying premium barrels were repaid. An additional 4.4 million barrels were repaid between February and May 2006, and the remaining 1.7 million barrels were repaidduring Spring 2007. The 9.8 million barrels of oil loaned under exchange agreements,combined with the11 million barrels ofoil sold, provided 20.8 million barrelsof crudeoil to U.S. refiners. 2006 Barge Accident. On January 17, 2006, a barge accident in the Sabine Neches ship channel resulted in the closure of the channel to deep-draft vessels,disrupting deliveries of crude oil to refiners in the Beaumont/Port Arthur area. In order to avoid shut down or reduced runs at the Total Petrochemicals USA, Inc. refinery at Port Arthur,the SPRagreed to loan Total 767 thousand barrels of sour crude.The loaned amount, plus premium barrels,was repaid in February 2006. 2006 Ship Channel Closure. On June 21, 2006, the Calcasieu Ship Channel was closed to maritime traffic due to the release of a mixture of storm water and oil nearLake Charles, Louisiana, cutting off supplies to refiners in the area.Deliveries to the ConocoPhilips and Citgo refineries in the area were disrupted.In order to avert temporary shutdown ofboth refineries, the SPR agreed to loan a total of750 thousand barrels of sour crude.The loaned amount, plus premium barrels, was repaid in early October 2006. 2008 Hurricanes Gustav and Ike Test Exchanges. On September 1, 2008, Hurricane Gustav entered Louisiana west of New Orleans as a Category Two hurricane. The storm disrupted the production of oil in the Gulf and damaged thepetroleum industry infrastructure necessary to receive, process anddistribute the crude oil and product. The Secretary of Energy announced that DOE would favorably consider requests for releases of crude oil from the SPR in order to supply refineriesthat were still able to operate. The SPR releases would beexecuted using the Secretary'semergency testexchange authority. The first request was received on September 2nd and wasquickly approved.Additional requests followed and werealsoapproved. MORE INFO Summary of Exchanges Read the Report to Congress on the SPR's 2008 Emergency Test Exchanges The first delivery began on September 9, 2008. As the SPR continued to review requests for emergency loans and deliver oilfollowing HurricaneGustav,the Nation was watching the progress of Hurricane Ike as it moved towards the U.S. Gulf Coast. Hurricane Ike made landfallnear Galveston,Texas as a Category 2 hurricane on September 13, 2008, before the petroleum industry had recovered from Hurricane Gustav. Hurricane Ike devastated the region along the northeastern coast of Texas and southwestern Louisiana. In spite of sustaining facilitydamageas well as loss of commercial power at some sites from both hurricanes, the SPR was able to makeoperational repairs quicklyin order todeliver crude oil. Beginning in early September and continuing through October 16, 2008, a total of5,389,000 barrels of SPR crude oil were delivered to five companies whose normal supplies had been interrupted so that the companiescould continue to operate,refine the crude oil into products, anddeliver thoseproducts toU.S.consumers.Deliveries to Marathon, Placid, ConocoPhillips, Citgo, and Alon USA werecompleted from Louisiana'sBayou Choctaw and West Hackberry sites. Repayment to DOE of the quantity of crude oil loaned to the contractors, in addition to premium barrels negotiatedas a condition of theloan,would occurJanuary through May2009. The Energy Policy and Conservation Act (P.L. 94-163) provides authority for the Secretary of Energy, under Sec. 161(g)(1), to conduct a test sale or exchange of up to five (5) million barrels from the SPR. Two separatetestexchanges were authorized in response to Hurricanes Gustav and Ike. A Report to Congress was prepared on the use of the SPR's test exchange authority. Non-Emergency Sales Although the Reserve was established to cushion oil markets during energy disruptions, three times during 1996, non-emergency sales of oil from the Reserve were authorized by Congress to raise revenues. The total quantity sold was 28.1 million barrels. 1996 Weeks Island Sale. The first sale was requested by the Administration to pay for the unexpected decommissioning of the Weeks Island Strategic Petroleum Reserve storage site. A fracture in the overburden above the converted salt mine - the only site in the Reserve that used a former mine to store crude oil - threatened the site's geologic integrity and its 73 million barrels of crude oil. On October 5, 1994, the Energy Department had announced that it would begin transferring the oil to other sites to reduce the threat of its catastrophic release into the environment.The cost of the transfer and subsequent site decommissioning was estimated to be $100 million. To pay for the effort, the Department proposed to sell up to seven million barrels of the Weeks Island inventory. Congress approved the sale in the Balanced Budget Downpayment Act, enacted January 26, 1996. On January 29, 1996, the Defense Fuel Supply Center, acting as the Energy Department's sales agent, issued a solicitation to industry for competitive offers to purchase Weeks Island oil. Subsequently, on a two-week cycle, beginning February 20 and ending March 21, offers were received, negotiations conducted, and contracts awarded to those offerors bidding prices consistent with the oil's market value. Six contracts were awarded to four oil firms for 5.1 million barrels. Deliveries were made between March 4 and April 21, 1996. Payments to the U.S. Treasury totaled $97.1 million, or $18.95 per barrel. 1996-97 Sales to Reduce the Federal Budget Deficit . The second sale of Weeks Island crude oil was directed by Congress in the Omnibus Consolidated Rescissions and Appropriations Act of 1996, enacted April 26, 1996. It required the sale of $227 million worth of oil during fiscal year 1996 to reduce the federal budget deficit. This sale was performed in the same manner as the first. From May 22 through August 5, 1996, the Defense Fuel Supply Center awarded twenty-four contracts to nine oil companies. Deliveries of 12.8 million barrels were made from May 26 through September 17, 1996. This sale yielded $227.6 million in revenue for the U.S. Treasury, or $17.81 per barrel. The third sale was directed by the Omnibus Consolidated Appropriations Act for Fiscal Year 1997, enacted September 30, 1996, and called for the sale of $220 million worth of crude oil to offset fiscal year 1997 appropriations. On October 3, 1996, the Defense Fuel Supply Center issued a solicitation to prospective offerors requesting bids to purchase West Hackberry sour crude oil, and a small quantity of sweet crude oil in the pipeline connecting the West Hackberry site with the Sunoco Marine Terminal in Nederland, Texas. The first purchase contracts were awarded on October 24, 1996, and by December 5, 1996, the Defense Fuel Supply Center had awarded twenty contracts to seven companies for the purchase of 10.2 million barrels to yield about $220 million in revenue. The first delivery occurred on October 29, 1996 and all deliveries were completed by January 1997.
On June 23, 2011, the International Energy Agency (IEA) announced that its member countries agreed to release 60 million barrels of petroleum from their strategic reserves. The barrels will be made available over the next month and will result in an average release of 2 million barrels per day. As part of the effort, the United States will make available 30 million barrels of crude oil from the Strategic Petroleum Reserve (SPR) . The IEA's 27 other member countries will make available the remaining 30 million barrels in the form of either product or crude oil. Historically, releases from the SPR have taken one of two forms, either an exchange, where oil provided in the release is then repaid within a specified time, or sales, where oil is auctioned off in a competitive bidding process. The SPR crude oil stocks are stored in underground salt caverns along the Gulf of Mexico Coast. Currently, there are a historically high 726.6 million barrels of crude oil in SPR, close to its 727.0 million barrel capacity. This action marks the third time IEA members have collectively agreed to release strategic petroleum stocks. The previous occasions were the launch of Operation Desert Storm in 1990/1991 following Iraq's invasion of Kuwait and Hurricane Katrina in 2005. The United States has released crude oil from the SPR a number of times since 1985 , according to the U.S. Department of Energy. The most recent release was the 5.4 million barrel exchange following Hurricanes Gustav and Ike in September 2008. To date, the largest release was a 30 million barrel exchange in the fall of 2000 in response to low heating oil supplies in the Northeast region of the United States. http://www.eia.gov/todayinenergy/detail.cfm?id=1950
MIT校长 Susan Hockfield 在MIT第145届研究生毕业典礼上的讲话如下(2011-6-3) Those of you graduating today will receive many different degrees in a wide range of disciplines. But, even so, you are united, as our Sesquicentennial class. The MIT150 celebrations that began 148 days ago have described the earliest dreams of our founding and produced provocative, sometimes even luminous, visions of the future. We heard Nobel Laureate-studded panels discuss the frontiers of research, joined by participants from around the world, and in outer space. We celebrated remarkable achievements by members of this community from every background, and we renewed our commitment to strengthening our culture of inclusion. We opened our campus. We raced blimps, tested robots, scaled buildings, electrified pickles — and we saw the wonder reflected in the faces of thousands of children, who now want to be just like you. This semester’s celebrations have also reminded us that our first president, William Barton Rogers, launched MIT with an enduring set of values: the spirit of Mens et Manus, mind and hand — of useful work founded on the finest science and focused on real-world problems; a belief in the power of hands-on learning; and a commitment to meritocracy, rigor and service. From these principles, in 1861 Rogers forged a new kind of institution, and his new Institute would shape and inspire a new breed of thinkers, makers, doers, inventors and entrepreneurs such as the world had never seen before. People just like you. The graduates who poured forth from MIT dramatically accelerated America’s industrial progress; helped win a World War; made profound scientific discoveries; invented countless products and concepts that make people safer, healthier, more prosperous, more productive and more connected; designed exquisite buildings and thriving cities; founded whole new industries and launched thousands of business that employ millions of people around the globe. In today’s precarious world, the technical challenges that face you may look different or more daunting. But the essential challenge for each of you is the same, because it is still true that along with the distinctive strengths you gained from MIT comes a profound responsibility to use them. More urgently and in more fields than ever before, the world needs people with the skills and perspective you have gained at MIT: People ready to apply their skills in interdisciplinary problem solving to the looming problems of the planet — clean energy and climate change, poverty and famine, the health of our oceans and the future of our cities — and primed to build an international network of collaborators to amplify their impact. People eager to deploy the historic convergence of the life, physical and engineering sciences as a catalyst for new solutions, from health care to energy to new manufacturing, that will also help stimulate economic growth. People with the insight, integrity and creative brilliance to help bring intelligence to information; pioneer new connections between technology, culture and the arts; and develop financial models to make our economies more resilient and less inequitable. People perpetually hungry for exploration, from mathematics to music to the moon -- and people eager to teach what they know to the rising generations. This is the work we have prepared you for, and I hope that challenges like these will engage your brilliant minds and hands as you chart the path to lives of meaning, challenge and adventure. Poring over MIT’s history, I have come to appreciate that, like the great Dome above us, the Institute as we know it did not just spring forth, fully formed: it rose slowly over time, through the aspirations and achievements of thousands of human beings. In fact, the Dome itself — this iconic symbol of the Institute — almost did not happen. By the standards of 1916, it was huge — larger than the dome of St. Paul’s in London or the Capitol building in Washington, DC. And it was expensive; the limestone and the labor cost almost as much as MIT had spent to buy the land for its new campus here in Cambridge. But the Dome did rise, because MIT’s then-President, Richard Maclaurin, insisted that the campus demanded a focal point, one that would lift our eyes and our aims to the sky, and beyond. And so, graduates of MIT, as you go forth from Killian Court on this beautiful day, you will soon come to know what every MIT alumnus can tell you: that our Great Dome travels with you, no matter where you stand on the face of the Earth. MIT — in its steel-strong values and rousing mission of learning, discovery and service — will always be here, as foundation and as inspiration. Now is your moment to put its spirit and principles to work around the globe. For all that you have created, invented, explored and mastered at MIT — Congratulations, MIT graduates of 2011. 来源 http://web.mit.edu/newsoffice/2011/hockfield-charge-0603.html
Greetings from space Astronaut alumni wish MIT a happy 150th from 200 miles above Three MIT alumni with something unusual in common — they were on the International Space Station (ISS) together for eight days last month — co-star in a new video offering extraterrestrial congratulations on the Institute’s 150th anniversary. MIT庆祝150周年的第146天,2011.6.1 MIT主页 Two of the three, Greg Chamitoff PhD ’92 and Mike Fincke ’89, are crewmembers on Space Shuttle Endeavour, scheduled to return to Earth today, June 1. The third, Cady Coleman ’83, spent five months on the ISS, returning to Earth May 24 in a Russian Soyuz craft. Chamitoff — who has previously found ways of incorporating his alma mater into NASA missions — reached out earlier this year to William Litant, communications director for the Department of Aeronautics and Astronautics, seeking to bring astronaut alumni into the MIT150 celebration. “There is no more enthusiastic MIT alum than astronaut Greg Chamitoff,” Litant says. “He has used both his visits to the International Space Station as an opportunity to connect with MIT." For this mission, Litant and Chamitoff came up with two ways of commemorating MIT’s myriad contributions to space travel: the video tribute from space, and the inclusion in Endeavour’s payload of a 1961 letter written by longtime MIT professor Charles Stark Draper, whose navigational systems have guided space shuttles and the ISS. Before settling on these ideas, Litant and Chamitoff considered several other iterations. Endeavour’s initial launch date would have had the craft back from its final mission by mid-April, so their original plan was to bring all seven crew members to campus for the MIT Open House on April 30. Then, when the launch date was moved to April 19, that plan was scuttled in favor of a video featuring Chamitoff, Fincke and Coleman. “The T-shirts were Greg’s idea,” Litant says of the trio’s attire in the 158-second clip. “I ran over to the Coop, bought three shirts, and FedExed them to Greg in Houston just in time for him to include in his personal cargo.” Inspiration for much of the astronauts’ commentary came from the speech given on April 10 at the 150th Convocation by David Mindell, the Frances and David Dibner Professor of the History of Engineering and Manufacturing. “We particularly liked David’s references to William Barton Rogers’ emphasis on learning by doing, and the importance of hands-on experiences,” Litant says, adding that the wordsmithing went down to the wire: “We were tweaking the remarks until about a day before Greg and Mike launched.” http://web.mit.edu/newsoffice/2011/astronauts-iss-150-video.html 博友 vividfn 翻译了上述报道,参考译文如下,谢谢 vividfn ! 来自太空的祝贺 MIT宇航员校友从200英里高空祝贺MIT建校150周年 近日,麻省理工的三名校友为自己的母校送上了一份出人意料的贺礼。上个月,他们一同在国际空间站呆了整整八天的时间。期间,他们联袂为母校建校150周年录制了一段视频。 他们中的两位——MIT92级的Greg Chamitoff博士与89级的 Mike Fincke同为“奋进”号船员——将于今日(六月一号)返回地球。而另一位名叫 Mike Fincke,为麻省理工83级毕业生,在国际空间站待了5个月的时间,已于5月24日乘坐俄罗斯联盟号返回。 Greg Chamitoff之前就希望能在宇航局的工作中为母校送上祝福。年初,他联系上航空航天部公关主任William Litant,试图让宇航员们也能参与MIT的150周年庆典。 “众多校友里,他绝对是最有热情的,”Litant说,“驻留ISS则成他的机会。” 这次,他们设计了两个途径来记念麻省理工及其为太空航行作出的巨大贡献:一是在太空录制视频,二是一封1961年被带上奋进号的信——写信人是麻省理工的Charles Stark Draper教授,他的导航系统对航天飞机与空间站贡献颇多。 期间,他们也是波折不断。原定“奋进”号将于4月中完成任务并返航,其后他们一同7名机组成员会在4月30号的MIT开放日前往学校。但后来启航日期被推迟到4月19号,所以原计划流产了。取而代之的是由先前提到的三人在太空录制祝贺视频。 说到他们三人在158秒的视频中穿的T恤,Litant说:“那是Greg的主意。我跑到超市买了三件T恤,又快递给身在休斯顿的Greg,刚好来的及让他写上自己的标语。” 他们的灵感来自于4月10号,David Mindell教授与研究工程和设备制造历史的David Dibner教授在150周年会议上的发言 我们特点喜欢David教授就威廉•巴顿•罗杰斯为例所说的:亲自动手,方能有所收获。谈到他们在最后关头才写上标语时,Litant说:“我们在Greg和Mike出发的前一天才定下我们的标语。”
Quick Revision Quiz Test out your oil exploration knowledge in this quick quiz: 1. Where does oil and gas come from? A:Mantle Rock B:Buried marine material that did not fully decompose C:Swamp gases 2. Where can seismic exploration methods be used? A:Only on land B:Only at sea C:Both on land and at sea 3. How does buried organic material turn into hydrocarbons? A:The organic matter combines with hot clay to produce gas B:The organic material is squeezed by great pressure until oil is released C:Heat and pressure cause the large organic molecules to break down into shorter units that constitute petroleum 4. Which of the following is NOT a seismic exploration source? A:Airgun B:Earthquakes C:Explosives 5. What are the units on the y axis of a seismic profile? A:Time B:Two way time C:Depth 6. Geophones are used in seismic exploration for what purpose? A:Producing seismic energy B:Recording reflected seismic energy C:Keeping the field crew in contact with each other 7. In which direction does oil or gas migrate? A:North B:Towards the equator C:Towards the surface 8. What is porosity? A:The interconnectivity of pore spaces in a rock B:The small spaces that can fill with fluid or gas in rocks C:A measure of grain size in sedimentary rocks 9. What property must a cap rock have in order to trap hydrocarbons? A:It is very hard B:It is igneous C:It is impermeable 10. Which one of the following geological features could potentially be a hydrocarbon trap? A:A volcano B:An anticline C:A continental shelf
综合SEG网站资料,下面简要介绍SEG的历史,欢迎大家在评论中翻译和讨论。( www.seg.org ) SEG History The Society of Exploration Geophysicists is a not-for-profit organization that promotes the science of applied geophysics and the education of geophysicists. SEG, founded in 1930, fosters the expert and ethical practice of geophysics in the exploration and development of natural resources, in characterizing the near surface, and in mitigating earth hazards. The Society, which has more than 33,000 members in 138 countries, fulfills its mission through its publications, conferences, forums, Web sites, and educational opportunities. SEG(The Society of Exploration Geophysicists )是美国勘探地球物理学家学会的简称。它是为了促进地球物理教育与应用的菲赢利组织。SEG创建于1930年。SEG创建的初衷在于培养地球物理专家以及更好的让地球物理在勘探开发自然资源,近地表表征,减少地质灾害等方面发挥积极作用。SEG在138国家中拥有33000个会员, 通过 出版物, 会议,论坛, 网站和 教育机会 等履行其使命。 1930 On March 11, twenty-nine men and one woman met in Houston at the University Club to found the Society of Economic Geophysicists. Donald C. Barton was elected the first president. On 20 May, a constitution and bylaws were adopted, and two papers were published in mimeograph form. 1931 The group's name was changed to Society of Petroleum Geophysicists (SPG), and the first convention was held in conjunction with AAPG. 1932 SPG became the "Division of Geophysics of the AAPG." The Society continued to meet with AAPG through 1955. 1936 The first issue of Geophysics published. 1937 Once again the name of the organization was changed, this time to Society of Exploration Geophysicists. Accepted as an Affiliated Society by AAPG 1939 Patents section first appeared in Geophysics . 1940 First Cumulative Index published. Membership: 892. 1946 Constitution amended to permit establishment of Local Sections. 1948 Council created and met in Denver. First Local Sections chartered. Student Sections formed. Best Paper Award first presented. 1950 First Distinguished Lecture Tour organized. Membership: 2566. 1951 EAGE organized. Back issues of Geophysics available on microcards. 1952 SEG Crest adopted. 1953 Geophysical Prospecting appeared as a quarterly. 1954 Executive Committee voted to separate the Annual Meeting from the AAPG. First Associate Editors appointed to assist the Editor of Geophysics . 1955 SEG held its last joint meeting with AAPG, then celebrated its twenty-fifth anniversary with a separate meeting in Denver. 1956 The first Yearbook was published, and SEG's scholarship program was initiated with $12 125 distributed to thirteen students. 1960 A silver anniversary issue of Geophysics published listing "classic" papers of the first twenty-five years of the journal, which were selected by a panel of judges. Membership: 5724. 1961 The SEG Medal Award (later renamed in honor of Reginald Fessenden) was created. 1965 When the SEG staff moved into the Society's new building in June, there were 5837 members. 1968 SEG accepted an invitation from the Society of Petroleum Engineers to become a cosponsor of the Offshore Technology Conference. R. E. Sheriff published in Geophysics , the "Glossary of terms used in Exploration Geophysics," the precursor of his Encyclopedic Dictionary . Sheriff received the Virgil Kauffman Gold Medal in recognition of the glossary. 1969 Emeritus Membership was established in 1970. Membership: 7306. 1971 The fiftieth anniversary of the reflection seismograph was observed at the Midwestern Meeting in Oklahoma City with the dedication of a monument near the site of the tests of that technique. 1972 The first book published jointly with AAPG, Stratigraphic Oil and Gas Fields-Classification, Exploration Methods, and Case Histories , appeared. It was to be twenty-five years before the second joint publication effort by the two societies. 1973 Sheriff produced SEG's all time best-seller, Encyclopedic Dictionary of Exploration Geophysics . The addition of three new student sections brought the total to twenty-eight. 1978 The Maurice Ewing Medal Award was established as SEG's highest award. 1979 Geophysics began monthly publication, and fifteen Continuing Education courses were offered. 1980 In the 50th anniversary year of the Society, when the total membership was 14 172, there were 12 319 registered at the Annual Meeting. Eleven of the original thirty founders of SEG attended and were honored at that meeting. That attendance record has not been broken. 1981 A record $4 billion was spent on geophysical acquisition and processing in 1981. More than 100 000 attended the OTC that year. 1982 Geophysics, The Leading Edge of Exploration , debuted in June. The SEG scholarship program passed the million-dollar mark with awards of $130 800. Expanded abstracts were required for all papers presented at the 52nd Annual Meeting. 1984 The Geophysical Resource Center was completed and occupied. It was dedicated the following year. 1985 Two special issues were published to commemorate the fiftieth year of publication of Geophysics . A new film about geophysical exploration, Seeing the Unseen: Geophysics and the Search for Energy and Minerals , was produced. The First Annual Gulf Coast Exploration and Development Meeting was held, and the first joint meeting of the China Petroleum Society and SEG took place in Beijing. SEG's membership of 19 559 was the highest total to that point, and would remain the record for 10 years. 1986 Shell Companies Foundation donated $100 000 for books and periodicals to the SEG Library in the Geophysical Resource Center, and the building was named the Cecil and Ida Green Tower. 1987 Seismic Data Processing , zdogan Yílmaz's best seller, was available at the Annual Meeting in New Orleans. This was to become the second all-time revenue producer behind Sheriff's dictionary. The SEG Foundation was reorganized. 1988 An agreement with AAPG, SPE, and SPWLA led to the formation of an Intersocietal Coordinating Committee. The first EAEG-SEG joint research workshop under a new agreement to hold alternating workshops every other year and the first ASEG-SEG joint meeting were held. 1989 Initiation of the SEG Foundation Trustee Associates. 1990 A 15-tape set video short course, given by Oz Yílmaz and based on his Seismic Data Processing , was produced by Western Geophysical and offered to SEG to market. Membership: 14 964. 1991 Attendance at the 61st Annual Meeting in Houston was 10 670. The Executive Committee adopted a policy of holding a midyear meeting annually in a venue outside North America. 1992 Successful meeting held in Moscow. Record income of just under $7 million for the year. 1993 GEOROM , a set of CD-ROMs containing fifty-seven volumes of Geophysics - 1936-1992 - fully searchable, was produced. The mortgage on SEG's building, the Geophysical Resource Center, was retired. 1994 A nine-year decline in membership was interrupted when gains were shown in each category of membership. GEOROM was expanded to include selected articles from The Leading Edge plus Sheriff's Dictionary , The Cumulative Index, and Expanded Abstracts from the Annual Meeting. An SEG Home Page, hosted by Stanford University and maintained by volunteers led by Brian Spies, was established. 1995 A CD-ROM of the Expanded Abstracts of that meeting was offered at the Annual Meeting in Houston. 1996 The donation of a Sun Netra Webserver to SEG by Sun Microsystems allowed the Web site to be moved to the Business Office, enabling the entire Internet operations to be done in-house. 1997 The Distinguished Instructor program was inaugurated, wherein a selected individual presents a short course in various sites around the globe. The first instructor is Ian Jack. A constitutional amendment was approved which increased the membership of the Nominations Committee from the historical three most recent past-presidents by four members to be selected by a prescribed method from the Sections and Associated Societies. 1998 An all-time record of 1457 booths were sold for the Annual Meeting in New Orleans. The SEG Museum was reorganized by the addition of a Virtual Museum and Traveling Museum to the existing museum in Tulsa. The Distinguished Educator program was launched and Robert R. Stewart of the University of Calgary was chosen as the first honoree. A new logo was adopted by the Council to reflect the Society's increasingly international nature. 1999 Despite a turbulent year in the petroleum industry, the Annual Meeting in Houston drew 11 103 attendees, and there were 1276 booth sales--second-highest total ever. Also, paid membership grew to nearly 16 000, the highest total since 1987. A major redesign of the SEG Web site was completed, and an equipment donation from Sun Microsystems helped prepare SEG for a bold digital future. 2000 SEG Annual Meeting returns to Calgary for the first time since 1977. This is only the third time the meeting has been held outside the United States. Sally Zinke becomes the first woman to hold the office of SEG President. The increasing percentage of members residing outside the U.S. causes the International Affairs Committee to be radically restructured and renamed the Global Affairs Committee. Membership: 16 894. 2001 The SEG Executive Committee authors a strategic vision of the future of geophysics and SEG’s role in it. While SEG's Annual Meeting is under way in San Antonio, the terrorist attacks of September 11 take place. The meeting proceeds with only minor disruptions. Mary L. Fleming, director of programs at the American Statistical Association, is selected executive director in December. 2002 The fourth edition of SEG's all-time best-selling book, retitled Encyclopedic Dictionary of Applied Geophysic s to reflect the increasingly diverse employment of the membership, is published. Attendance at the Annual Meeting is disappointing, probably because of the out-of-the-mainstream venue (Salt Lake City) and the travel restrictions imposed after the terrorist attacks a year earlier. However, the meeting has one of the all-time magical moments of any SEG convention—the multimedia presentation of Robert Ballard, discoverer of the Titanic , which wows hundreds of junior high students and experienced geoscientists. 2003 SEG membership exceeds 20 000 for the first time, and a majority of members lives outside the United States. 2004 To address income disparity among geophysicists around the world, the Council approved a three-tiered dues structure that allows Active membership at all three levels. Membership approaches 23 000. 2005 SEG marked its 75th anniversary with celebrations at section meetings throughout the world, a special publication, retrospective journal articles, a video about geophysics and the Society, an extra distinguished lecture, historical photos on the SEG Web site, and special exhibits at the Annual Meeting in Houston. Membership surpassed 25 000 late in the year. 2006 SEG held a highly successful Annual Meeting in New Orleans barely a year after Hurricane Katrina devastated the city. Membership exceeded 27 000 late in the year. 2007 The SEG Foundation launched a US$15 million major-gifts campaign, “Advancing Geophysics Today, Inspiring Geoscientists for Tomorrow,” aimed at accelerating the rate of geophysical innovation and knowledge transfer and attracting more young people to careers in the geosciences. 2008 SEG opened its first office outside the United States in Beijing, China, on 3 April. The SEG Foundation exceeded its US$15 million campaign goal, celebrating pledges totaling more than US$17 million during a celebration at the Annual Meeting in Las Vegas, USA. At year’s end, pledges totaled US$17 232.410. SEG membership exceeded 33 000. 2009 Despite a worldwide recession, SEG's Annual Meeting in Houston drew more than 9,200 delegates and filled four exhibit halls with technical session posters and exhibits.
China is the world's most populous country and the second largest energy consumer behind the United States. Rising oil demand and imports have made China a significant factor in world oil markets. 中国 是世界上 人口最多 的国家, 仅次于美国的 第二大能源 消费国。 不断上涨的石油 需求和进口使得 中国 成为世界 石油市场 的重要因素。 China is the world’s second-largest consumer of oil behind the United States, and for the first time the second-largest net importer of oil in 2009. 中国 是世界上 仅次于美国 的第二大石油消费国 ,2009年 第 一次成为世界 第二 大石油 净进口国 。 China’s largest oil fields are mature and production has peaked, leading companies to focus on developing largely untapped reserves in the western interior provinces and offshore fields. 中国的大油田都已进入成熟和开采峰值阶段,导致中国的石油公司将重点集中在西部地区未开发储量和海上油田。 Although natural gas use is increasing in China, it only comprised 4 percent of the country’s total energy consumption in 2008. 尽管中国的天然气消费日益增长,但还是只占2008年能源总消费的4%。 China is the largest producer and consumer of coal in the world, and many of China’s large coal reserves have yet to be developed. 中国是全球最大煤炭生产和消费大国,中国还有许多大型煤炭储量有待开发。 China’s electricity generation continues to be dominated by fossil fuel sources, particularly coal. The Chinese government has made the expansion of natural gas-fired and renewable power plants as well as electricity transmission a priority. China commissioned the Three Gorges Dam hydroelectric facility, the largest hydroelectric project in the world, in 2009. 引自: http://www.eia.doe.gov/countries/country-data.cfm?fips=CH#undefined
页岩气是富集在页岩地层内的天然气(Shale gas refers to natural gas that is trapped within shale formations)。页岩本生是很好的生油(气)岩之一。几十年来,利用水平井(horizontal drilling)和水利压裂(hydraulic fracturing )相结合开采出了之前无经济开采价值的页岩气。对页岩地层的天然气开采使得美国的天然气工业重新焕发活力。 图1 天然气资源地质概要图 图2 美国48个州页岩气储层分布图 参考资料: http://blog.sciencenet.cn/home.php?mod=spaceuid=339326do=blogid=430099 http://www.eia.doe.gov/energy_in_brief/about_shale_gas.cfm
根据最新2009年统计数据表明,中东和北非国家天然气日产量占全球1/5。 In 2009 (the latest year data are available), Middle Eastern and North African (MENA) countries produced about 55 billion cubic feet per day (Bcf/d) of dry natural gas, which is about one-fifth of the estimated total worldwide daily supply and just under the average daily U.S. dry natural gas production of about 56 Bcf/d for the corresponding year. No single MENA country represented more than 5% of 2009 global dry natural gas production. Iran was the leading dry natural gas producer (12.7 Bcf/d) in MENA in 2009, a level about 20% of total 2009 U.S. natural gas consumption. MENA countries hold a much larger share of global liquefied natural gas (LNG) exports. In 2009, MENA accounted over 40% of worldwide LNG exports. Qatar's LNG exports alone reached nearly 1,800 billion cubic feet, about 20% of the global total.
据美国能源署统计,中东和北非国家石油日产量占全球1/3。 Middle Eastern and North African (MENA) countries supplied about 30 million barrels per day (mmb/d) of liquid fuels in 2010, or more than one-third (see chart) of the estimated total worldwide daily supply of 86.3 mmb/d. Three countries: Saudi Arabia (10.07 mmb/d), Iran (4.25 mmb/d), and the United Arab Emirates (2.81 mmb/d), accounted for about 57 percent of total MENA liquid fuels production on average (see map) between January and November 2010 (latest figures available). Together, Algeria and Libya comprised about 5 percent of global liquid fuels production, or nearly 4 mmb/d.
根据美国地球物理学家学会(SEG)安排,韩国地球物理学家将来中国讲学。他在四月上中旬先后会在中国石油大学、中国地质大学、BGP和成都理工大学访问讲学。讲学内容围绕四维地球物理综合解释方面的最新进展,有兴趣朋友可以联系参加。 题目“ Incorporating the Fourth Dimension into Geophysical Data Interpretation” 内容简介 Most geophysical methods aim to obtain spatially varying information concerning subsurface material properties. As a result their measured data and interpreted results are expressed in terms of spatial coordinates. However, in some special geophysical approaches, in addition to the spatial domain, the variations of material properties in non-spatial dimensions are studied. Typical techniques of this kind are time-lapse geophysical monitoring and the Spectral Induced Polarization (SIP). These two different methods can be viewed under the same interpretation angle in the sense that nonspatial dimension (time or frequency) is incorporated into the data measurement and interpretation procedures. This lecture introduces a new interpretation approach in which both the spatial and nonspatial dimensions are jointly considered within the geophysical processing procedure. Common practice was to treat this type of "complex" geophysical data as an assembly of individual spatial datasets. Consequently, individual interpretation of each dataset leads to retrieving individual spatial parameter models which are difficult to correlate along the new axis. In the new approach, both measured data and the subsurface model are considered in a unified coordinate system defined in both spatial and nonspatial domains. Subsequently the sets of the individual structural models and data in the space domain become respectively a single model and a single data set in the new global coordinate system. This allows us to obtain a subsurface structure in both space and nonspace domains using just a single inversion process, and furthermore to introduce á priori information along the nonspatial axis. Overall the new approach provides a more solid tool to interpret this type of data and allows the more realistic representation of the subsurface structure. The lecture will be balanced between presentation of the theoretical development and the demonstration of the practical applicability. This will be achieved mostly by presenting practical application of the approach into resistivity monitoring and SIP data coming from various environmental and engineering case studies such as hydro-geophysical experiments, assessment of ground re-enforcement works, ground condition changes caused by tunnel construction works, landslide, etc. 中国访问和讲学时间安排 12 April Beijing,China China University of Petroleum (Beijing) Geophysical Society 13 April Beijing,China China University of Geosciences, Geophysical Society (Beijing) 14 April Beijing,China BGP 18 April Chengdu,China Chengdu University of Technology 韩国地球物理学家Jung-Ho Kim简介 Jung-Ho Kim received a B.Eng. (1980) in mining engineering, an M.Eng. (1982) and a Ph.D. (1987) in applied geophysics from Seoul National University, South Korea. In 1982 he joined the Korean Institute of Geoscience and Mineral Resources (KIGAM) where he is currently working as a tenured researcher. His research interests were mainly focused in the modeling and inversion of electrical and electromagnetic methods and their applications to engineering and environmental problems. His early research efforts in the 90's on resistivity inversion have contributed to rendering 2D- and 3D- resistivity imaging popular and the most common geophysical method in the Korean geophysical community in 90s. Further, Kim's research in radar methods involved addressing borehole and directional radar techniques. His research interests also extended into addressing geophysical problems in more complicated environments, such as water covered areas, anisotropic environments, etc. His recent research interests lie with multiparametric and multidomain interpretation of electrical and electromagnetic data. As a result of his research achievements, the Ministry of Science and Technology of Korea selected his research group, Geo-electric Imaging Lab., to become a National Research Laboratory. He served the Korean Society of Exploration Geophysicists (KSEG) as the editor-in-chief from 2005 to 2007 and as a special guest editor of the journal jointly published by KSEG, the Society of Exploration Geophysicists of Japan and the Australian Society of Exploration Geophysicists from 2004 to 2007. He has been awarded the distinction of "Researcher of the Year" from three institutions: the Korean Institute of Mineral and Energy Resources Engineering (1998), KIGAM (2007) and KSEG (2009). He is also an adjunct professor at the Korea Advanced Institute of Science and Technology, where he is teaching geophysical imaging techniques.
维基百科列出了一些著名的地震学家,可能不全,欢迎大家补充!我们会及时更新! Notable seismologists(引自维基百科网站) Aki, Keiiti Anderson, John G. Beroza, Gregory Bolt, Bruce Claerbout, Jon Dziewonski, Adam Marian Ewing, Maurice Galitzine, Boris Borisovich Gamburtsev, Grigory A. Gutenberg, Beno Hanks, Thomas, C. Hough, Susan Hutton, Kate Jeffreys, Harold Jones, Lucy Jordan, Thomas Kanamori, Hiroo Keilis-Borok, Vladimir Knopoff, Leon Lehmann, Inge Mallet, Robert Mercalli, Giuseppe Milne, John Mohorovičić, Andrija Oldham, Richard Dixon Sebastio de Melo, Marquis of Pombal Press, Frank Richards, Paul G. Richter, Charles Francis Sekiya, Seikei Sieh, Kerry Paul G. Silver Tucker, Brian Vidale, John Wen, Lianxing Winthrop, John Zhang Heng
上述实验指导书的PDF文件下载: 地震勘探原理 实验1 以下是P_and_S_waves.m的matlab程序 function P_and_S_waves clear all close all f = 2; T = 1/f; omega = 2*pi*f; vel = 3000; %xg = %zg = % Set up array of depths x1 = ; x2 = x1; nx = length(x1); k = 2*pi*f/vel; %Start time step loop n=40; M=moviein(n); for it=1:n t=T*(it)/n; for ix=1:nx A1(ix) = 0.2*cos(k*x1(ix)-omega*t); A2(ix) = 0.0; x2(ix) = x1(ix)+100*cos(k*x1(ix)-omega*t); end % Plot S-wave plot(x1*0.001,A1+1.0,'o'); hold on plot(x1*0.001,A1+1.3,'o'); plot(x1*0.001,A1+1.15,'o'); plot(x1*0.001,A1+0.85,'o'); plot(x1*0.001,A1+0.7,'o'); plot(x1(20)*0.001,A1(20)+1.30,'ro') plot(x1(20)*0.001,A1(20)+1.15,'ro') plot(x1(20)*0.001,A1(20)+1,'ro') plot(x1(20)*0.001,A1(20)+0.85,'ro') plot(x1(20)*0.001,A1(20)+0.70,'ro') plot(x1(1)*0.001,A1(1)+1.30,'ro') plot(x1(1)*0.001,A1(1)+1.15,'ro') plot(x1(1)*0.001,A1(1)+1,'ro') plot(x1(1)*0.001,A1(1)+0.85,'ro') plot(x1(1)*0.001,A1(1)+0.70,'ro') % Plot P-wave plot(x2*0.001,A2-1.3,'o'); plot(x2*0.001,A2-1.15,'o'); plot(x2*0.001,A2-1.0,'o'); plot(x2*0.001,A2-0.85,'o'); plot(x2*0.001,A2-0.7,'o'); plot(x2(20)*0.001,A2(20)-1.30,'ro'); plot(x2(20)*0.001,A2(20)-1.15,'ro'); plot(x2(20)*0.001,A2(20)-1,'ro'); plot(x2(20)*0.001,A2(20)-0.85,'ro'); plot(x2(20)*0.001,A2(20)-0.70,'ro'); plot(x2(1)*0.001,A2(1)-1.30,'ro'); plot(x2(1)*0.001,A2(1)-1.15,'ro'); plot(x2(1)*0.001,A2(1)-1,'ro'); plot(x2(1)*0.001,A2(1)-0.85,'ro'); plot(x2(1)*0.001,A2(1)-0.7,'ro'); hold off axis( ) title('P-waves and S-waves') ylabel ('A') xlabel ('(km)') M(:,it)=getframe; end movie(M,10) print -dpsc P-wave-and-S-wave.ps 以下是rayleigh_waves.m的matlab程序 function rayleigh_waves clear all close all f = 0.5; T = 1/f; omega = 2*pi*f; vel = 3000; ncol = 7; % Set up array of depths x = ; z = ; Ax = 200; Az = 200; nx = length(x); nz = length(z); k = 2*pi*f/vel; lamda = 750; %Start time step loop n=40; M=moviein(n); for it=1:n t=T*(it)/n; for ix=1:nx dx(ix) = 0.001*(x(ix)+Ax*exp(z(1)/lamda)*sin(k*x(ix)-omega*t)); dz(ix) = 0.001*(z(1)+Az*exp(z(1)/lamda)*cos(k*x(ix)-omega*t)); end plot(dx,dz,'o-') hold on plot(dx(20),dz(20),'or') axis( ) title('Rayleigh wave f=0.5 Hz') ylabel ('depth(km)') xlabel ('(km)') for iz=2:ncol-1 for ix=1:nx dx(ix) = 0.001*(x(ix)+Ax*exp(z(iz)/lamda)*sin(k*x(ix)-omega*t)); dz(ix) = 0.001*(z(iz)+Az*exp(z(iz)/lamda)*cos(k*x(ix)-omega*t)); end plot(dx,dz,'o') end for ix=1:nx dx(ix) = 0.001*(x(ix)+Ax*exp(z(ncol)/lamda)*sin(k*x(ix)-omega*t)); dz(ix) = 0.001*(z(ncol)+Az*exp(z(ncol)/lamda)*cos(k*x(ix)-omega*t)); end plot(dx,dz,'ro') for iz=ncol+1:nz for ix=1:nx dx(ix) = 0.001*(x(ix)+Ax*exp(z(iz)/lamda)*sin(k*x(ix)-omega*t)); dz(ix) = 0.001*(z(iz)+Az*exp(z(iz)/lamda)*cos(k*x(ix)-omega*t)); end plot(dx,dz,'o') end hold off M(:,it)=getframe; end movie(M,10) print -dpsc rayleigh-wave.ps 以下是synseismic.m的matlab程序 dt=0.001; % sampling rate in seconds freq=15; % peak frequency of wave in Hertz %%Do not change the following tracelength=1000;% length of trace lengthwave=round(1.5/freq/dt);% length of wave temp= ; % temporary variable timeaxis=temp*dt;% time axis % wave=-sin(temp*dt*2*pi*freq).*hanning(lengthwave+1)';% this is the wave wave=-sin(temp*dt*2*pi*freq) tracelength=max(lengthwave,tracelength);% error checking tracewave=zeros(1,tracelength); tracewave(1,1:lengthwave+1)=wave; freqaxis= /length(tracewave)/dt;% frequency axis fftwave=abs(fft(tracewave));% fourier transform of wave %% The following plots the wave and the fourier transform of the wave figure subplot(2,1,1) plot(timeaxis,wave) title('Input wave') xlabel('Time (sec)') ylabel('Amplitude') grid subplot(2,1,2) plot(freqaxis(1:round(length(tracewave)/2)),fftwave(1:round(length(tracewave)/2))) title('Fourier transform of input wave') xlabel('Frequency (Hz)') ylabel('Amplitude') grid %% The following calculates the reflection series and seismic trace %% Do not change the following refserlength=1001;% length of reflection series refsertime= *dt;% time axis of reflection series refser=zeros(1,refserlength);% reflection series refser(1,150)=0.8; refser(1,175)=0.5; refser(1,300)=0.25; refser(1,333)=-0.75; refser(1,500)=0.69; refser(1,600)=0.2; refser(1,750)=-0.33; refser(1,833)=0.45; refserfft=abs(fft(refser));% fourier transform of reflection series freqaxisrefser= /refserlength/dt;% frequency axis seismictracetemp=conv(wave,refser);% convolution of wave with reflection series seismictrace=seismictracetemp((round(lengthwave/2)+1):(round(lengthwave/2)+refserlength)); seismictracefft=abs(fft(seismictrace));% fourier transform of seismic trace figure subplot(2,1,1) plot(refsertime,refser) title('Reflection series') xlabel('Time (sec)') ylabel('Amplitude') subplot(2,1,2) plot(freqaxisrefser(1:round(refserlength/2)),refserfft(1:round(refserlength/2))) title('Frequency spectrum of reflection series') xlabel('Frequency (Hz)') ylabel('Amplitude') figure subplot(2,1,1) plot(refsertime,seismictrace) title('Seismic trace') xlabel('Time (sec)') ylabel('Amplitude') subplot(2,1,2) plot(freqaxisrefser(1:round(refserlength/2)),seismictracefft(1:round(refserlength/2))) title('Frequency spectrum of seismic trace') xlabel('Frequency (Hz)') ylabel('Amplitude')
AASPI (Attribute-Assisted Seismic Processing and Interpretation)( 俄克拉荷马大学 属性辅助地震处理与解释) University of Aberdeen (Aberdeen大学) AGL (Allied Geophysical Laboratories) (休斯顿大学应用地球物理实验室) The University of Alberta( 阿尔伯特大学) BEG (The University of Texas Bureau of Economic Geology)( 德克萨斯大学经济地质局) BGS (British Geological Survey)( 英国地质调查局 ) BLISS (BLind Identification of Seismic Signals)( 地震信号盲辨识) University of Calgary(加拿大卡尔加里大学) University of Cambridge(剑桥大学) CDSST (Consortium for the Development of Specialized Seismic Techniques at UBC) CEMAT (Consortium for Economic Migration and Tomography) CEMI (Consortium for Electromagnetic Modeling and Inversion) CFRA (Center for Rock Abuse) CHDC (Centre for High Definition Geophysics) CHORUS (Consortium for Heavy Oil Research by University Scientists) CREWES (Consortium for Research in Elastic Wave Exploration Seismology) CRG (Centre for Reservoir Geophysics) CRGC (Curtin Reservoir Geophysics Consortium) CSM (Colorado School of Mines) CTG (Centre for Technical Geoscience) CU (University of Colorado, Boulder) Curtin University of Technology CWP (Center for Wave Phenomena) DELPHI (DELft PHilosophy on Inversion) DELPHI-AP (DELPHI Acquisition and Preprocessing Programme) DELPHI-CS (DELPHI Dynamic Reservoir Characterization Flow Simulation) DELPHI-MI (DELPHI Multiple Removal Structural Imaging) EAP (Edinburgh Anisotropy Project) EDGER (Forum for Exploration and Development Geophysics Education and Research at UT-Austin) Heriot-Watt University, Edinburgh EGG (Experimental Geophysics Group) EGI (Energy and Geoscience Institute) Energistics ENSMP (Ecole des Mines de Paris) ERL (Earth Resources Lab) ESRI (Earth Sciences and Resources Institute) ETLP (The Edinburgh Time-Lapse Project) FRP (Fold-Fault Research Project) Free University of Berlin GBDS (Gulf Basin Depositional Synthesis) GMRC (Gravity and Magnetics Research Consortium) GOCAD GPRI (Global Petroleum Research Institute) University of Hamburg Geophysical Institute UH (University of Houston) IC3RPC (The OU Integrated Core Characterization Center Rock Physics Consortium) ICL (Imperial College London) IFP (Institut Français du Pétrole; The French Petroleum Institute) INRIA (Institut National de Recherche en Informatique et en Automatique; The French National Institute for Research in Computer Science and Control) IPGP (Institut de Physique du Globe de Paris) ISG (Injected Sands Group) iSIMM (integrated Seismic Imaging and Modeling of Margins) ITF (The Industry Technology Facilitator) KIM (Kinematic Inversion Methods) University of Leeds Ocean Margins LINK programme LITHOS LRBRP (Lacustrine Rift Basin Research Program) Memorial University of Newfoundland ModTom (Modelling and Geophysical Tomography Group) M-OSRP (Mission-Oriented Seismic Research Program) Nancy School of Geology University of Nevada at Reno University of Nice OPERA (Organisme Pétrolier de Recherche Appliquée -- Applied Geophysical Research Group) University of Oklahoma OU Mewbourne School of Petroleum and Geological Engineering PHASE (Physics and Applications of Seismic Emission) PLATES PPDM (Public Petroleum Data Model Association) Charles University (Prague, the Czech Republic) RCP (Reservoir Characterization Project) Rice University RIPL (Rock and Ice Physics Laboratory) RSMAS (Rosenstiel School of Marine and Atmospheric Science) SAIG (Signal Analysis and Imaging Group) SCRF (Stanford Center for Reservoir Forecasting) Scripps Institution of Oceanography SEISCOPE SEMC (Seafloor Electromagnetic Methods Consortium) SEP (Stanford Exploration Project) SINBAD (Seismic Imaging by Next-generation BAsis function Decomposition) Sintef petroleum research Sintef Seismic SLIM (Seismic Laboratory for Imaging and Modeling) SRB (Stanford Rock Physics and Borehole Geophysics Project) Stanford (Leland Stanford Junior University) SW3D (Seismic Waves in complex 3-D structures) Syracuse University Department of Earth Sciences TAMU (Texas AM University) TEES (Texas Engineering Experiment Station, Petroleum Engineering Division) TRIP (The Rice Inversion Project) UBC (The University of British Columbia) UBC-GIF (UBC Geophysical Inversion Facility) UCL (University College London) UCSC (University of California Santa Cruz) UT (The University of Texas at Austin) University of Utah UTAM (Utah Tomography and Modeling/Migration Consortium) UTD (University of Texas at Dallas) UTD Geophysical Consortium UTIG (The University of Texas at Austin Institute for Geophysics) VRGEO (Geophysical visualization research) WIT (Wave Inversion Technology Consortium Project) WTOPI (Wavelet Transform On Propagation and Imaging) 以上链接来自 www.seg.org网站
课件链接: http://dqwl.yangtzeu.edu.cn/maonb/jxnr/jiaoan/Maonb_2011_seismic_exploration(03).exe 阅读材料: 陆基孟等《地震勘探原理》(第三版)p32-p41 思考题 1、在地震勘探中,经常把地下的介质做哪些简化? 2、地震勘探野外工作中为什么不采用自激自收的观测方式? 3、什么叫地震的纵测线和非纵测线? 4、纵测线,一个水平分界面,均匀介质情况下共炮点的直达波时距曲线有何特点? 5、直达波的时距曲线一定是直线吗? 6、纵测线,一个水平分界面,均匀介质情况下共炮点的反射波时距曲线有何特点? 7、纵测线,一个水平分界面,均匀介质情况下共炮点的反射波时距曲线和直达波时距曲线之间有怎样的关系? 8、学会从地震野外记录中识别直达波和反射波. 9、纵测线,一个倾斜分界面,均匀介质情况下共炮点的反射波时距曲线有何特点?和水平界面条件下有和异同? 10、浅层的反射波时距曲线和深层的反射波时距曲线弯曲程度有差异, 为什么? 作业( 2011-3-7交到课堂上来) 必做作业 陆基孟等《地震勘探原理》(第三版) p483 习题3 p484习题4 必做作业 指出下图中(共激发点地震记录)激发点位置和接收点位置,纵坐标是什么单位?图中直达波和反射波具体位置?有何特点? 以下英文作业至少必做一题 1:利用费马原理( Fermat’s principle )证明反射定律和透射定律 Objective(目的) To understand the importance of Fermat’s principle in deriving Snell’s law in the reflection and refraction cases. Introduction(介绍) Fermat’s principle states that a wave will take that path which will make the traveltime stationary (i. e., maximum or minimum). Mathematically: dT / dX = 0, where T is the total traveltime along the wave path and X is the distance from the source to the point where the wave changes its direction (e.g., point of reflection or refraction). In most situations in the earth, the stationary path is the minimum-time path. 利用费马原理证明反射定律 图1 利用费马原理证明反射定律示意图 图例: S: Source 震源 R: Receiver 接收点 C: Reflection point 反射点 ES: Earth’s surface 地表面 SR: Subsurface reflector 地下反射界面 H: Layer thickness 地层厚度 V: Layer velocity 地震波速度 D: Source-receiver offset 炮检距 X: Distance to reflection point 激发点到反射点距离 Q i : Incidence angle 入射角 Q r : Reflection angle 反射角 大家也可以思考一下如何证明透射定律。 2:反射系数的计算 Objective To calculate the reflection coefficients(反射系数) between different lithologies and determine the effect of ignoring the density in calculating the reflection coefficient. Introduction The reflection and transmission coefficients (R, T) are defined as: R = (Z2 – Z1) / (Z2 + Z1) T = 1 – |R| = 2Z1 / (Z2 + Z1); where Z =D V is the acoustic impedance,D and V are the density and velocity, respectively. Exercises Given the attached velocity-density model(如图2): 1. Calculate R = R(V,D ) at each interface(界面). 2. Calculate T = T(V,d ) at each interface. 3. Calculate R = R(V) at each interface using only velocities (i.e., drop r from the formula). 4. Calculate the absolute error between R found in steps 1 3. The absolute error is defined as: 5. Plot E(%) versus: a. |R| b. V2/V1 c. D 2/D 1 6. How does E(%) changes with: a. |R| b. V2/V1 c. D 2/D 1 7. What would you do if you were given only V and have been asked to calculate R? 图2 某口井速度和密度随深度的变化关系 代表密度的意思()里面是单位----与作业里面的D意思相同-----
由于这次毕业典礼的上半场无票无法进入,校长 Susan Hockfield 讲话我是在学校的实况转播上观看的。讲话视频地址: http://amps-webflash.amps.ms.mit.edu/public/comm2010/webcast_ARCHIVE/speeches-midflv.html MIT President Susan Hockfield delivers her charge to the graduates at the Institute's 144th Commencement on Friday, June 4. MIT校长Susan Hockfield 在6月4日MIT第144界毕业典礼上的讲话如下: Todays graduates of MIT: This day is, truly, for you. Here, in the stately embrace of Killian Court, we gather to celebrate your success. You have distinguished yourselves in courses of study that stand among the most demanding in the world. For all that you have accomplished, we congratulate you. In the midst of celebrating your achievements, our joy would be incomplete if we did not recognize two groups of people who helped bring you to this moment: First, your families and friends, many of whom join us today, with justifiable pride and with joy. We welcome them, knowing full well that none of you would be here, clothed in solemn academic regalia, without the constant confidence of family members and friends who embraced your dreams and lighted your paths. This is their day, too. Graduates, I invite you to rise, and to join me in thanking your families and friends. The second group to thank includes your many teachers and mentors here at MIT. Our remarkable faculty have devoted their lives to exploring and explaining the unknown. And they welcomed you to join them in the race to the frontiers of human understanding. Lets take a moment to thank the women and men who shared their discoveries, ignited your enthusiasm with their own, and taught you the infinitely useful discipline of mind and hand. Speaking for the faculty, one of the great pleasures of MITs academic community is that we are all teachers, and we are all students, all the time. And so today, though it is technically my job to offer a charge to you, our graduates, I want to start by explaining how much my generation can learn from yours. I will skip past the things that we will probably never learn, like the proper way to unfriend someone or how to talk about using Twitter, with a straight face, and move on to a few qualities that seem to shine out in everything you do, and that the world needs now more than ever. My generation endured, and sometimes incited, struggles that threatened to tear this nation apart. Those struggles, while accelerating change in many dimensions, often produced more noise than effect, and they left cracks in some of the pillars of community, especially in the idea of responsibility to the larger community beyond the self. When Bill Gates came to campus this spring, he encouraged you, as he said, to make sure that our brightest minds are working on most important problems. But with so many of you already devoting your creativity, time and passion to tackling the worlds most pressing challenges, he spoke here not merely to an audience inclined to follow his advice, but to those already leading the way. Yet your generation wears its commitment to the greater good quite lightly. You use your skills to help repair a broken world, however, you see nothing remarkable about it; you simply expect it of each other, and of yourselves. Over the past decade, the number of students who volunteer through MITs Public Service Center has grown somewhat, but the real difference lies in the depth and ambition of their engagement, which has blossomed from interest in volunteering in the neighborhood now and again, to a deep culture of service that has inspired members of the Class of 2010 to launch a free summer camp for the children of local cancer patients, to bring battery-enhanced electricity to remote villages in Tanzania, and to design wheelchairs for people in developing nations around the world. At the same time, MBA students in MIT Sloans wildly popular Global Lab program, or G-lab, have used their newfound business skills to magnify the power of fledgling enterprises, like developing a scalable business model for food carts that deliver nutritious meals to children in Indonesias poorest neighborhoods. And you have also put your shoulders to the wheel that accelerates economic growth, by launching the kind of innovation-based businesses that drive our nations economy and the worlds. This years MIT Sloan graduates alone are rolling out 35 start-up companies, as we speak, seven of them built on new technologies invented at MIT. You have surely inherited one thing from my generation: a copious stockpile of jargon. Jargon that attempts to capture and control some of the untamed conditions of our world by affixing a name to them: Globalization. Diversity. Work-Life Balance. You, quite properly, treat our jargon as quaintly obsolete: You swap the conflicted notion of globalization for the bright conviction that you can work anywhere and you should. You dont fret about diversity, you simply choose the people with whom you live and work based on interests and talents that transcend yesterdays 20th century boundaries. And why would you let your life and your work get out of balance anyway? Just launch a company that values both as much as you do. You have also transformed one jargon-heavy platitude into the great challenge of your generation. Today, we all look out on a world riddled with manifestly unsustainable systems, from the environment to the global economy; from healthcare to transportation; from water, to cities, to energy ailing systems whose remedies will call on the core strengths of MIT. It is that call on MITs intellectual resources that brought President Obama to our campus in October, to highlight the critical need to develop clean energy technologies, at great speed, and on a prodigious scale. He urged you to defy the easy complacency of pessimism, reminded you that we are heirs to a legacy of innovation, and challenged you to help invent our clean energy future. I am extremely proud that you are answering that call and expanding its challenge by insisting on and inventing ambitiously sustainable systems: Some of you are inventing sustainable practices through engineering and entrepreneurship: The students who won this years $100K Competition proposed a start-up that will bring the world a nanoengineered cement, stronger than any existing version and promising to cut the torrent of CO2 generated during standard concrete production in half. Some of you are pursuing sustainability by rethinking the systems that society depends on, like the Aeronautics and Astronautics students who worked with Professor Mark Drela and others to envision a new plane that consumes 70% less fuel, or the doctoral candidate who analyzed how to balance the rising demand for air travel with improving air quality and climate impacts, and helped shape new international rules governing commercial aviation. Some of you create sustainable solutions by applying new technology to old problems, like providing basic, affordable healthcare for everyone. In this years IDEAS competition, one winning student team invented PerfectSight, an extremely affordable system for diagnosing nearsightedness and farsightedness using a cell phone. And some of you are pursuing sustainability through policy change: Last week in Congress, Senator Jeff Bingaman introduced an important new energy bill that aims to deliver dramatic gains in energy efficiency from our complex energy supply chains, a supremely MIT idea that he first learned about through our graduate student-led Energy Club. Whatever field you choose, I hope and I fully expect that you will advance the cause of sustainability. But I anticipate that you will push us even further, beyond the clich, because simple sustainability is not enough; it is necessary but not sufficient. By itself, sustainability resembles the medical principle, First, do no harm, a guardrail to protect us from a precipice. But with the particular strengths of your generation, the ingenuity and practicality you learned at MIT, and an appreciation of the distant ramifications of present action, I believe you have the power to set us a more ambitious goal, to move from sustainability to a far-reaching kind of healing, from doing no harm to doing a great deal of good. Graduates of MIT: Today is your day, and now is your moment to take all you have learned at MIT the power of analysis; the capacity for good old-fashioned hard work; the fearless creativity; and the commitment to restoring an unsustainable world and put them to work around the globe. In person and on-line, through the Alumni Association and through your friends, I encourage you to stay connected to MIT for the rest of your lives. For all that you have created, discovered, invented, explored and mastered at MIT Congratulations MIT graduates of 2010.
奥巴马总统美国东部时间10月23日中午在MIT访问期间有很多花絮。有支持清洁能源的,有反战的,什么声音都有。没有人喊口号,没有骚乱,只是静静的打着标语。。。。。想让总统知道(出于安全因素可惜看不见),想让世人知道他们的想法。。。警察自始至终没有干预。。。这就是美国的自由。下面是博主拍摄的一些花絮,大家欣赏。 奥巴马总统在进入会场(转载) 不知道是抗议还是欢迎 The President at MIT 点击左边按钮播放 .
奥巴马总统演讲视频网址 http://amps-web.mit.edu/public/amps/webcast/2009/obama-2009oct23/ MIT校长Susan主持会议(转载) 奥巴马走上讲台(转载) 奥巴马总统演讲电视照片(博主拍摄) 奥巴马总统演讲电视照片(博主拍摄) 在MIT主楼大厅教室收看演讲实况的学生们(博主拍摄) 在4-237教室收看演讲实况(博主拍摄) 在26-100教室收看演讲实况的老师和学生们(博主拍摄) 如此多的人都没有办法进入会场(博主拍摄) 尽管看不见奥巴马总统,但是和他也就不到100米的距离了(博主拍摄) 奥巴马总统10月23日(美国东部时间)中午在参观MIT部分实验室后12点30分在MIT的Kresge Auditorium 发表了大约30分钟的讲演,主要内容是美国在清洁能源中的领导作用。Kresge Auditorium 大约能容纳1000左右听众,MIT的教职员工大约有200张票,普通人员就没有办法目睹奥巴马的风采了。不过MIT设了很多报告厅和教室大屏幕电视现场直播演讲实况,MIT网站上也同时直播演讲内容。奥巴马总统的来访日几乎成了MIT的节日,难得见到那么多人出来。 MIT校内新闻如下(转载) President Barack Obama, in a historic visit to the MIT campus, praised the Institute's commitment to energy research and issued a strong call for the nation to lead the world in the development of new, efficient and clean energy technologies. Nations everywhere are racing to develop new ways to produce and use energy, he said in remarks delivered to a packed Kresge Auditorium. The nation that wins this competition will be the nation that leads the global economy. I'm convinced of that. And I want America to be that nation. Before delivering his speech on American leadership in clean energy, the President was escorted by MIT President Susan Hockfield and MIT Energy Initiative Director Ernest Moniz on a tour of MIT laboratories conducting energy research. Extraordinary research being conducted at this Institute, Obama said, citing work that could lead to windows that generate electricity, batteries that are grown by viruses rather than being built, highly efficient new lighting systems and ways of storing energy from offshore windmills so that it can be delivered when needed. You just get excited being here, and seeing these extraordinary young people, he said. It taps into something essential about America, he said, asserting that the nation has always been about discovery. It's in our DNA. 'Heirs to a legacy of innovation' Obama's talk came as Congress gears up for hearings on clean energy legislation and as negotiators from around the world prepare for December's U.N. climate talks in Copenhagen. The President said that the clean-energy research he saw in the labs is a reminder that all of you are heirs to a legacy of innovation, not just here but across America, that has improved our health and our well being and helped us achieve unparalleled prosperity. But Obama indicated that this prosperity was in jeopardy, threatened in part by the very force that drives it. The system of energy that powers our economy also undermines our security and endangers our planet, he said. Discussing energy legislation that is presently working its way through the U.S. Congress with some bipartisan support, including a bill jointly sponsored by Republican Senator Lindsay Graham and Democratic Senator John Kerry, the President said he believed a consensus was growing. We are seeing a convergence, he said. The naysayers, the folks who would pretend that this is not an issue, they are being marginalized. But, he added, the closer we get, the harder the opposition will fight. Young people, he said, understand that this is the challenge of their generation. Indeed, Forgan McIntosh, co-president of the MIT Energy Club and an MBA student at the MIT Sloan School of Management, said before the event that he hoped the President would use his occasion to jump-start progress on redefining Washington's role in the energy sector and its leadership position in the global race for clean energy competitiveness. Reached after the speech, McIntosh said he was not disappointed. The President used his speech to express a solid commitment to leading the global clean energy race for both economic and climate concerns, he said. 'The go-to place' President Obama's visit to MIT was only the second in the Institute's history by a sitting president, following President Bill Clinton's appearance for a Commencement address in 1998. This was the first such visit to include a tour of laboratories and meetings with MIT faculty members. After taking the stage in Kresge, Obama began his talk with a few quips about MIT, initially describing it as the most prestigious school in Cambridge Massachusetts. The graduate of Harvard Law School quickly backtracked, adding, well, in this part of Cambridge. Then, referring to MIT's tradition of hacks, he said I might be here for a while a bunch of engineering students put my motorcade on top of Building 10. Following the speech, Moniz said Obama was truly thrilled with the work he saw and the scale of the commitment he saw here. Robert Armstrong, deputy director of the MIT Energy Initiative, said the fact that the President chose to come here for this talk illustrates the fact that MIT is becoming the go-to place for work on clean energy. Hockfield, in her remarks before the President's talk, said that President Obama has articulated a powerful vision for restoring economic growth, creating jobs and counteracting climate change by investing aggressively in clean energy research and development. Hockfield hailed the historic significance of the visit, saying the fact that President Obama has come to MIT to talk about America's potential to lead in clean energy is a tribute to the groundbreaking work of our faculty and students, including many in this room. She added that we share President Obama's view that clean energy is the defining challenge of this era. To meet the doubling of global energy demand by 2050; to drive new patents, new products, new industries and new jobs, and to mitigate climate change, clean energy is the only avenue. Chancellor Phillip L. Clay said that the President's visit signals that the administration understands the very important leadership contribution that MIT is making on the energy problem, and shows the President's commitment to applying science and technology to solving problems such as energy. Personally, he said, I'm just so pleased and proud there's no place on my body left to pinch. 奥巴马总统参观MIT实验室 President Barack Obama commended MIT for its extraordinary energy research and urged America to take leadership in cleaner technologies in a speech today at Kresge Auditorium. This is the nation that has led the world for two centuries in the pursuit of discovery. This is the nation that will lead the clean energy economy of tomorrow, Obama said to a crowd of about 750, including over 200 students and faculty. Obama singled out innovation as the solution to Americas challenges. He talked of a peaceful competition with other countries to develop alternative sources of energy. The nation that wins this competition will be the nation that leads the global economy. I am convinced of that. And I want America to be that nation, he said. He pointed out that the Recovery Act, or stimulus bill, is already leading the U.S. in the direction of green jobs and research. The act provides the largest single boost in scientific research in history, he said. The law also sets aside $80 billion dollars for creating jobs in alternative energy and energy efficiency. For Americans this investment acts not just help to end this recession, but to lay a new foundation for lasting prosperity, he said. Obama also advocated for the Senate climate change bill, which would cap greenhouse gas emissions and transform our energy system into one thats far more efficient, far cleaner. Obama Visits Bldg. 13 Before the speech, President Susan J. Hockfield and MIT Energy Initiative director Ernest J. Moniz led Obama on a tour of several laboratories focusing on clean energy and technology. Obama saw presentations on high-powered, virus-assembled batteries from Professors Angela M. Belcher and Paula T. Hammond 84; quantum dot LED lights from Professor Vladmir Bulovic; offshore wind turbines from Professor Alexander H. Slocum 82; and solar cell concentrators from Professor Marc A. Baldo. Hes just a warm, friendly human being. Slocum said. Ive met plenty of plastic politicians. Obama is just real. Crowds gather, Obama cracks jokes Obama arrived at Kresge shortly after 12:30 p.m. Cecilia R. Louis 10, a member of the Chorallaries, sang the national anthem. Both Hockfield and Moniz gave brief opening comments. Moniz praised Obamas commitment to integrating sound science and critical analysis. Obama began his speech with a light jab at his alma mater. Its always been a dream of mine to visit the most prestigious school in Cambridge, Massachusetts, he said to laughter and cheers. After a pause, he added hold on a second certainly the most prestigious school in this part of Cambridge, Massachusetts. Most students did not get tickets, but many still gathered near Kresge to try and catch a glimpse of the President. A few people also showed up to protest, drawing attention to human rights violations, the Afghanistan war, healthcare reform, and abortion. When Obamas motorcade came down Memorial Drive around 12:30 p.m., there were screams and pointing as the crowd ran down Mass. Ave. to see the procession. Later, in Kresge, Obama would return the enthusiastic greeting. You just get excited being here and seeing these extraordinary young people and the extraordinary leadership of Professor Hockfield because it taps into something essential about America its the legacy of daring men and women who put their talents and their efforts into the pursuit of discovery. Obama spoke for about 20 minutes, then came down from the podium to shake hands with MIT faculty and students. He left promptly after 1 p.m. to attend a $500-a-head fundraiser for Massachusetts Governor Deval Patrick. 早在今年3月奥巴马总统和MIT校长Susan Hockfield 就清洁能源研究问题共同发表讲话 网址 http://web.mit.edu/newsoffice/2009/hockfield-whitehouse-0323.html startUp();
奥巴马总统10月23日中午12点(美国东部时间)将在MIT做题为美国在清洁能源中的领导作用的演讲。MIT正在紧锣密鼓的准备之中。演讲的地点在著名的kresge Auditorium。按照惯例23日中午前后MIT附近的交通会有所紧张。MIT在网站上告诉师生员工座位比较紧张,希望大家谅解!我看看到时候有没有运气了,请大家关注我的跟踪报道。2009年3月奥巴马总统在白宫和MIT校长Susan Hockfield共同敦促大力推动清洁能源的研究资助,博主曾经做过相关报道( http://www.sciencenet.cn/m/user_content.aspx?id=222389 )。 MIT网站上打出的奥巴马总统演讲的通知 地图中红A指示的是奥巴马总统演讲的具体位置 空中俯瞰奥巴马总统发表演讲的 kresge 礼堂 kresge 礼堂全景图 奥巴马访问期间至MIT成员的一封信: President Barack Obama will visit MIT on Friday, Oct. 23. Details of the event were described in an e-mail sent this evening to the MIT community from Kirk Kolenbrander, MIT's Vice President for Institute Affairs and Secretary of the Corporation. The letter follows It is my great pleasure to announce that on Friday, October 23, President Barack Obama will be visiting MIT, where he will deliver an address in Kresge Auditorium on clean energy after meeting some of the MIT faculty and students whose work centers on energy. The President will be joined by Massachusetts Governor Deval Patrick. President Obamas decision to speak about energy from our campus is a high honor and one that can truly be shared by the entire MIT community. Students, faculty and staff at the Institute are helping to frame the national policy debate on energy, push the frontiers of energy research, and revitalize energy education. With our flagship energy initiative MITEI MIT is bringing real-world solutions to the most challenging problems in energy. President Obama and President Hockfield both believe that the leading minds in science and technology must bring their talent squarely to bear on creating transformational energy solutions. We are thrilled to see MIT recognized as central to that historic effort. 奥巴马总统演讲期间媒体记者注意事项: TO RSVP: Members of the media who wish to cover the visit should contact the White House Office of Media Affairs details here: www.whitehouse.gov/the_press_office/MediaRSVPMITRemarks10-23-09/ NOTE: All names submitted for credentials must be accurate and reflect the identification media presents at the check point. WHEN: Friday, Oct. 23. Press check in: 10-11 a.m.; Program: 12 p.m. WHERE: Kresge Auditorium , 48 Massachusetts Ave., Cambridge, Mass. (Note: This is directly across from the main MIT entrance at 77 Massachusetts Ave. See map here. ) FOR MORE INFORMATION, CONTACT: Patti Richards, MIT News Office, 617.253.8923; prichards@mit.edu 访问过MIT的前美国总统如下: Harry Truman was scheduled to speak here while he was in office at MIT's mid-century convocation, but canceled the appearance because he was afraid he would be upstaged by the appearance of former British Prime Minister Winston Churchill. He did appear for a speech years later, in 1956 , as an ex-president. Franklin Roosevelt made an appearance at MIT long before his presidency, in 1916, for the dedication of MIT's campus, when he was assistant secretary of the Navy. George H. W. Bush appeared at MIT in 1981, to address the annual dinner meeting of the MIT Sustaining Fellows in DuPont gymnasium, when he was vice-president. John F. Kennedy made a taped appearance, which was played during MIT's centennial celebrations in 1961. There is an unconfirmed report that Calvin Coolidge visited MIT and drank tea at Walker Memorial, but no information about when this might have taken place. 从 Main MIT entrance at 77 Massachusetts Ave看 Kresge Auditorium MIT将开放多个教室提供有限电视和网上直播(10月22日早上消息)
我来MIT很少听到有人议论甲型H1N1流感,人们似乎不惧怕这种疾病,几乎没有一个人戴口罩的。其实从今年9月开学,每周都有流感的疑似病例,到现在在MIT就诊的疑似流感病例达到了37例。MIT的医疗部门在校园报纸和网站上有流感知识介绍,校医院有专门的发热门诊。MIT报纸和网站上介绍最多的是如果出现流感症状在家好好休息,严重时候来医院就诊。不过校园内的预防甲型H1N1流感宣传画倒是不少,有的甚至贴到了洗手间。下面是我拍的一些照片,供大家参考,这些有趣图片把预防的知识都告诉了广大师生。。。。 A weekly round-up of flu-like illnesses seen at MIT Medical Week (Fri-Thu) ending: Average number of influenza-like illnesses seen per day in MIT Medical Urgent Care 10/8/2009 5 10/1/2009 8 9/24/2009 11 9/17/2009 13 Total 37 我恨流感大爆发 勤洗手 保持充足的睡眠 避免密切接触 捂住咳嗽 避免触摸你的眼睛、鼻子或嘴巴 避免触摸你的眼睛、鼻子或嘴巴 经常洗手 打流感疫苗 以下是MIT医疗中心的主任Howard M. Heller在今年9月25号 的视频讲话. Video Transcript: Howard M. Heller, MD, MPH, Chief of Medicine, MIT Medical, dispels the hype and offers advice about the H1N1 flu in this two-minute video Theres been a lot of hype over the last several months about H1N1, which some people are still calling the swine flu. One thing that its important to remember is that the H1N1 flu is very similar to the seasonal flu. Its no more contagious, its no more fatal than the seasonal flu. Should I get a flu shot? Flu shot is very important. This year, were going to be having two different vaccines. One is the seasonal flu vaccine, just like we have every year. But in addition to that, were going to be having a vaccine specifically for the H1N1. What precautions should I take? The general principles that Im sure everybody has heard about, are the hand-washing precautions, covering your mouth when you cough or when sneezing, because influenza as well as a lot of the other respiratory viruses are spread through respiratory secretions. Stay home? Youre kidding. At MIT, a lot of students, as well as faculty and other people, force themselves to go to work no matter how badly theyre feeling. Were encouraging people who have the flu, especially if they are very sick, not to do that and to stay home and take care of yourself Should I call my doctor? If youre not sure whether you should come in or if you can stay home, call. One of the doctors or nurses can advise you over the phone about whether it would be safe to stay home and rest up and try to recover, or if we think you should come in here to the Medical Department. Certainly, if somebody is very sick, meaning high fevers 103, 104 if anybody is having any difficulty breathing shortness of breath, pain in the chest, anything like that its important to come in to be evaluated, to make sure that you dont have pneumonia or another medical problem. We can also reassure everyone that MIT and MIT Medical has enough resources to care for everybody within the MIT community.
CCTV这个logo在中国家喻户晓,就是中央电视台的英文简称(China Central Television)。上面的图案想必大家一定非常熟悉!可惜我在美国的房东没办法收到CCTV-4的节目,我好眼馋啊! 我房东的房子就在MIT附近,属于波士顿的Cambridge 市,说是市就像我们国内的区吧。没有办法只能看美国电视。一调台发现有CCTV9,我以为真的是啊。第二天问MIT的中国朋友,才知道这个CCTV不是国内的CCTV,它是Cambridge 市社区电视台的简称(CCTV=Cambridge Community Television )。有意思吧!下面是他们的主要区别: 中国的CCTV是China Central Television的简称 波士顿的CCTV是Cambridge Community Television 的简称 中央电视台的CCTV网站: www.cctv.com 波士顿的CCTV网站 : www.cctvcambridge.org 中央电视台的CCTV在电视的左上角 波士顿的CCTV标记在电视的右下脚 中央电视台的CCTV的主要频道 波士顿的CCTV有三个有线频道(9,10,22),这些节目既可以是媒体也可以是Cambridge居民提供。为什么取这3个数字不得而知。 Channel 9 features live and live-to-tape television shows produced by CCTV members. 主要是生活类节目 Channel 10 features programs on art, sports, politics, music, movies, and more. 主要包括艺术、体育、政治、音乐、电影 Channel 22 features religious and non-English programming in Spanish, Arabic, Amharic and more.宗教和非英语节目。 波士顿的CCTV电视节目形式多样
2009 年 1 月 5 日 晚 6 点 40 分左右,我赶往 13 教参加长江大学第四期出国人员英语培训的最后一课。那天刚刚下了雪,路很滑,走上东校区 13 教的一楼平台,发现一个人摔倒在 13 教 AB 区的教室管理科外的平台上,我关心的问了一句这是谁啊?躺在这儿?摔坏了没有?没有想到是一块参加出国英语培训的管理学院翁老师,翁文先老师自述背部疼痛难忍,无法自行站起,我扶起他后,联系到英语培训班有车的化工学院的陈老师,把翁老师搀扶到车上后,由陈老师把翁老师送往荆州市中心医院。 经 X 光检查后怀疑脊椎骨折,经 CT 检查确认胸 12 椎骨折,随后医生安排住院治疗。翁老师为了这最后一课做出的牺牲太大了。今天要我给他做工伤证明,我毫不犹豫的签字了。愿翁老师要快快好起来,你还要出国访问咧!这就是新东方精神! 新东方给我们的不仅仅是知识,更多的是激励和鞭策。那天荆州新东方学校的李校长也是顶住很大的心理压力给我们上的最后一课,我鼓励她上 Randy Pausch 的最后一课吧,这样何许能让她坚强起来!为纪念最后的一次英语培训课,特将那天我的发言贴在这里,祝翁老师早日养好伤,祝李茜老师不久在香港中文大学变得越来越智慧! 在荆州新东方英语学校 李茜校长 最后一次课上的发言 President Li , Ladies and Gentleman , Good evening ! I have a dream , I can speak English ! This is my first time to speech to you in English. If my English is somewhat awkwarded, please forgive me! hehe! Today is a special day. We must memory today! Jan 5 .Why? First small snow have been falled. A fall of seasonable snow gives promise of a fruitful year. This year is lucky year ,Chinese cow year. We wish we can become stronger and make much money! I wish! Today is a special day. This lecture is also teacher Li s last lecture. President Li have been teaching us, we are very lucky. President Li is the youngest President in new oriental. we are very lucky. President Li ,You are the most beautiful and the youngest President I have seen in my life. You are the most enthusiastic and the most passionate President I have seen in my life You are a first teacher have sent to our White Rose Actually you are the first teacher. My wife asked me who sent me White Rose several times. I told her it is an open secret Thank you ,teacher! we will always miss you. You are our best teacher ,like a friend. Thanking you for your teaching .we will try our best to make you feel impressed. Actually I am making speech to you not for special purpose, but to express our great gratitude towards you for what you have done for our English lecture! Prensent Li,we want to say you You are like winter While its snowing hard outside, Keeping students comfortable, As a warm and helpful guide We are happy that youre our teacher; We enjoy each lesson you teach As our role model you inspire us To dream and to work and to reach With your kindless you get my attention Every lecture you are planting a seed Of curiosity and motition To know and to succeed You help me fulfill my potential We are thankful for all that youve done We admire you each day, and we just want to say As a teacher, youre number one! What happened today in history. 毛泽东撰写《星星之火,可以燎原》 (1930 年 ) A single spark can start a prairie fire We wish new oriental Spirit will be Spread like single spark! Thank you ! Mao ningbo 2009-1-5 链接: 李茜的博客
毛宁波 2009年1月11于荆州新东方 主持人 Ms 贾, Belinda , michell , stu 各位领导、各位学员: Good afternoon !大家下午好!我是新东方的学员,还没有考试,也不知道及格不及格,中英文混杂发言吧! sorry ! 非常感谢高处长熊处长的厚爱,让一个不惑之人做了一次班长,感谢领导感谢老师们!我尽心尽力为大家做了一些力所能及的事情,如果大家觉得不满意, 2009 年我再重修一次,争取做的更好。我始终牢记李校长的话: Your altitude depends on your attitude, not your aptitude 。。 Belinda , classmates ,what about my attitude? 李校长、老师们我的态度好吗? I have given it my all! Thank you! Today is a special day. We must remenber today! 1868 年 1 月 11 日蔡元培先生出生,他 1917 年曾任北京大学校长。 Today must be somebody Wedding anniversary.who? my wife and I! Thank you Congratulations! 难怪定今天考试的,好自私是吧!李校长教我的假话全不说,真话不全说! Why do we want to study English? We cant standour poor English! Trainning is the welfare! Last year everybody said: Bejing olympics,one world one dream! I want to say today:Jingzhou new oriental ,one class one dream ! 我们从 2008 年学到了 2009 年,老师们感觉怎么样?不错是吧?用英语说一下: We are the greatest !我们是回锅肉,都用的五花肉做的,尽管不怎么好,加上佐料后蛮好吃,是不是 Belinda 、 michell and stu ? 俗话说千里之行始于足下, A thousand-li journey is started by taking the first step 。新东方的学习是我们迈出的第一步,同学们任重道远啊! I wish woman More beautiful ! I wish man More stronger ! I wish new oriental way will be spread like single spark! Thank you! Trainning is the welfare! 培训就是福利,再次感谢长江大学人事处,感谢荆州新东方学校! Thank Belinda 、 michell and stu ! That is all! Thank you again !
我有幸参加的长江大学出国师资培训班2009年1月11日就圆满落幕了。今天在网上遨游的时候,无意中看见了新东方网站上对我们培训班结业的报道。转载如下,以此纪念! http://www.neworiental.org/publish/portal0/tab410/info301596.htm (转自新东方网站) 2009年1月11日下午,荆州新东方学校的企业培训项目长江大学出国师资培训班圆满落幕。在荆州新东方总部503教室举行了盛大的结班毕业典礼,来自长江大学各院系推荐的70多名出国老师齐聚一堂,长江大学人事处领导也出席典礼现场。 典礼首先由年轻的新生代老师张澜作为教师代表发言。张澜老师引用冯小刚贺岁电影《天下无贼》里的台词二十一世纪什么最贵人才!,谦虚地说自己不是什么人才,但在新东方获得发挥自己才能的舞台,同时她表达了对讲台下70多名长江大学学术精英教师的敬佩,以及被他们学习英语的精神所感动。 刘砚群老师作为学员代表发言,刘老师代表学员感谢所有授课的老师,他说,感谢你们半年来的精心授课,在你们身上,我们不仅看到了新东方的精神,还了解到新东方的传奇与魅力,更有你们风味独具的个性风采。 接着,本期培训班班长毛宁波教授发言,毛老师的发言激情而幽默。他说,千里之行始于足下,A thousand-li journey is started by taking the first step,新东方的学习是我们迈出的第一步,同学们任重道远啊!毛班长还代表全体学员给荆州新东方赠送一块精心制作的牌匾,上书太阳从东方升起,我们在长大相聚。 荆州新东方学校李茜校长发言,李校长感慨地说,长江大学的教师培训班是我从教以来印象最深的一个班,这是一个三高班级:最高知所有学员都是长江大学的教授、副教授、博士们;最长时间3个月的课,甚至从08年跨度到09年;最深情谊这个班充满了师生之间很多感动的故事。 最后,长江大学人事处高副处长发表重要讲话,他充分肯定了荆州新东方的教学模式、教学质量以及敬业的态度,同时高副处长代表长大校方感谢荆州新东方学校为培训而付出的努力。 典礼结束后,荆州新东方长大企业培训项目的老师与长大的老师们一起合影留念。相聚是一种缘份,感动的故事成为美好的回忆,大家期待下一次的相聚。
 标签: 毛宁波


![[转载]5月7日第三批中国大学视频公开课上线](http://image.sciencenet.cn/album/201205/08/203321d0h66eok20e6yh37.jpg.thumb.jpg)


![【荐】荆州/武汉“三镇”到长江大学(蔡甸)乘车路线图[无车版]](http://image.sciencenet.cn/album/201204/10/065054qkhpjpqjh9njo8mq.png.thumb.jpg)

![[转载]中国南海油气资源被疯狂掠夺](http://image.sciencenet.cn/album/201204/03/122703iinl1f8mnlfw7ixx.jpg.thumb.jpg)


![[转载]三大油企7个海外项目齐获批](http://image.sciencenet.cn/album/201202/18/150408w938jjjndet3aqtu.gif.thumb.jpg)
![[转载]关于开展2012年度精品视频公开课推荐工作的通知](http://image.sciencenet.cn/album/201202/16/1215489003wtxtzzvjn093.jpg.thumb.jpg)

![[转载]中国亲戚关系图](http://image.sciencenet.cn/album/201202/01/130507o4wwmaxtmaxotxdw.jpg.thumb.jpg)

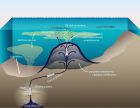


![[转载]中国2011年原油进口同比增6%](http://image.sciencenet.cn/album/201201/20/121722ipw0mus05uwip0of.jpg.thumb.jpg)


![[转载]国务院关于实施《国家中长期教育改革和发展规划纲要。。。](http://image.sciencenet.cn/album/201112/31/082823als0rlagi0iy0hb3.jpg.thumb.jpg)


![[转载]走近翟光明院士:找油六十年](http://image.sciencenet.cn/album/201112/20/135334l4blwcbibncgglbc.jpg.thumb.jpg)

![[转载]Shell strikes shale gas in China](http://image.sciencenet.cn/album/201112/10/1310276bv214ghoffahh14.jpg.thumb.jpg)


![[转载]生物大灭绝的时间轴](http://image.sciencenet.cn/album/201111/19/09392812qo2zlkdqc9erh9.jpg.thumb.jpg)
![[转载]武汉在校大学生人数全球城市排第一 已超百万](http://image.sciencenet.cn/album/201111/16/12533929znav9929aa4qca.jpg.thumb.jpg)
![[毛宁波]国家精品课程阶段成果汇报PPT](http://image.sciencenet.cn/album/201111/10/195125bj392brghrgbrmbb.jpg.thumb.jpg)

![[转载]东方地球物理公司科学发展纪实](http://image.sciencenet.cn/album/201111/07/073839ajubhzuo6bmxmcj1.jpg.thumb.jpg)
![[转载]东方物探浅海过渡带地震勘探技术发展纪实](http://image.sciencenet.cn/album/201111/04/084000wza3z83wvzqm80az.jpg.thumb.jpg)

![[转载]儿子酷爱篮球不爱学习 黄石母亲用望远镜"监视"](http://image.sciencenet.cn/album/201110/28/090005u9uso9ozhummnniu.jpg.thumb.jpg)
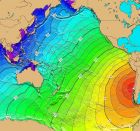
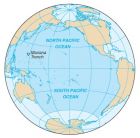


![[转载]Where the wind blows?](http://image.sciencenet.cn/album/201110/26/072034ext6lzffzqu1uctt.jpg.thumb.jpg)


![[转载]高水平大学聚焦本科教学改革](http://image.sciencenet.cn/album/201110/23/204059xmu2h0yfto909tw9.jpg.thumb.jpg)


![[转载]南京大学萧耐园教授不顾选修课学生少坚持授课](http://image.sciencenet.cn/album/201110/21/102145qmypb4k4uupq0qlb.jpg.thumb.jpg)


![[毛宁波]海洋地球物理----石油的生成与富集](http://image.sciencenet.cn/album/201110/11/174727zx33tuq3o2203o80.jpg.thumb.jpg)

![[毛宁波]海洋地球物理----大陆的演化](http://image.sciencenet.cn/album/201110/07/204330rrayrrkjy56f54j5.jpg.thumb.jpg)
![[毛宁波]海洋地球物理---地质年代](http://image.sciencenet.cn/album/201110/07/201518u7dscwmm3sqsbs3w.jpg.thumb.jpg)
![[毛宁波]海洋地球物理---岩石的变形](http://image.sciencenet.cn/album/201110/07/194258nis1gy5gw5isuwtd.jpg.thumb.jpg)
![[毛宁波]海洋地球物理---变质岩](http://image.sciencenet.cn/album/201110/07/16591590n88mozbb83ekiw.jpg.thumb.jpg)
![[毛宁波]海洋地球物理---沉积岩](http://image.sciencenet.cn/album/201110/07/163133va8ttmgjmocanapc.jpg.thumb.jpg)
![[毛宁波]海洋地球物理---火成岩](http://image.sciencenet.cn/album/201110/07/1410183aqalb20aal0q688.jpg.thumb.jpg)

![[毛宁波]海洋地球物理---矿物与岩石](http://image.sciencenet.cn/album/201110/06/1417560ckp8y8nckpi08nk.jpg.thumb.jpg)
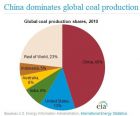


![[毛宁波]海洋地球物理---板块构造](http://image.sciencenet.cn/album/201109/28/133318m3nmyz63id9zyx9f.jpg.thumb.jpg)
![[毛宁波]海洋地球物理---地球系统](http://image.sciencenet.cn/album/201109/27/162418asmzs9tkzkt2mdrg.jpg.thumb.jpg)
![[毛宁波]海洋地球物理课件汇编](http://image.sciencenet.cn/album/201109/27/152527wkwrzpaf6dawfwwl.jpg.thumb.jpg)


![[转载]胡锦涛:希望广大教师扎实做好教书育人工作](http://image.sciencenet.cn/album/201109/11/151905z8v9sk9m2tqizj58.jpg.thumb.jpg)
![[转载]"海洋石油720"完成首个地震采集作业](http://image.sciencenet.cn/album/201109/11/112842rfroro173ccro3c9.jpg.thumb.jpg)


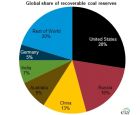
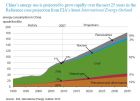


![[转载]水平井技术促进了页岩气产量提高](http://image.sciencenet.cn/album/201107/13/064245d5yyd3j9je399nms.png.thumb.jpg)


![[转载]国际能源机构成员国释放战略石油储备](http://image.sciencenet.cn/album/201106/25/115857k5c8t9uj9wr1nxun.jpg.thumb.jpg)


![[转载]中国首例水平井和定向井连通成功](http://image.sciencenet.cn/album/201106/05/113803j2cklwjwwwks2ddl.jpg.thumb.jpg)
![[转载]MIT校长在MIT第145届研究生毕业典礼上的讲话](http://image.sciencenet.cn/album/201106/05/110624ytc923sb9cggvyk4.jpg.thumb.jpg)
![[转载]我国深海海底甲烷原位探测技术取得成功](http://image.sciencenet.cn/album/201106/03/150614oddtvoe515dw3675.jpg.thumb.jpg)


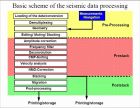


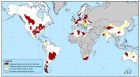


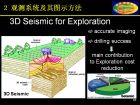


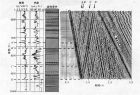


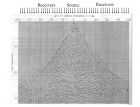

![[毛宁波]海洋地球物理---绪论](http://image.sciencenet.cn/album/201109/27/154646w0w7wf6zl67az7ww.jpg.thumb.jpg)