\0 中国生态文明建设(中英对照)连载之三十一 国家林业局 本书由北京语言大学出版社出版,2014(教学课件光盘版) 作者 蒋高明 4.1.2 国家林业局 4.1.2 State Forestry Administration 在当下生态环境建设方面,国家林业局的主要职责是研究、拟定森林生态环境建设、森林资源保护和国土绿化的方针、政策,组织起草有关的法律法规并监督实施。 In terms of ecological environment construction, its major tasks are to study and formulate some principles and policies for forest ecological environment construction, forest resource protection and land greening as well as to organize the drafting of relevant laws and regulations and to supervise their implementation. 森林是陆地生态系统的主体。森林高大,光合产物常年富集在木材和地下根系中,森林复杂的生态还为多种野生动物提供了生存场所与食物。人类是从森林里走出来的,但长期以来,人们只知道向森林索取,造成了森林生态急剧恶化。因此,恢复森林生态,改善森林环境,保护森林资源,绿化陆地国土,是当前国家林业局的首要任务。植树造林、封山育林、植灌种草、防沙治沙、防治荒漠化、管理国有林场、指导建设森林公园、监督林木与竹林采伐等,是国家林业局负责的具体森林保护与经营工作。 The forest is the main body of the terrestrial ecosystem. Because of the height of the forest, photosynthetic products are accumulated in timber and underground roots. The complex ecology of the forest also provides shelter and food for a variety of fauna. The forest is the original living place for humans, but now the excessive demands of humans have caused sharp deterioration in the forest ecology. Therefore, it is the primary task of the State Forestry Administration to restore the forest ecosystem, to improve the forest environment, to protect forest resources, and to turn the land green. Forestation, sealing off mountainous areas to protect forests, planting shrubs and grass, prevention and control of desertification, management of state-owned forest, directing forest park construction, supervision of deforestation, are the specific tasks of the Administration for forest protection and operation. 以 2011 年为例,林业局印发了《全国造林绿化规划纲要》,在当年计划的指导下,全国完成荒山荒地造林 599.66 万公顷,其中,人工造林 406.6 万公顷,飞播造林 19.7 万公顷,无林地和疏林地新封山育林 173.4 万公顷。在人工造林中,还有一部分属于公众义务植树。 2011 年是开展全民义务植树 30 周年,在林业局和各界共同努力下,全年共有 6.14 亿人次参加义务植树,植树 25.14 亿株。而封山育林完成的 173.4 万公顷,就是我们前面讲的通过自然恢复生态治理所取得的成效。 In 2011, for example, the Administration issued the National Program for Forestation . Under the guidance of the year’s plan, the country accomplished forestation of barren hills and wastelands of 5.9966 million hectares, of which 4.066 million hectares involved artificial forestation, 197,000 hectares aerial forestation, and 1.734 million hectares forestation of non-forest lands and sparse woodlots. In areas of artificial forestation, some public voluntary service was enlisted. The year of 2011 was the 30 th anniversary of the launch of the nationwide voluntary tree planting program. With joint efforts of the State Forestry Administration and people from all sectors, a total of 614 million people planted 2.514 billion trees. A total of 1.734 million hectares of forestation of non-forest lands and sparse woodlots resulted from the aforementioned natural restoration. 此外,陆地野生动植物资源的保护和开发利用,包括相关的濒危物种进出口,国家保护的野生动植物及其产品出口的审批,以及有关国际公约的履约工作,也是由国家林业局负责的。除了以林木为主的生物资源外,国家林业局还负责湿地类型自然保护区的建设和管理。 2011 年,林业局开展了近 20 种野生动物的栖息地恢复试点项目,实施了近 30 种珍稀濒危野生动物的繁育项目;新增国际重要湿地 4 处,新建国家湿地公园(试点) 68 处。通过加强自然保护区建设和管理,中国的濒危野生动物,如大熊猫、朱鹮、金丝猴、长臂猿、兰科植物等 30 多种种群保持了稳定,并有所上升。 What’s more, the Administration is also responsible for protection and development of wild animals and plants, including import and export of endangered species, approval of the export of state-protected wild animals and plants and their products, and implementation work of relevant international conventions. Besides forest-based bio-resources, the Administration is also responsible for the construction and management of wetland nature reserves. In 2011, the Administration conducted habitat restoration pilot projects for nearly 20 kinds of wildlife and breeding projects for nearly 30 kinds of rare and endangered wildlife; and built 4 new Ramsar wetland sites and 68 national wetland parks (pilot). By strengthening the construction and management of nature reserves, 30 species of endangered wildlife, such as the giant panda, crested ibis, golden monkeys, gibbons, and orchid plants, etc., have maintained a stable population and some even increased in number. \0
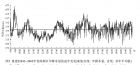
气候变化?树木全知道 副标题:降雨季节变化对树木生理的影响取得研究进展 博主按: 业已不少气候变化影响下的全球尺度模型研究,但气候变化对自然生态系统的试验研究并不多。基于此,我们在一典型的南亚热带常绿阔叶林开展了两年的降水格局改变试验。起初我们预测森林或树木的生长或生理指标有较大的变化,但最终的数据告诉我们几乎所有的指标变化幅度都不大。我们试验期(2012-2014)降雨量高于历年平均水平( ca. 1500 mm),其中一个试验年高达2000多mm(高出500 mm)的降雨量,估计能在很大程度上缓解试验干旱或处理造成的影响。我们认为森林或树木的应变力还是很强的,特别是在水资源相对充裕的南亚热带华南地区,未来的极端降雨(特指本研究的降雨情形)影响可能不是很大。我们的这个研究估计会对从事全球变化生态学、植物生理生态学和生态系统生态学的同行有一定的启发。 论文故事: 想必大家对近期的暴雨天气印象十分深刻了,如果近期的强降雨还不足以让你印象深刻,那么回想一下近几年的雷暴天气是不是也会心有余悸:北京暴雨(2012年)、四川暴雨(2013年)、广州暴雨(2014年)、上海暴雨(2015年)、武汉暴雨(2016年)、湖南暴雨(2017年)….据说,这样的天气估计以后不会太少。极端降雨天气使人们经受了物质和精神上的巨大损失,同时也考验着自然生态系统的抵抗力(Resistance)和应变力(Resilience)。降雨在空间上的极端化和时间上的不均衡已经成为一个客观事实,而为我们提供巨大生态系统系统服务功能的森林也无时不在受到降雨极端化的负面影响,这些影响包括某一时段降雨稀缺和过多对树木生长活动的直接限制、以及由于降雨格局改变造成的级联效应,如干旱、病虫害爆发、土壤养分流失等对树木生长的间接限制。 然而,到目前为止,受限于观测数据,人们依然不清楚降雨格局改变对森林或树木生长到底有什么样的影响?有多大的影响?以及,这种影响的可能后果是什么?我们处在一个多变的世界,对这些迫切需要回答的科学问题之答案,我们所知甚少。 现在有一点可以肯定的是,全球环流模型(Global circulation models)和经验观测数据均表明降雨格局在未来将变得更加不均匀,如在世界很多地区呈现“干季更干、湿季更湿”的特点,这种变化势必对森林生态系统的结构和功能产生重要影响或改变。如,我们对南亚热带的一个长期观测站点 — 广东鹤山30年(1985–2014)降雨数据的分析后发现,降雨确实呈现出干季减少的趋势,且在干季的末期这种逐年递减的趋势尤甚。然而,受限于后勤,到目前为止却很少开展降雨格局改变下森林生态系统的观测研究。 为了获得更好地机理性认识,中国科学院华南植物园的科学家在一南亚热带的常绿阔叶次生林(中科院广东鹤山站)开展了为期两年的“降雨季节分配改变( Precipitation Seasonal Distribution Changes ,PSDC)”试验。试验包括“干季更干、湿季更湿(DD)”、“干季更干、延长干季(ED)”和空白对照(AC)三种处理,其中DD是隔除干季(10-3月份)的穿透水模拟干旱,而ED则是在春季(4-5月份)隔除穿透水模拟春旱,在湿季加回大致等量的水分到同样的样方,以此达到模拟降雨季节分配极端化的目的( 试验设计见 图1 ) 。研究人员对两个共存树种火力楠( Michelia macclurei Dandy ) 和木荷( Castanopsis fissa (Champ. ex Benth.) Rehd. E. H. Wils. ) 的树木蒸腾、水分利用效率和叶片和木材养分含量以及形态参数进行了量化,以期解析响应降雨季节格局改变的生理学响应机制( 样地照片浏览详见: http://blog.sciencenet.cn/blog-260340-871311.html ) 。 结果显示,两共存树种的整树单位边材面积的蒸腾量(Sap flux, J s )和内在水分利用效率( WUE i )对降雨处理表现出一定的生理稳态现象,树木蒸腾对蒸汽压亏缺(VPD)和光合有效辐射(PAR)的响应参数无论在干旱、春旱还是灌溉期均无明显的处理差异。与此相反的是,单位面积的叶片氮(N)、磷(P)含量呈现一定的波动,特别是叶片N : P有处理效应,说明在氮- 和磷-双重限制的森林生态系统,降雨季节分配改变对养分的吸收利用产生了不利影响,从而可能影响到森林生态系统的生物地球化学循环过程。木材的化学计量特征相比于叶片呈现更大的保守型。在给定的叶片 13 C甄别率(≈ c i / c a ,胞间二氧化碳与大气二氧化碳比值),木材 13 C甄别率没有表现出处理或树种方面的差异,说明树木自身的碳转移没有受到极端降雨的影响,部分解释了与“碳经济”相关的保守的化学计量特征。枝条边材面积 : 叶片面积(A s : A l )与树木蒸腾对VPD的敏感性参数显著负相关,说明树木能够通过形态上的调整结合气孔控制达到水分利用的稳态性响应,从而保持最大的水分利用。我们的研究结果表明,在湿生环境中,两共存树种在养分获取( 图2 ) 、光资源利用( 图3 ) 和水分提升( 图4 ) 方面的稳态性反应和应变力与“生态水文平衡假说”(Ecohydrological equilibrium theory)相一致。近期,高建国博士(本博主)等的研究论文“ Physiological homeostasis and morphological plasticity of two trees pecies subjected to precipitation seasonal distribution changes ”已经以长文形式发表在植物学期刊 Perspectives in Plant Ecology, Evolution and Systematics (25: 1–19, 2017) 上( DOI : 10.1016/j.ppees.2017.01.002 ) 。两位同行专家对我们的研究均给予了非常正面的评价,其中 Reviewer #2 认为: “Overall, the whole paper is well-written, and the conclusions are solid based on large amount of data.” 那么,大家能从我们的研究得出什么有启发的结论呢?广东鹤山站的研究样地,主要生长着两个优势种,降雨季节改变对它们的影响迥然不同。基于我们的长期观察和思考,以及本试验研究,我们认为火力楠在湿生或轻度水分胁迫下有更强的生长优势;木荷由于对地下水较多的利用以及更强的形态可塑性对未来降雨分配不均或干旱加剧的情形,如DD、ED 处理更有竞争优势。在华东和华南地区,有不少地区营生着较为广泛的火力楠-木荷混交林,这样的次生林一方面作为本土经济林(Native economic forest);一方面也作为防火林带(Fire-prevention forest belt)。由于我们研究的是典型的、受到人为干扰的次生林,其研究背景(如土壤类型、降雨特征)与大部分亚热带次生林没有本质区别,因此该研究结论或可推及到极端降雨季节格局改变下的亚热带地区其它类似森林生态系统类型。 回到我们之前的话题,这个研究与我们的生活和工作有什(扯)么(的)关(远)系(些)呢?或许我们可以这样理解本研究的价值:降雨格局的改变影响了森林的生态系统服务功能,如减少径流和防洪等,但如果没有具体的观测试验,我们根本无法量化未来降雨季节格局改变对森林影响的时间、方向和幅度,因此也就无从谈起对森林生态系统的管理和优化、以及防灾减灾。我们通过两年的长期试验给该科学问题提供了一个观察视角,但降雨格局改变对森林或树木生长方方面面的影响还很多,这显然需要进一步的研究了。 引用格式: Gao JG , Zhao P, Shen WJ, Rao XQ, Hu YT. Physiological homeostasis and morphological plasticity of two tree species subjected to precipitation seasonal distribution changes. Perspectives in Plant Ecology, Evolution and Systematics , 2017, 25: 1–19. 图注: 图1 . 本研究的试验设计. Photo credit: Liu Dan (版权保留). 图2 . 不同降雨季节改变情形下火力楠和木荷叶片水平化学计量特征。其中,一般线性模型表明叶片N : P具有明显的处理效应。由于N和P对树木生长的影响很大,因此,降雨季节情形改变的这种影响势必对森林的功能(如,初级生产力)产生影响。 图3. 不同降雨季节改变情形下火力楠和木荷树木蒸腾对光合有效辐射(PAR)的响应,处理和种间差异不是很明显,但由于二者冠层位置分层明显(图1),它们对光照的响应在未来可能会加剧分化。 图4. 不同降雨季节改变情形下火力楠和木荷水分利用策略。二者水分利用比例存在一定的重合(示红色圆圈),说明即使在不缺水的南亚热带地区,二者对水分依然存在一定的竞争;由于木荷的深根性,因此有相对较大的地下水利用比例,这对于处在干旱期的树木生长是一种竞争优势。 相关报道: 大型生态学控制实验---- 降雨季节格局改变平台简介 华南植物园在南亚热带地区降水变化对土壤微生物的影响研究获进展 树木能“ 喝” 多少水受自身因素限制
Coral reefs scatter light like forests 珊瑚礁具有森林一 样 的反射光作用 By Devin Powell Mar. 1, 2016 , 12:00 PM 珊瑚礁和森林的相似之 处 ,可能比你 预 想的要多 。当阳光照到一片 树 林,阳光 在空 间 的 分 布并不均匀。得到阳光多的 树 叶内的 组织, 会向外散射阳光 ,与 别 的 树 叶分享阳光。海洋学家在 2月下旬召开的AGU海洋年会 上,介绍了 珊瑚的 这 一功能。 虽 然浮潜 时 ,你不一定注意到身体下面的 珊瑚“森林”,因 为 它 们 不像 陆 地上的森林那么明 显(地遮阴) 。但是, 这 些研究人 员认为 , 珊瑚的 这 一 反射光 功能 对 研究海底生物非常重要。 A coral reef has more in common with a forest than you mightthink. When sunlight strikes a group of trees, some parts tend to get more sunthan others. Leaf tissue somewhat compensates for this by scattering lightoutward, helping to illuminate other leaves. A similar thing happens withcoral, researchers reported at the American Geophysical Union’s OceanSciences meeting in New Orleans, Louisiana. When scientists shone a laser at acoral, the coral’s colorful tissue spread the light, generally redistributingit to other parts. Coral’s white calcium carbonate skeleton also gets in on theaction. But it tends to spread light less, helping instead to focus it onspecific areas that would otherwise be in the shade. Coral can also rearrangethemselves depending on the circumstances, expanding to increase the spread oflight or contracting to minimize it. Yet even with all of these tricks, lightcan only penetrate so far into coral tissue; it tends to drop off the deeperyou go, as in forests, making getting by more difficult for cells at the bottomof tissue. So just as different cells in a leaf contain different amounts ofchlorophyll, coral cells seem to house different amounts of the photosyntheticalgae that makes their food, Symbiodinium .Cells specialized for low light to still make decent amounts of food in dimconditions, as measurements of photosynthesis (pictured here http://www.sciencemag.org/news/2016/03/coral-reefs-scatter-light-forests ), showed. Snorkelersvisiting coral may not notice the canopy below, a much smaller and subtleraffair than the lofty bowers of forests on land. But the researchers argue thatunderstanding it is crucial for understanding how life gets by on the seafloor.
1. Lyu, L., Zhang, Q. B., Deng,X., Mäkinen, H. (2016). Fine-scale distribution of treeline trees and thenurse plant facilitation on the eastern Tibetan Plateau. EcologicalIndicators, 66,251-258. Above-average climate warming occurredduring the 20th century in high altitude regions, and alpine treelines arebelieved to be an early indicator to respond to these warming-related changes.However, empirical investigations on treeline dynamics showed diverse results.The main objectives of this study are: (1) to investigate if treeline positionshifted and if tree recruitment changed along with climate warming, and (2) totest if adult trees have “nursing effect” on tree establishment at treelines.We investigated two Balfour spruce (Picea balfouriana Rehd. et Wils.) treelinesin Chang Niang (CNT) and Dang Dui (DDT), Dingqing county, Changdu prefecture,eastern Tibet. At each treeline site, three replicate plots with a size 30 m ×50 m were established. The coordinates of each tree within the plots wererecorded and the age of each tree was identified by dendrochronological method.The changes in treeline position and tree recruitment were examined fromspatially fine-scale distribution of trees and their age structure. The spatialpatterns of individual trees were analyzed to infer the neighborhood effects.Results indicate that plots CNT2, CNT3, DDT1 and DDT2 showed stable treelineposition during the last century, whereas plots CNT1 and DDT3 showed treelineadvancing movement. Tree recruitments in all the six plots were enhanced duringthe 20th century, with two peaks occurring in the 1890–1910s and the1950–1990s. Seedlings and saplings showed a general clustered distribution inall the six plots. The diverse pattern of treeline movement and episodicregeneration suggest that the treeline activity is not merely a result ofclimate change. “Nursing effects” from adult trees may play an important rolein shaping the treeline activities on the eastern Tibetan Plateau. Our findingsreveal diverse patterns in treeline dynamics at a local scale and highlight theimportance of incorporating biotic interactions into species distributionmodeling approaches. http://www.sciencedirect.com/science/article/pii/S1470160X16000558 2. Mina, M., Martin-Benito, D.,Bugmann, H., Cailleret, M. (2016). Forward modeling of tree-ring widthimproves simulation of forest growth responses to drought. Agriculturaland Forest Meteorology, 221, 13-33. Drought is a key factor affecting forestecosystem processes at different spatio-temporal scales. For accuratelymodeling tree functioning – and thus for producing reliable simulations offorest dynamics – the consideration of the variability in the timing and extentof drought effects on tree growth is essential, particularly in stronglyseasonal climates such as in the Mediterranean area. Yet, most dynamicvegetation models (DVMs) do not include this intra-annual variability ofdrought effects on tree growth. We present a novel approach for linkingtree-ring data to drought simulations in DVMs. A modified forward model oftree-ring width (VS-Lite) was used to estimate seasonal- and site-specificgrowth responses to drought of Scots pine (Pinus sylvestris L.), which were subsequentlyimplemented in the DVM ForClim. Ring-width data from sixteen sites along amoisture gradient from Central Spain to the Swiss Alps, including the dry innerAlpine valleys, were used to calibrate the forward ring-width model, andinventory data from managed Scots pine stands were used to evaluate ForClimperformance. The modified VS-Lite accurately estimated the year-to-yearvariability in ring-width indices and produced realistic intra-annual growthresponses to soil drought, showing a stronger relationship between growth anddrought in spring than in the other seasons and thus capturing the strategy ofScots pine to cope with drought. The ForClim version including seasonalvariability in growth responses to drought showed improved predictions of standbasal area and stem number, indicating the need to consider intra-annualdifferences in climate–growth relationships in DVMs when simulating forestdynamics. Forward modeling of ring-width growth may be a powerful tool tocalibrate growth functions in DVMs that aim to simulate forest properties inacross multiple environments at large spatial scales. http://www.sciencedirect.com/science/article/pii/S0168192316301605 3. Nock, C. A., Metcalfe, D. J., Hietz, P. (2016). Examining the influences of site conditions anddisturbance on rainforest structure through tree ring analyses in twoAraucariaceae species. Forest Ecology and Management,366,65-72. Tree growth is central to the dynamics offorest ecosystems. Patterns in tree diameter growth from tree rings can yieldan understanding of the growth trajectories of trees and how they vary withsite conditions but detailed studies have been conducted on relatively few speciesin tropical forests. Furthermore, tree rings provide information on temporalpatterns of tree establishment and thus the influences of disturbance andabiotic conditions on forest structure. Here, we confirm the annularity ofgrowth rings in Agathis robusta and Araucaria cunninghamii from NorthQueensland, Australia. We then examine tree growth trajectories in twocontrasting natural forests (Downfall Creek and Gillies Range) and aplantation. Growth in plantation over 70 years was high and growth trajectorieswere similar among trees within each species. In natural forests age anddiameter were only weakly correlated for both species. Growth trajectories weresimilar and homogeneous for both Agathis and Araucaria in the plantation,whereas there was a great deal of variation in tree ages and growthtrajectories observed for the two forest sites. These differences are likelyrelated to dynamics driven by climate and soil that modulate boundaries betweensclerophyll and rainforest over the long-term. Downfall Creek (a ridge withpoor shallow soils) is likely recently invaded (past couple of hundred years)sclerophyll woodland. The alternative hypothesis—that structural andcompositional characteristics result from local disturbance resulting fromWorld War II training activities—was not strongly supported by Agathisestablishment dates. The study of tree rings in tropical trees isunderappreciated and can provide valuable information on the influences on treegrowth and disturbance in tropical forests. http://www.sciencedirect.com/science/article/pii/S0378112716300196 4. Gao, C., Ludlow, F., Amir, O., Kostick, C. (2016). Reconciling multiple ice-core volcanic histories: Thepotential of tree-ring and documentary evidence, 670–730 CE. QuaternaryInternational. Chronologically-secure volcanic eventhistories are important for improving our understanding of volcano-climateresponses, and securing ice core chronologies. We present an exploratorycase-study that attempts to reconcile the chemical fingerprints of majorvolcanism in Greenland ice-cores for the years 670–730 CE. This periodexperienced considerable volcanic perturbation with multiple volcanic signalsregistered in all 8 Greenland ice-core datasets studied, including somecomparable in magnitude to the great 1815 Tambora eruption, but reconcilingsignals with divergent dating between datasets presents a number of challenges.To further our understanding of the volcanic history of this period,frost-rings, tree-ring growth width and density minima from Europe, Siberia andChina are considered together with Western European, Near Eastern and Chinesedocumentary evidence. These reveal a striking sequence of co-occurringinter-regional climatic extremes and social crises. We further examine a recentlyproposed 7-year adjustment to the GICC05 chronology used by many Greenland icecores, and find that this results in a more coherent volcanic history for theseyears, and an improved agreement with tree-ring and written records. Threemajor volcanic events can now be identified, dated to 681, 684–686 and 706–707,with several moderate events further contributing to a sustained climateperturbation reflected in prolonged temperature reductions in high-resolutionreconstructions. http://www.sciencedirect.com/science/article/pii/S1040618215013464 5. Cook, B. I., Anchukaitis, K.J., Touchan, R., Meko, D. M., Cook, E. R. (2016). Spatiotemporal droughtvariability in the Mediterranean over the last 900 years. Journal ofGeophysical Research: Atmospheres. Recent Mediterranean droughts havehighlighted concerns that climate change may be contributing to observed dryingtrends, but natural climate variability in the region is still poorlyunderstood. We analyze 900 years (1100–2012) of Mediterranean droughtvariability in the Old World Drought Atlas (OWDA), a spatiotemporal tree-ringreconstruction of the June-July-August self calibrating Palmer Drought SeverityIndex. In the Mediterranean, the OWDA is highly correlated with springprecipitation (April–June), the North Atlantic Oscillation (January–April), theScandinavian Pattern (January–March), and the East Atlantic Pattern(April–June). Drought variability displays significant east-west coherenceacross the basin on multi-decadal to centennial time scales and north-southanti-phasing in the eastern Mediterranean, with a tendency for wet anomalies inthe Black Sea region (e.g., Greece, Anatolia, the Balkans, etc) when coastalLibya, the southern Levant, and the Middle East are dry, possibly related tothe North Atlantic Oscillation. Recent droughts are centered in the WesternMediterranean, Greece, and the Levant. Events of similar magnitude in theWestern Mediterranean and Greece occur in the OWDA, but the recent 15-yeardrought in the Levant (1998–2012) is the driest in the record. Estimatinguncertainties using a resampling approach, we conclude there is an 89%likelihood this drought is drier than any comparable period of the last 900years and a 98% likelihood it is drier than the last 500 years. These resultsconfirm the exceptional nature of this drought relative to natural variabilityin recent centuries, consistent with studies that have found evidence foranthropogenically forced drying in the region. http://onlinelibrary.wiley.com/doi/10.1002/2015JD023929/full 6. Copenhaver-Parry, P. E., Cannon, E. (2016). The relative influences of climate and competition on treegrowth along montane ecotones in the Rocky Mountains. Oecologia, 1-13. Distribution shifts of tree species arelikely to be highly dependent upon population performance at distributionedges. Understanding the drivers of aspects of performance, such as growth, atdistribution edges is thus crucial to accurately predicting responses of treespecies to climate change. Here, we use a Bayesian model and sensitivityanalysis to partition the effects of climate and crowding, as a metric of competition,on radial growth of three dominant conifer species along montane ecotones inthe Rocky Mountains. These ecotones represent upper and lower distributionedges of two species, and span the distribution interior of the third species.Our results indicate a greater influence of climate (i.e., temperature andprecipitation) than crowding on radial growth. Competition importance appearsto increase towards regions of more favorable growing conditions, and preciseresponses to crowding and climate vary across species. Overall, our resultssuggest that climate will likely be the most important determinant of changesin tree growth at distribution edges of these montane conifers in the future. http://link.springer.com/article/10.1007/s00442-016-3565-x 7. Sargeant, C. I., Singer,M. B. (2016). Sub ‐ annual variability in historical water source use by Mediterraneanriparian trees. Ecohydrology. The seasonal availability of water within atree's rooting zone may be an important determinant for individual tree growthand overall forest health, particularly in riparian corridors of Mediterraneanclimate zones that are vulnerable to water stress. Here, we present a newmethod that combines dendro-isotopes and isotope modelling for determining howwater source use varies over 10 consecutive growing seasons (2000-2010) forco-occurring species Populus nigra and Fraxinus excelsior, along the RhôneRiver, south-eastern France. We conducted highly resolved δ18O analysis ofcellulose micro-slices within tree rings and back-calculated the δ18O signatureof source water available at the time of growth using a biochemicalfractionation model. We related these patterns to inferred seasonalhydrological partitioning through comparison with δ18O of waters from thevadose and phreatic zones, precipitation, and streamflow. The shallowly rootedFraxinus displayed greater sub-annual source water variability, as well asgreater isotopic enrichment, reflecting use of precipitation-derived vadosemoisture. Its earlywood was formed mainly from winter rainfall (δ18O depleted)whilst the latewood was composed from growing season precipitation (δ18Oenriched). In Populus, the sub-annual source water use was relatively depleted,suggesting use of hyporheic water and regional groundwater. From 2007, bothspecies converged in their pattern of water source uptake which was attributedto a decline in phreatic water access for Populus. These results demonstratethat the seasonal variability in source water use can be identifiedretrospectively, a method which may prove important for anticipating the futureconsequences of climate-driven changes to the hydrological cycle. http://onlinelibrary.wiley.com/doi/10.1002/eco.1730/full 8. Brenner, L. D., Linsley, B. K.,Dunbar, R. B., Wellington, G. (2016). Coral δ 18 O evidence for PacificOcean mediated decadal variability in Panamanian ITCZ rainfall back to theearly 1700s. Palaeogeography, Palaeoclimatology, Palaeoecology. In Central America, seasonal andinterannual shifts in the position of the Intertropical Convergence Zone (ITCZ)control the hydrologic budget. To better understand long-term changes inregional ITCZ-driven precipitation we re-examined a coral δ18O record from aPorites lobata coral head near Secas Island (Core ID: S1) (7 ° 59 ′ N, 82 ° 3 ′ W) in theGulf of Chiriqu í on the Pacific side of Panam á . Linsley et al.,(1994) originally published the 277-year time series and first described thepresence of a narrow-band decadal cycle (period near 9–12 years) in δ18O. Theoriginal study did not present potential drivers for the decadal cycle,although they ruled out the influence of the sun spot cycle. Our re-analysis ofthis record supports the original interpretation that coral δ18O is largelyresponding to variations in precipitation and associated river discharge, butwith a new proposed mechanism to explain the decadal mode. There is no similardecadal cycle in gridded instrumental sea surface temperature from the area,suggesting that the decadal coral δ18O signal results from hydrologic changesthat influence coastal δ18Oseawater. The decadal component in S1 δ18O is alsocoherent with a decadal mode embedded in the Pacific Decadal Oscillation (PDO)Index that we suggest has tropical origins. We speculate that the coral'stemporary δ18O deviation (1900–1930) in the decadal mode from the correspondingbands in rainfall and the PDO can be ascribed to a weak PDO in addition tolocal Panama gap wind variability and its effect on moisture transport from theAtlantic to the Pacific. Ultimately, the Secas Island coral δ18O series recordsITCZ-driven precipitation dictated by both the Atlantic and Pacific basins. http://www.sciencedirect.com/science/article/pii/S0031018216000663 9. Chikamoto, M. O., Timmermann,A., Yoshimori, M., Lehner, F., Laurian, A., Abe-Ouchi, A., Cobb, K. M.(2016). Intensification of tropical Pacific biological productivity due tovolcanic eruptions. Geophys. Res. Lett, 43. Major volcanic eruptions generatewidespread ocean cooling, which reduces upper ocean stratification. This effecthas the potential to increase nutrient delivery into the euphotic zone andboost biological productivity. Using externally forced last millenniumsimulations of three climate/Earth System models (Model for InterdisciplinaryResearch On Climate (MIROC), Community Earth System Model (CESM), andLOch-Vecode-Ecbilt-CLio-agIsm Model (LOVECLIM)), we test the hypothesis thatlarge volcanic eruptions intensify nutrient-driven export production. It isfound that strong volcanic radiative forcing enhances the likelihood of easternPacific El Niño-like warming in CESM and LOVECLIM. This leads to an initialreduction of nutrients and export production in the eastern equatorial Pacific.However, this initial response reverses after about 3 years in association withLa Niña cooling. The resulting delayed enhancement of biological productionresembles the multiyear response in MIROC. The model simulations show thatvolcanic impacts on tropical Pacific dynamics and biogeochemistry persist forseveral years, thus providing a new source for potential multiyear ecosystempredictability. http://onlinelibrary.wiley.com/doi/10.1002/2015GL067359/full
写这个东西是我开此博客的动机,也是我第一次用中文阐述关于自己研究的东西。写得不好请各位包涵! (关于这个名字的中文翻译,我一向觉得非常的别扭,所以在博文中我继续使用其英文名称) 当然,对于英语比汉语更顺畅的同学,直接跳过此文,去读 Antonio Criminisi 的tutorial以及相应的ppt【1】,我在phd定题的阶段,一次偶然的机会听了他的一个讲座然后进行了简短的探讨,随后决定了自己phd的topic就一定要将这个东西用一用,结果一做不可收拾,做了一年多。Random Forests的起源很早,之前也有了很多的应用,这里只讨论近几年的发展。或者说,在J. Gall 的 Hough Forests 提出之后。 简单的回顾一下,Random Forests, 就是很多的Random Tree的Ensemble. 一棵不行,用多棵来平均一下,就这么简单的思想。至于为什么要采用平均的这种Ensemble方法,那说起来就麻烦了,总之呢,就是一堆人搞来搞去搞了半天,各种证明与推导,最后就订下来,这么一个平均的方法,不错!一棵简单的决策树干什么呢,就是将问题细化。说起来太抽象,举个例子: 现在有这个一张图片,你想知道其在室内还是室外拍摄的,专业一点可能叫场景分类吧,你先看看图像的上方是不是蓝色的,如果是,图像到了第二层的节点,再判断一下,底部是不是蓝色,不是,那么属于outdoor的可能性或者label就给出来了。是不是很简单?你是否有一下疑问:做这两个判断就足够了吗?我怎么知道要作什么判断?如果你思考了这么两个问题,那么证明你是一个具有machine learning基础的人。所以继续读下去是有意义的。 一棵树的结果就是这么简单,每个节点只有两个树丫子,直到顶端。节点就分为两类,一类叫Internal node,另一类叫Leaf node。当树已经有了的情况下,用于测试的数据就是一个笨蛋,想知道自己是谁,然后跑来问树,从树根往上爬,走到每个 internal node 内部节点,负责该节点的开门 卫兵 就会打量一下这个来者,根据他的特征给他开左边门还是右边门,直到无路走的时候,到了leaf node,leaf node比较牛X,其实就像个 算命先生 ,告诉你,既然你走到我这来了,我帮你算一卦,你(大概)是什么东西。这个算命先生自然是故作神奇,其实他就是像字典中的一个字而已,他就告诉一下来的人怎么发音,然后这个笨蛋就大概知道了自己的名字。 RF为什么又火了?因为人的天性好玩,微软把人类整天弄得跟猿人一样的还不够,还要让我们玩物丧志!所以就有了X-Box的问世,X-Box的核心就是Kinect,Kinect也不是什么新鲜玩意,而是Kinect背后,有个算法,可以认识前面站了个人,然后还知道人的每个关节大概在哪。这个看似小儿科的东西,微软花了不小的代价,2011年,CVPR的best paper说,他们干了这事: Real-time Human Pose Recognition in Parts from Single Depth Images , Jamie Shotton, Andrew Fitzgibbon, Mat Cook, Toby Sharp, Mark Finocchio, Richard Moore, Alex Kipman, Andrew Blake。这篇文章在algorithm的层面对RF没有太大的贡献。说简单点,RF本身的技术层面只有两个:挑选很好的 卫兵 和 算命先生 ,他们就是这么模型的关键!所有的关于RF的tree的改进都围绕这两个为中心,卫兵,被成为split function 或者 test function,而算命先生,成为leaf model。这篇best paper的test function 很简单,就是选择一个图像的patch,然后在patch里选择两个像素位置,比较其normalized depth。如果对depth image不熟悉也不知何为normalized depth,将其理解为一gray scale image 即可,比较 gray scale 的大小,当位置1的值大于位置2的value大于某个阈值的时候,go left,otherwise, go right. 这个卫兵就要记住两个位置和这个阈值即可,所有来的patch,找到这两个位置然后比较一下就知道该给它开哪个门了。然后到leaf node, 存着一个概率,属于哪个部分的可能性。纵观这个过程,其实tree的目的就是想把属于相同的身体部分的弄到某一个(或一些)叶子。所以,这样的tree其实与codebook learning没有什么区别,每一个叶子就是一个codeword,所以算命先生就是一个复读机,对每个来算命的,其告知的信息都是一样的。 这个由Jamie Shotton领导的组,高举 Andrew Blake 主义的旗帜,坚持科学发paper观,以各种廉价的Intern为基础,全面推进在depth image 中进行人体姿态估计事业的发展。发了一系列的paper: Ross Girshick, Jamie Shotton, Pushmeet Kohli, Antonio Criminisi, and Andrew Fitzgibbon, Efficient Regression of General-Activity Human Poses from Depth Images , in ICCV , IEEE, October 2011。 Min Sun, Pushmeet Kohli, and Jamie Shotton, Conditional Regression Forests for Human Pose Estimation , in Proc. CVPR , IEEE, 2012 Jamie Shotton, Ross Girshick, Andrew Fitzgibbon, Toby Sharp, Mat Cook, Mark Finocchio, Richard Moore, Pushmeet Kohli, Antonio Criminisi, Alex Kipman, and Andrew Blake, Efficient Human Pose Estimation from Single Depth Images , in Trans. PAMI , IEEE, 2012 Jonathan Taylor, Jamie Shotton, Toby Sharp, and Andrew Fitzgibbon, The Vitruvian Manifold: Inferring Dense Correspondences for One-Shot Human Pose Estimation , in Proc. CVPR , IEEE, June 2012 说到灌水这事,人家有本事当然可以灌水。并且,Reviewers肯定知道,这些papers只能出自于他们组,为什么? 要知道这个原因,就要说这篇best paper为什么是best paper了。前面说了,其实在RF技术层面上,没有什么建树。其神奇之处在于其训练方法。RF一直有个比较困扰的问题就是依赖于比较大的数据进行训练。而这个问题的对象是人,人的自由度那么大,并且要获取准确的3D ground truth也不是一个简单的事,这帮聪明的家伙用到了计算机图形学,造了一堆的各种虚拟的人。男男女女,大大小小,丑的漂亮的,当官的(肚子大的)或者萎缩男(色咪咪的)都造出来了,然后他们有很大的数据库可以存,电脑也很好,内存怎么说也要一个T才行,注意是RAM,不是hard drive。当然,他们有钱,这些都好办!所以,发这些文章的,能是别人吗?在ICCV CVPR一年有几篇关于这个问题的,鬼都知道肯定是他们的paper。 但是,灌水归灌水,其含金量确实值一篇cvpr 或者iccv,今天先写到这(第一次发现用我的电脑打汉字这么困难,ibus不行了,为了写blog,我得找一个在ubuntu下能快速打汉字的pkg). 下一篇我才会切入我想说的,从decision forests到 regression forets. 这才是我的真爱! 【1】 Antonio Criminisi, Jamie Shotton, and Ender Konukoglu, Decision Forests: A Unified Framework for Classification, Regression, Density Estimation, Manifold Learning and Semi-Supervised Learning . In: Foundations and Trends® in Computer Graphics and Vision: Vol. 7: No 2-3, pp 81-227. 本文引用地址: http://blog.sciencenet.cn/blog-941987-690984.html
导演: David Grossman 编剧 : Bill Scott / 杰伊·沃德 主演 : Christopher Showerman / Julie Benz / Angus T. Jones / Thomas Haden Church 类型: 喜剧 / 家庭 / 冒险 制片国家/地区: 美国 / 澳大利亚 语言: 英语 上映日期: 2003-08-18 片长: 87 分钟 又名: 至野一族 2 / 森林泰山 2 IMDb链接: tt0322389 五年后,可爱又略显笨拙的森林之王乔治(克里斯多夫·绍尔曼 Christopher Showerman饰)和美丽的白人少女乌苏拉(朱莉·本茨 Julie Benz饰)一直过着自由自在的丛林生活。然而刚刚身为人父的乔治,却对自己的新身份有些力不从心。一方面,他是淘气顽皮的小乔治(安加斯·T·琼斯 Angus T. Jones饰)的父亲和不太适应丛林生活的乌苏拉的丈夫,一方面他又肩负着森林之王的责任。 而更糟的是,乌苏拉的母亲碧翠丝(克里斯蒂娜·皮克尔斯 Christina Pickles饰)一直千方百计拆散他们。不仅如此,她还伙同乌苏拉以前的未婚夫莱尔(托马斯·哈登·丘奇 Thomas Haden Church饰)计划催眠乌苏拉,极力要把女儿和孙子带回现代社会,然后把乔治的黑猩山夷为平地! 下载地址: http://www.400gb.com/file/76520047
树木可以明显改善微气象或者人居环境,有净化空气、陶冶情操的作用。但树木或者森林每年吸收的污染物(如臭氧、二氧化硫、氧化氮、一氧化碳,铅与PM2.5 10等)可以给人们带来多少好处?很少有人去量化这种效应。 近期,美国农业部林务署的Nowak等人对美国树木或森林净化空气、去除污染物的效应进行了研究,他们发现树木每年可以清除1740万吨的污染物,对人类健康的价值高达68亿美元。这种对污染物的清除直接避免了850多人的死亡,同时也避免了670000个急性呼吸道感染的病例。他们也发现树木在农村的污染物清除比在城市明显,而树木的城市的健康效应明显大于农村的,主要是因为农村地广人稀,而城市则树稀气混。Nowak等人的论文“Tree and forest effects on airquality and human health in the United States”发表在了国际知名杂志Environmental Pollution上。 在一些人眼中,850多人或者670000的数字可能不算什么,有文献报道的数字要远远大于这些数字,估计与数据的处理方法或选用的模型有关。但不管怎样,树木或森林对人们健康的正面作用是毋庸置疑的,可谓“手植一棵树,救人半条命”,把树木带来的健康好处,如本文中的68亿美元用于绿化造林也算是一件利人利己的好事!
接着上一篇,从此网站 http://128.197.168.195/?page_id=93 获得下列仪器的比对: Table 1: Participating TLS and their specifications. Instrument DWEL SALCA RIEGL VZ400 UMB CBL (RIT SICK) FARO FOCUS 3D Institution Boston University University of Salford, UK DSITIA TERN (University of Queensland) University of Massachusetts, Boston University of Southern Queensland Contact Alan Strahler Crystal Schaaf Mark Danson Rachel Gaulton Steve Hancock John Armston Kasper Johansen Crystal Schaaf Zhenyu Zhang Ranging Technique Time-of-flight Time-of-flight Time-of-flight Time-of-flight Phase-shift Recorded Data Waveform Waveform Multiple discrete return Waveform 1st and 2nd discrete return Single discrete return Scan Configuration 0-119 zenith 0-360 azimuth 1.6-97.6 zenith 0-360 azimuth 30-130 zenith 0-360 azimuth 0-135 zenith 0-360 azimuth 0-160 zenith 0-360 azimuth Wavelengths 1063.85 nm 1547.76 nm 1063.4 nm 1545.4 nm 1550 nm 905 nm 905 nm Angular Resolution 1 mrad 2 mrad 4 mrad 1.05 mrad zenith 1.05, 2.1, 4.2 mrad azimuth 0.04-5.03 mrad zenith 0.04-8.73 mrad azimuth 0.25 deg 0.50 deg ≥0.157 mrad Waveform Sampling Interval 7.5 cm 15 cm 30 cm N/A N/A Beam Divergence 1.25 mrad 2.5 mrad 5 mrad 0.56 mrad 0.35 mrad 15 mrad 0.16 mrad Beam Exit Diameter 6 mm 2.4 mm 3.6 mm 7 mm 8 mm 3.8 mm Detector FOV 5 mrad 2.67 mrad Not available Not available Not available Pulse Length (FWHM) 5.1 ns 5.12 ns 1 ns 3 ns 3 ns Not available N/A (CW) Pulse Energy 0.6 μJ 0.6 μJ 0.5 μJ (1664 nm) 5 μJ (1550 nm) 0.48 μJ Not available Not available Laser Class 3R 3R 1 1 3R Pulse Rate 20 kHz 5 kHz 100 kHz 300 kHz 50 Hz 25 Hz Not available Effective Measurement Rate 2,000 p/sec Not available 42,000 p/sec 122,000 p/sec Not available 976,000 p/sec Weight 22 kg 15 kg 9.6 kg 1.1 kg 5 kg Min. Range ~0 ~0 0.5-1.5 m Not available 0.6 m Max. Range 100 m (10% ρ) 150 m (10% ρ) 105 (10% ρ) 200 m (10% ρ) 120 m (10% ρ) 18 m (10% ρ) 20 m (10% ρ) 此外,文中提到比对的数据将来会放在网上,让大家自由下载、研究。
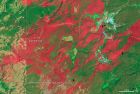
http://carnegiescience.edu/news/first_highresolution_national_carbon_map%E2%80%94panama First High-resolution National Carbon Map—Panama Monday, July 22, 2013 Watch the Carnegie Airborne Observatory make the world's highest resolution carbon map of a country (Panama) in less than one minute http://www.youtube.com/watch?v=_fQwv4coRR8 Washington, DC—A team of researchers has for the first time mapped the above ground carbon density of an entire country in high fidelity. They integrated field data with satellite imagery and high-resolution airborne Light Detection and Ranging (LiDAR) data to map the vegetation and to quantify carbon stocks throughout the Republic of Panama. The results are the first maps that report carbon stocks locally in areas as small as a hectare (2.5 acres) and yet cover millions of hectares in a short time. The system has the lowest demonstrated uncertainty of any carbon-counting approach yet—a carbon estimation uncertainty of about 10% in each hectareoverflown with LiDAR as compared to field-based estimates. Importantly, it can be used across a wide range of vegetation types worldwide. The new system, described in Carbon Balance and Management, will greatly boost conservation and efforts to mitigate climate change through carbon sequestration. It will also inform our understanding of how carbon storage can be used to assess other fundamental ecosystem characteristics such as hydrology, habitat quality, and biodiversity. The approach provides much-needed technical support for carbon-based economic activities such as the United Nations Reducing Emissions from Deforestation and Forest Degradation (REDD) program* in developing countries. Panama has complex landscapes, with variable topography, and diverse ecosystems (ranging from grasslands and mangroves to shrublands and dense forests). As a result, Panama is an ideal laboratory to develop and test a method for quantifying aboveground carbon. Lead author Greg Asner commented: “Three things make this national-scale study unique. First, Panama is an outstanding place for testing carbon mapping approaches due in part to the long-term forest studies that have been undertaken by our partners at the Smithsonian Tropical Research Institute (STRI). Second, we have applied the very latest techniques using high-performance instrumentation, resulting in demonstrably high accuracy at fine spatial resolution. And third the partnership permitted us to estimate our errors in a novel way, and we did so over every point on Panamanian soil.” In addition to Carnegie and STRI researchers, scientists from McGill University and UC-Berkeley combined measurement methods—an extensive and essential network of ground-based plot sampling, satellite imagery, and LiDAR measurements from the Carnegie Airborne Observatory—to achieve the unprecedented accuracy. LiDAR uses reflected laser light to image vegetation canopy structure in 3-D. The scientists calibrated the LiDAR measurements, taken at one-meter resolution throughout nearly one million acres (390,000 hectares), to the carbon density in 228 regional field plots, established and sampled by the collaborating scientists. They used 91 other plots to validate the LiDAR’s aboveground carbon density estimates. “Rarely has such a large number of field plots been available to validate LiDAR calibration independently,” remarked Asner. “Our collaboration with STRI and its partners was vital to assess the accuracy of what we achieved from the air.” Traditional carbon monitoring has relied upon on-the-ground sampling of field plots, but this approach usually represents just small areas of land and is time-consuming. “There has been growing interest in using satellite imagery to cover larger areas, but it is low resolution both spatially and in terms of the structural information about the vegetation,” described Carnegie author Joseph Mascaro. “In some parts of Panama, different global methods disagree by more than 100% at square-kilometer scale.” That’s where the airborne LiDAR comes in. It directly probes the ecosystem’s physical structure, which Carnegie scientists have repeatedly proven to be tightly linked to tropical carbon stocks. These measurements are the bedrock for mapping and estimating the amount of carbon locked up in plants from dense forests to shrublands. The researchers then were able to scale up the plot and LiDAR data with freely available satellite data on topography, rainfall and vegetation to model carbon stocks at the national level. The LiDAR and satellite combination were able to account for variations in the carbon pattern from differences in elevation, slope, climate, and fractional canopy cover over the entire country. For instance, the scientists found that highest carbon levels are in humid forests on the Caribbean side of Panama, often exceeding 110 tons of carbon per hectare (2.5 acres). In contrast, large regions were deforested to very low carbon levels, such as in the developed regions outside the protected watershed of the Panama Canal. Human activity is the overwhelming driver of carbon stock patterns in Panama. “Panama is one of the first UN REDD partner countries, and these new maps put the country at the forefront of high-resolution ecosystem management.” said co-author and STRI’s director Eldredge Bermingham, “The new carbon mapping approach could be the model for other tropical nations.” --------------------- *The objective of UN-REDD+ is to create a financial incentive for developing countries to protect their forest resources in order to offset increasing carbon emissions. By creating financial value for the carbon stored in trees, the aim is to make forests more valuable standing than they would be harvested or destroyed. The Carnegie Airborne Observatory is made possible by the Gordon and Betty Moore Foundation, the Andrew Mellon Foundation, the Grantham Foundation for the Protection of the Environment, Avatar Alliance Foundation, W. M. Keck Foundation, the Margaret A. Cargill Foundation, Mary Anne Nyburg Baker and G. Leonard Baker Jr., and William R. Hearst III. The Department of Global Ecology was established in 2002 to help build the scientific foundations for a sustainable future. The department is located on the campus of Stanford University, but is an independent research organization funded by the Carnegie Institution. Its scientists conduct basic research on a wide range of large-scale environmental issues, including climate change, ocean acidification, biological invasions, and changes in biodiversity. The research reported in this article was based on funding to the CAO described above, a Grantham Foundation for the Protection of the Environment grant to STRI, in addition to Grantham funding for the CAO, SIGEO/ForestGEO funds from the Smithsonian Institution and STRI, and support to the CAO Panama project from William R. Hearst III. The Smithsonian Tropical Research Institute, headquartered in Panama City, Panama, is a unit of the Smithsonian Institution. The institute furthers the understanding of tropical nature and its importance to human welfare, trains students to conduct research in the tropics, and promotes conservation by increasing public awareness of the beauty and importance of tropical ecosystems. See www.stri.si.edu
WWF and Thailand government launch TREEMAPS, the first high-precision forest carbon mapping initiative in South-east Asia Bangkok, Thailand - The Department of National Parks, Wildlife and Plant Conservation (DNP) and WWF-Thailand formally launched on June 6th the joint project, TREEMAPS - Tracking Reductions in Carbon Emissions through Enhanced Monitoring and Project Support - which aims to establish Thailand’s first forest carbon basemap and monitoring system, as well as establishing a sub-national REDD+ project. Presiding over the launch ceremony at the Rama Gardens Hotel were Mr. Chote Trachu, Permanent Secretary of the Ministry of Natural Resources and Environment which oversees all of Thailand’s conservation agencies, Dr. Ingo Winkelmann, Minister and Deputy Head of Mission of the German Embassy in Bangkok who represented the project’s major donor – the German government, and Mr. Petch Manopawit, Manager of WWF’s Conservation programme in Thailand. TREEMAPS’ overriding objective is for Thailand to develop the capacity at the national level - and, in one region, at the sub-national level - to measure and monitor change in forest carbon and to take advantage of the full range of emerging forest carbon financing and benefit opportunities. Data will be collected from three sources: satellite imagery, on-the-ground surveys and through the use of groundbreaking LiDAR technology. “WWF is introducing cutting-edge LiDAR technology to help Thailand survey carbon levels in forests to establish its first carbon basemap with accurate data on carbon inventory and a reliable system of monitoring carbon level in forests,” said Mr. Justin Foster, Project Director of TREEMAPS with WWF-Thailand. LiDAR, which stands for Light Detection and Ranging, utilizes a highly sensitive airborne sensor that bounces laser beams off foliage in forests and ground below to measure ground topography, forest height and structure at the highest precision available today. LiDAR will be the key technology employed in developing Thailand’s first forest carbon basemap. LiDAR scanners will be fitted to aircraft conducting aerial surveys. The aerial surveys will collect data that will subsequently be processed to produce 3D (three dimensional) images of the surveyed forest. The data collected will provide highly accurate information, which will form the basis of a forest carbon basemap. The creation of the forest carbon basemap will allow for ongoing monitoring of changes in Thailand’s forests. Thailand is the first country in Southeast Asia to adopt and employ LiDAR technology for forest conservation through this WWF initiative. According to Dr. Songtham Suksawang, Director of the National Park Research Division, and an expert in forest and wildlife conservation, the TREEMAPS project does not solely focus on the collection of scientific data but attracts involvement of local stakeholders such as forest dependent communities in how the project is run. “Promoting the involvement of people to actively plant trees supports the creation of a carbon credit market,” said Dr. Songtham. “At the same time, other environmental services such as water resources management, tourism, wildlife conservation are also included in the project’s mission statement and this mutually benefits all aspects of conservation work simultaneously.” The TREEMAPS project will initiate a pilot initiative in the Dong Phayayen Khao Yai (DPKY) Forest Complex in the northeast of Thailand. The area, which includes several national parks, is a UNESCO World Heritage Site and host to globally important forest ecosystems and more than 800 species, including tigers, elephants and gibbons. But the forest area has suffered severe impacts from deforestation and encroachment. Over the past 20 years, Thailand lost 577,000 hectares of forest, at an average rate of 0.15% per year. Estimates of forest degradation are currently not available Prior to the TREEMAPS project, the available approaches for measuring forest carbon in Thailand were not capable of delivery the level of accuracy required by REDD+ or private sector voluntary carbon markets. REDD+ (Reducing Emissions from Deforestation and forest Degradation in Developing Countries) is an initiative of the United Nations (UN) to reduce emissions from deforestation and forest degradation, promote conservation and sustainable management of forests and enhancement of forest carbon stocks. TREEMAPS provides an opportunity for Thailand to receive funding support through REDD+ and various other payment for ecosystem services (PES). However, in order to benefit from the REDD+ programme and receive funding from these mechanism, Thailand must first establish a system to measure and monitor changes in forest carbon levels, that meets the highest level of accuracy (tier 3) of the Intergovernmental Panel on Climate Change (IPCC). TREEMAPS hopes to play a key role in conserving forests for Thai people to receive the full benefits of REDD+ initiatives, exchange knowledge, skills, experiences and lessons learned with other countries and regions. Additionally, various co-benefits and environmental services will be experienced, such as climate change mitigation as well as the creation of new opportunities for Thai people to maximize benefits from managing forests sustainably. WWF’s TREEMAPS project has received financial support from the Germany’s Federal Ministry for the Environment, Nature Conservation and Nuclear Safety (BMU) under the its International Climate Initiative (ICI) framework. 引自: http://wwf.panda.org/what_we_do/where_we_work/greatermekong/news/?208960goback=.gde_1317037_member_249792412
相关下载详见 “视觉计算研究论坛”「SIGVC BBS」: http://www.sigvc.org/bbs/thread-29-1-3.html Random forest = a classifier consisting of a collection of tree-structured classifiers {h(x,Qk),k=1,...} where the {Qk} are independent identically distributed random vectors and each tree casts a unit vote for the most popular class at input。 Two kinds of RF —Results of Forest-RI —误差率和AdaBoost差不多 —F = 1 和 log2M + 1误差率差不多 —在三个大数据集上F = 1 比 log2M + 1误差率有一定差距 —结论: —RF和AdaBoost的分类性能差不多 —RF的速度比AdaBoost快很多 —很多时候只随机取一个输入(F=1)就能得到很好的效果 —Results of Forest-RC —误差率和AdaBoost差不多 —小样本集上F=2足够,F=8有点多余 —大样本集上F=8更好 —结论: —RF和AdaBoost的分类性能差不多 —Forest-RC和Forest-RI差不多,在合成数据集上Forest-RC更好 —RF的特点: —具有和现有最好的分类算法同样的分类性能 —速度快:可以并行(更快),不需要交叉验证 —不会过拟合 —数据不需要预处理,对外点和缺少特征鲁棒 —可以用定义的样本proximity进行聚类 —和boosting比的优点: —调节参数较容易 —大样本集上速度快 —不会过拟合 —可以并行处理各个树,因为它们是独立的 —证明误差上界和分类器强度和彼此相关性的关系 —多种随机性可以提高分类性能:随机输入,bagging
为了防止剽窃,本文的修正系数和实验数据以及实验过程和式中的函数式暂时还不能公布,请大家谅解! 特别说明:未经 本文作者 的允许任何人不得 转载 本文和 引用 本文内容 物体流动力应用之一:物体的流动力在 气象 上的应用 周 强 内容摘要 本文作者独创大气流动力和水汽饱和质量的概念, 通过对流动力的研究,我们就能理解物体为什么能漂浮在空中,很容易理解水汽为什么会被冷空气或热空气所阻断, 和 台风 和 龙卷风 形成的原因以及没有森林所导致的各种台风、 暴雨 、泥石流以及干旱,沙尘暴等自然 灾害 的原因以及对饱和质量的研究提出大气降雨的条件。 关键词: 流动力,流动力差,饱和质量,台风,森林 基本概念 1、流动力 在一个开放的环境里,任何物体都会有流动的趋势,从 高温 流向低温,从高浓度流向低浓度,从高压到低压,那么这个流动趋势就存在一个流动的力,把这个流动的力称为流动力,用字母 F 表示: F= k Tρg / P (注:此公式为原创,未经作者同意不得引用) ( 1 ) 这里 k 是修正系数 g 为星球对物体的重力加速度 T 为此流动物质温度 ρ此流动物质的浓度 P 为此流动物质所受的压强 当然如果把浓度ρ换算成密度 ρ , 则 ρ可以写成 n ρ , 则公式可以写成: F= k Tn ρ g / P (注:此公式为原创,未经作者同意不得引用)( 1 -1 ) 这里 n 为此物质的量(分子的数量或摩尔数) ρ 为此物质的密度 2.饱和质量和物体的降落 当 T ρ /P 达到平衡时,如果此物质的气体状态开始液化时,则此物体在此温度 T 下达到饱和状态。此时的 M 为此温度下的饱和质量 M 饱 。 当物质凝聚时的质量 m 大于或等于 M 饱 时,物体就会因为重力而降落。 由( 1 )式我们知道, F=M 饱 g 即 k T ρ g / P = M 饱 g 则 M 饱 = k T ρ / P (注:此公式为原创,未经作者同意不得引用) (2) 3、流动力差 在一个开放的环境里,一个物体从 A 地流向 B 地时,或从 B 地流向 A 地,必然存在一个高温流向于低温,从高浓度流向于低浓度,从高压到低压的一个流动过程,并最终达到一个相对平衡过程。 在一个开放的环境里,不管什么样的地表物,它们每时每刻都在和外界寻找这样一个相对平衡的过程。那么物体能不能互相流动,决定于他们二地的流动力的差值,我们把他称为 f f = F B - F A =k T B ρ B g / P B - k T A ρ A g / P A 即 f =k ( T B ρ B / P B - T A ρ A / P A ) g (注:此公式为原创) ( 3 ) 由( 3 )式知: 当 T A ρ A / P A > T A ρ A / P A 时, ( 4 ) 物体从 A 地流向于 B 地 当 T A ρ A / P A = T A ρ A / P A 时, ( 5 ) 物体处于相对平衡状态 当 T A ρ A / P A < T A ρ A / P A 时, ( 6 ) 物体从 B 地流向 A 地 实际应用 1.物体为什么能漂浮在空中 由( 1 )的流动力和物体在星球所受的重力我们可以知道: 1) .当物体的流动力大于物体的重力时: 即 F > mg ( 7 ) 物体就会飘在空中 2) .当物体的流动力等于物体的重力时: 即 F=mg ( 8 ) 物体就会处于相对平衡状态 3) .当物体的流动力小于物体的重力时: 即 F < mg ( 9 ) 物体就会降落和静止在地表面上 2、台风和龙卷风是怎么形成的? 当 A 地和 B 地形成巨大的反差如我在《台风的奥秘》所说的,一侧水汽畅通,另一侧水汽不畅通,或者二侧冷空气和热空气相遇时,那么二侧就会形成巨大的反差,也就是( 3 ) f =k ( T B ρ B / P B - T A ρ A / P A ) g 也就会形成巨大的力 当 A 地的流动力远远大于 B 地流动力,则 A 地所爆发出力威力惊人,水汽就在这股力的爆发下形成了台风和龙卷风。 所以当冷热空气( T 变化 )相遇或浓度变化(ρ变化:一侧多一侧少)都会造成台风或龙卷风。 3、冷空气和热空气为什么能阻挡水汽输送? 当 T A ρ A / P A =T B ρ B / P B 时,空气就相当于处于平衡,即使 T B 温度低和它的浓度ρ B 低,如果同时压强 P B 也低时,那它们的 T B ρ B / P B 一样会跟水汽浓度较高的 A 地的 T A ρ A / P A 的值很接近,也就是 A 地 和 B 地处于相对平衡状态,也就是说冷空气阻拦了水汽前进的步伐! 也有很多 气象 学说认为这个问题是高山阻挡了水汽通过,实际上并不是高山阻挡水汽输送了,是高山的冷空气阻挡了水汽的流通!因为随着海拔的升高,温度及压强都在降低,那么高山的 T B ρ B / P B 一样可以很接近平原的热空气的 T A ρ A / P A ,让水汽过不去(二地的流动力处于相对平衡状态),也就是阻挡了空气的水汽的流通!同样的道理,热空气也一样容易阻断水汽的流通! 4、水汽的饱和及雾的形成和雨的降落形成 由( 2 )式知道,当 T ρ / P 一定时,水汽接近液化浓度时水汽处于饱和状态,则 M饱 为此温度下的饱和质量,同时水汽处于液化状态时,雾就会形成。 如果凝结的水汽质量 m 大于M 饱 饱和质量,则降雨就会容易形成。 水汽 降落 必须克服他本身的流动力,也就是当他的的 重力 大于 他的 流动力 时才能降落!而达到刚刚降落的条件就是重力和流动力相等,也就是达到饱和质量M! 而没有凝结核的水汽所凝结的质量m是远远没有办法大于他自身的饱和质量 M 饱 的!这也是澡堂水汽足够大而无法降雨的原因! 而有凝结核的水汽结合一般要大于没有凝结核的几倍,最大可以达到6m。 而6m却可以很轻松大于他的饱和质量 M 饱 ,这也是为什么阿联酋在湿度30%以上能实行52场降雨的原因! 5、没有森林,为什么冷空气能迅速南下?为什么很难下雨? 当 T A ρ A / P A < T B ρ B / P B 时,如果本地 A 也没有森林,本地 A 的水汽浓度ρ A 也就会很低,随着本地温度 T A 的降低, B 地冷空气的流动力就会远远大于 A 地的,从而造成 B 地的冷空气迅速流向 A 地,同时也造成沿海 C 地来的暖湿水汽被 A 地冷空气所阻挡!也就是没有森林的情况,冷空气更容易迅速南下。 同样的道理,没有森林,本地温度会迅速升温,从而也导致上风处水汽无法输送过来,也就是说热空气一样会阻挡水汽的输送!所以水汽很难经过裸露的地表 如果没有森林,相应本地的ρ也小,同时没有森林凝结核也少,水汽凝聚的质量 m 无法克服重力条件( 重力大于流动力 )而降落,也即 m < M饱 ,另外水汽即使达到饱和条件,它也很难克服重力条件降落。从我的《 水汽的水分子是如何结合的》可以知道,有凝结核的凝结的质量相当于正常凝结的质量的 6 倍,也就是 6m 。 所以只要有足够的水汽和凝结核,凝结核所凝結的水汽质量 6 倍于没有凝结核所凝结水汽的质量m,他很容易大于饱和质量 M 饱 ,而形成降雨! 即: 6m ≥ M 饱 因此借助凝结核的作用,水汽凝聚的质量可以六倍于没有凝结核的质量,即就是 6m ,这个 6m 就很容易超过饱和质量 M 饱 而降落成雨,同时大量的饱和水汽也随着降雨的带动一起沾上而下,雨就会越下越大,这时即使没有凝结核,饱和水汽也会倾盘而下。 当然海洋的生物凝结核是最多的,制造的云(含有凝结核的水汽凝结)也是最多的,但他必须不被冷空气阻断才可以到达内陆地方!但从我们上面论述可以看到,没有森林,冷空气能迅速流动,从而很容易阻断水汽流动和向内陆输送,再加上凝结核的缺少,水汽很难在内陆形成降雨!那么没有大量水汽进入内陆,就导致内陆容易出现干旱,甚至沙尘暴!同时被阻断的水汽要么改道,要么造成二地极大的浓度反差就会造成局部(特别是沿海)暴雨,甚至龙卷风和台风! 总结 从上面分析知道,沙尘,干旱,暴雨和台风最关键的是降雨,而从对流动力分析知道降雨有三种情况: 1 . 第一种 有 大量水汽 且有一定量凝结核的 暴雨或台风式 降雨 有 大量的水汽 (包括来自大量海洋水汽和本地蒸发的水汽),也就是浓度ρ高,且有 一定的凝结核 (主要来自海洋),这时大量水汽被阻而接近于饱和(湿度一般都超过 80% 以上),再加上大量带有凝结核的海洋水汽的加入导致水汽凝结的质量 m 超过饱和质量 M 饱 而降雨,这种方式的降雨一般都是暴雨,甚至台风式降雨。这种降雨一般出现在沿海地区比较多,是我们不愿意见到的,因为它容易带来灾难(台风,洪水,泥石流),而且更可怕的原因是大量海洋水汽被释放在沿海,导致内陆地区水汽不足而造成内陆出现严重的干旱或沙尘暴。 2 . 第二种 有足够的水汽和凝结核的 冷热空气交汇式 降雨 当 热空气和冷空气相交汇 时,热空气有 足够的水汽和凝结核的云 (来自于海洋生物的凝结核的云比较多),而冷空气使热空 气温 度降低而让相交汇的热空气达到低温时的饱和质量 M 饱 ,从而形成降雨。也就是有一定的凝结核,且有足够的水汽,且遇到低温时降雨的方式,这种方式是最多的,也是我们经常所见到的降雨,特别是缺少森林地区是唯一可以降雨的方式,也就是“靠天吃饭”。 3 . 第三种 有足够多凝结核的 森林式 降雨 当水汽 不是很足够 时(湿度不能低于 30% ),要降雨必须有 足够多的凝结核 ,而凝结核在陆地一般大部分来自于森林或者人工产生,也就是满足 6m 大于 M饱的降雨条件才能降雨。而森林却是最自然的,而且随时随地都可能留住水汽。这种情况最多的是森林丰富的地区(各地的自然保护区),森林地区自成一体的成为局部气候条件。而一旦自然保护区失去森林,这些地方就只能依靠“老天”降雨的方式,也就是第二种降雨的方式,否则这些地区就只能出现干旱,甚至沙尘。 这个云南是最明显的例子!孟加拉湾上来的水汽(从孟加拉湾,印度东部和缅甸)很容易切断南下云南的冷空气,从而使得云南很难受冷空气的侵袭,让云南常年温暖,但没有冷空气同时也没有冷热交汇也就很难有第二种降雨方式!一旦云南地区森林被破坏,连第三种降雨方式也失去,云南干旱就不可避免! 2011-11-13 初稿于 沈阳 2012-2-18 修正于沈阳
特别说明:未经 本文作者 的允许任何人不得 转载 本文和 引用 本文内容 台风的奥秘(修订版) 周 强 内容摘要 通过对二地流动力的分析和以及水汽为什么会被冷空气或热空气所阻, 和 台风和龙卷风以及沙尘暴形成的原因以及没有森林所导致的各种台风、暴雨、泥石流以及干旱,沙尘暴等自然灾害的原因和解决方法! 关键词:流动力,水汽被阻,台风,森林,解决台风 基本概念 1 、 流动力 在一个开放的环境里,任何物体都会有流动的趋势,从高温流向低温,从高浓度流向低浓度,从高压到低压,那么这个流动趋势就存在一个流动的力,把这个流动的力称为流动力,用字母 F 表示: F= k T ρ g / P (注:此公式为原创,未经作者同意不得引用) ( 1 ) 这里 k 是修正系数 g 为星球对物体的重力加速度 T 为此流动物质温度 ρ 此流动物质的浓度 P 为此流动物质所受的压强 当然如果把浓度 ρ 换算成密度 ρ , 则 ρ 可以写成 n ρ , 则公式可以写成: F= k Tn ρ g / P (注:此公式为原创,未经作者同意不得引用)( 1-1 ) 这里 n 为此物质的量(分子的数量或摩尔数) ρ 为此物质的密度 2 . 1 水汽是如何被阻 当 T A ρ A / P A =T B ρ B / P B 时,空气就相当于处于平衡,即使 T B 温度低和它的浓度ρ B 低,如果同时压强 P B 也低时,那它们的 T B ρ B / P B 一样会跟水汽浓度较高的 A 地的 T A ρ A / P A 的值很接近,也就是 A 地 和 B 地处于相对平衡状态,也就是说冷空气阻拦了水汽前进的步伐! 也有很多气象学说认为这个问题是高山阻挡了水汽通过,实际上并不是高山阻挡水汽输送了,是高山的冷空气阻挡了水汽的流通!因为随着海拔的升高,温度及压强都在降低,那么高山的 T B ρ B / P B 一样可以很接近平原的热空气的 T A ρ A / P A ,让水汽过不去(二地的流动力处于相对平衡状态),也就是阻挡了空气的水汽的流通!同样的道理,热空气也一样容易阻断水汽的流通!如下图: 水汽聚集区,要么就地解决,要么改道! 2 . 2 为什么没有森林,水汽更容易被阻 当 T A ρ A / P A < T B ρ B / P B 时,如果本地 A 也没有森林,本地 A 的水汽浓度ρ A 也就会很低,随着本地温度 T A 的降低, B 地冷空气的流动力就会远远大于 A 地的,从而造成 B 地的冷空气迅速流向 A 地,同时也造成沿海 C 地来的暖湿水汽被 A 地冷空气所阻挡!也就是没有森林的情况,冷空气更容易迅速南下。 同样的道理,没有森林,本地温度会迅速升温,从而也导致上风处水汽无法输送过来,也就是说热空气一样会阻挡水汽的输送!所以水汽很难经过裸露的地表,如下图: 水汽很难经过裸露的地表 3 .台风,龙卷风以及沙尘暴是怎么形成的? 我们先看看流动力的公式: F= k Tρg / P 从这个公式可以看出(以北半球来分析): 1) 温度的变化:冷热空气交汇,也就是西北冷空气南下冷空气的流动力和东南方向北上的暖湿气流的流动力刚好形成逆时针旋转的气流,大部分海洋气旋是由他产生的,如下图: 2) 浓度的变化: 一侧 水汽畅通 ,另一侧水汽 不畅通, 二侧水汽的流动力就会形成一对初始力偶 3) 压强的变化: 一侧 低气压 ,另一侧高压 , 二侧水汽的流动力也会形成一对初始力偶 而实际上,气旋是由这三者共同作用形成的! 当 A 地和 B 地形成巨大的反差,二侧冷空气和热空气相遇时或者一侧水汽畅通,另一侧水汽不畅通,那么二侧就会形成巨大的反差,也就是( 3 ) f = k ( T B ρ B / P B - T A ρ A / P A ) g 也就会形成巨大的力! 当 A 地的流动力远远大于 B 地流动力,则 A 地所爆发出力威力惊人,水汽就在这股力的爆发下形成了台风和龙卷风以及沙尘暴。如下图: 远洋台风气旋 龙卷风气旋 沙尘暴气旋 所以当冷热空气( T 变化)相遇或浓度变化(ρ变化:一侧多一侧少)压力变化(一般他跟着前面二个)都会造成台风或龙卷风和沙尘暴。 4. 台风是怎么加强和消失 台风萌芽于海洋的 不同位置 ,但台风 加强 和 壮大 几乎是沿着水汽大量被阻的地方,而尤其是大量水汽被阻的 大陆沿海 或大陆海岸线最多!水汽被阻的归根结底是水汽通道 不畅通 !在大陆来说 森林植被 被严重破坏所致!而对于海洋来说不畅通主要是冷空气阻碍以及大量的往二极走的大量水汽! 气旋在 大量的水汽 被阻的 地方 壮大和加强: 气旋一旦没有 大量水汽 的补充,他自动就会在行走的沿途慢慢减弱,直至最后消失! 5. 台风的发生的几种情况 A 一般有 森林丰富 的沿海是没有大量被阻的水汽的 , 台风到这样的沿海一般是减弱的 , 如南美洲 , 美国东部 , 北欧 , 俄罗斯等。 B 一般森林 破坏严重 的地区有大量水汽被阻 , 台风经过这样的地区都容易加强 , 如印度尼西亚 , 菲律宾 , 中国沿海 , 越南 , 孟加拉湾 , 马达加斯加 , 墨西哥 , 美国中南部 , 澳洲等 . 当然如没有大量被阻水汽 , 台风一样是减弱的啊 。 C 还有一些 四周没植被 的如波斯湾 , 渤海湾等 " 水汽死湾 " 连下雨都很少 , 不要说台风光顾不到了,就连下雨对于这些地区几乎是很“奢侈”。 D 远洋和森林丰富地区如果 遇到冷空气和热空气也会造成水汽被阻,这时在这些地方也能形成台风 ( 海洋中心的台风 ) 和龙卷风! 6. 结论:为什么要解决台风? 所有气候灾害说穿了(从 整体 考虑)他们就是 一个问题 : 水多水少的问题 ! 水多 就暴雨,水 太多 就台风, 水少 就干旱,水 太少 就沙尘!就是因为海洋每年 产生的水汽 大致差不多,您 上风处 台风水下多了,我 下风处 水自然就少(干旱),甚至太少或没有水(沙尘)! 物质永远是遵守 守恒 定律的,不可能 无缘无故 多了,也不可能 无缘无故 的少了,有地方多了 必然 就有地方少了! 所以 解决台风 , 不光光 是 解决 台风问题, 同时 也是解决干旱问题!也就是解决水汽分配 不均匀 的问题!解决水汽不均 最关键 是森林,有关森林已经另外有文章解释,这里就不重复了! 森林 恢复了,水汽 顺畅 了, 干旱 解决了,沿海 没有被阻 水汽,没有 大量水汽 来 加强 和 壮大 台风,台风在海洋中心 萌芽时期 不久自然也就消失了! 水太多(台风)和水太少(沙尘)是水汽 分配极不均匀 的二个极端!认为台风有益和沙尘有益都是一种极端错误的意识行为! 2011-1-18 草于北京 2012-6-5 修订于沈阳
有人说:“死后把我的骨灰撒到森林里去吧,这一生我用了太多的纸,我要弥补那些树。”想想我浪费过的那些 A4 纸,恐怕三生三世都弥补不完。所以,写此文告诫自己:还是趁活着的时候,节约用纸吧。 一、 有一段时间在综合办公室工作。每天一项固定任务就是:将外界发来的文件、传真交给上司 a 。 a 将它们过滤一遍之后,再交给他的上司—— A 或者 B 。我们的传真机设置为自动接收,因此难免会收到大量垃圾传真:假帐、发票、烟酒、全国厨师大会……每天放进传真机里的纸,总是飞快地被这些内容消耗掉。怎么办?更改它的设置是不现实的,因为当时办公室另外一个资历比我老的女孩不愿意将传真改为“非自动接收”,理由是“我们的工作量太大,不能再额外增加麻烦了”。后来我想到的办法是,把没有用的传真件、或者其他只用了一面的纸张再次放进传真机里,于是新的传真内容可以印在它们的反面,以此达到二次利用的目的。本以为这是个好方法,然而有一天, a 对我说:“你节省资源、有环保思想,这是好事。但是交给领导的传真文件背面,都是一些无关信息,他们看了会不高兴的。” 这里需要解释的是,我所在的那个单位,实际上是以生态和环保作为核心理念之一的单位。而且无论 A 或者 B ,都是很注重节约资源的。有一次其中一位群发邮件,说“虽然我很怀疑全球变暖的真实性和科学性,但是低碳的生活方式还是值得提倡的。楼道的灯经常白白点着,建议大家随手关灯。”这样的一个人,我相信他会认同节约用纸的行为。但是我不知道怎样在不得罪上司 a 的情况下,让 a 的上司 A 或者 B 接受我的“双面传真”。这已经不是一个环保问题了,而是一个“办公室政治”的问题了——有一天舍友跟我说了一道求职面试题:“如果你的上司给你提出一个思路,而你上司的上司则给你提出另外一个思路,你应该怎么办?”我对于此类问题完全无感,所以就像小学生一样回答“那就按上司的上司的思路来办呗”。她立刻否决,“绝对不能这样。你千万不要让你的上司觉得你有‘越级交流’的嫌疑。你可以尝试着说服你的上司,但是不要说这是他的上司的意思”。 后来,利用职代会征求职工意见的机会,我把“双面用纸办公”的事情写了一条提案,交给了青年职工代表。不过,这条提案很快就被淘汰了——与青年职工更加密切的幼儿园建设、子女入学、住房等问题才是更值得关注的焦点。我的这一条似乎与任何人的福利都无关的提案,自然毫无悬念地被淹没了。 二、也是在那家单位工作的时候,有一次连续两天加班到深夜:第一天工作到零点,第二天是一点半。 因为面临一场检查,所以要临时印制一些与那场检查相关的规章制度等等。我们依据上级部门的红头文件的指示,依据兄弟单位的范本,一丝不苟地制造出一摞摞原本不存在的规章制度、审批表。估算了一下,就我负责的那一小块,总共大概耗费了 3000 张 A4 纸。我多么不愿意看到这一幕,然而我却是亲自参与者。 这场大规模劳民伤财之事,起因据说是某单位的人将工作文件带回家去处理,谁知家里的电脑上有木马,将他的文件窃取到国外。于是,全国各地所有相关单位都要来一场信息安全教育和检查。本来重点是计算机这一块,但是大家都希望检查的时候内容能够详实一点,于是纷纷制造出各种规章制度。但是这些资料基本上都是临时编造出来的。以兄弟单位的一本汇编资料为例,错别字很多,显然是仓促之间赶制出来的。而人家已评为示范单位,所以我们也得效仿。于是对于这场检查的准备就已经渐渐偏离主题了——计算机这一块已经不是重点,起草、打印、复印文件才成了重点,那位可怜的电脑网络技术人员,白天负责检查全单位的电脑,而晚上也不能歇着——要陪我们一起设计“文件汇编”的封底封面、要起草各项内容。而本来是重点的与保密工作相关的木马病毒,却只是我们辛苦劳作间隙穿插的谈资。不同年龄、不同学历、各个岗位、各个工种的同事都从各自的角度来分析这场加班的无意义性,然而大家还是熬到深夜。后来,究竟浪费了多少张 A4 纸?我没有数,只知道很厚、很厚。 后来,我辞职了。在现在的环境里,对于纸张的消耗量,远远少于从前,顶多只是复印几本书,打印一点论文。但是,在不久的将来,开题和毕业论文都接踵而至,大量用纸是少不了的。但愿我的工作和文字,能够不辜负那些洁白的 A4 纸。 另:关于造纸,云南金光集团对于桉树的辩护声势浩大。冯永锋在《拯救云南》一书中对于这场争论写得很详细。“ 2005 年 6 月,我去拜访一位资深林业专家。他拿着 4 月 14 日的《云南日报》给我看。这是一个整版面向金光集团倾斜的报道……报道以贫困作为‘文学切入口’,指责反对大面积种植桉树的人是在‘漠视贫困’。”姑且不论种植桉树是否能提高当地贫困人口的生活质量;也不论破坏原生林对生物多样性的影响;单只凭“受利益因素驱使而做的研究”,就很难保证其客观性。所以“种桉树合理论”的文章,哪怕写得再好,也疑似“精致的贪婪主义”。 而我唯一能做的,就是少用一点纸。
特别说明:未经 本文作者 的允许任何人不得 转载 本文和 引用 本文内容 物体流动力应用之一:物体的流动力在气象上的应用 周 强 内容摘要 本文作者独创大气流动力和水汽饱和质量的概念, 通过对流动力的研究,我们就能理解物体为什么能漂浮在空中,很容易理解水汽为什么会被冷空气或热空气所阻断, 和 台风和龙卷风形成的原因以及没有森林所导致的各种台风、暴雨、泥石流以及干旱,沙尘暴等自然灾害的原因以及对饱和质量的研究提出大气降雨的条件。 关键词: 流动力,流动力差,饱和质量,台风,森林 基本概念 一、 流动力 在一个开放的环境里,任何物体都会有流动的趋势,从高温流向低温,从高浓度流向低浓度,从高压到低压,那么这个流动趋势就存在一个流动的力,把这个流动的力称为流动力,用字母 F 表示: F= k T ρ g / P (注:此公式为原创,未经作者同意不得引用) ( 1 ) 这里 k 是修正系数 g 为星球对物体的重力加速度 T 为此流动物质温度 ρ此流动物质的浓度 P 为此流动物质所受的压强 当然如果把浓度ρ换算成密度 ρ , 则 ρ可以写成 n ρ , 则公式可以写成: F= k Tn ρ g / P (注:此公式为原创,未经作者同意不得引用)( 1 -1 ) 这里 n 为此物质的量(分子的数量或摩尔数) ρ 为此物质的密度 二. 饱和质量 和物体的降落 当 T ρ / P 达到平衡时,如果此物质的气体状态开始液化时,则此物体在此温度 T 下达到饱和状态。此时的 m 为此温度下的饱和质量 m 饱 。 当物质凝聚时的质量 m 大于或等于 m 饱 时,物体就会因为重力而 降落 。 由( 1 )式我们知道, F =m 饱 g 即 k T ρ g / P = m 饱 g 则 m 饱 = k T ρ / P (注:此公式为原创,未经作者同意不得引用) (2) 三、 流动力差 在一个开放的环境里,一个物体从 A 地流向 B 地时,或从 B 地流向 A 地,必然存在一个高温流向于低温,从高浓度流向于低浓度,从高压到低压的一个流动过程,并最终达到一个相对平衡过程。 在一个开放的环境里,不管什么样的地表物,它们每时每刻都在和外界寻找这样一个相对平衡的过程。那么物体能不能互相流动,决定于他们二地的流动力的差值,我们把他称为 f f = F B - F A =k T B ρ B g / P B - k T A ρ A g / P A 即 f =k ( T B ρ B / P B - T A ρ A / P A ) g (注:此公式为原创) ( 3 ) 由( 3 )式知: 当 T A ρ A / P A > T B ρ B / P B 时, ( 4 ) 物体从 A 地流向于 B 地 当 T A ρ A / P A = T B ρ B / P B 时, ( 5 ) 物体处于相对平衡状态 当 T A ρ A / P A < T B ρ B / P B 时, ( 6 ) 物体从 B 地流向 A 地 实际应用 一.物体为什么能 漂浮 在空中 由( 1 )的流动力和物体在星球所受的重力我们可以知道: 1 .当物体的流动力大于物体的重力时: 即 F > mg ( 7 ) 物体就会飘在空中 2 .当物体的流动力等于物体的重力时: 即 F=mg ( 8 ) 物体就会处于相对平衡状态 3 .当物体的流动力小于物体的重力时: 即 F < mg ( 9 ) 物体就会降落和静止在地表面上 二、 台风和龙卷风 是怎么形成的? 当 A 地和 B 地形成巨大的反差如我在《台风的奥秘》所说的,一侧水汽畅通,另一侧水汽不畅通,或者二侧冷空气和热空气相遇时,那么二侧就会形成巨大的反差,也就是( 3 ) f = k ( T B ρ B / P B - T A ρ A / P A ) g 也就会形成巨大的力 当 A 地的流动力远远大于 B 地流动力,则 A 地所爆发出力威力惊人,水汽就在这股力的爆发下形成了台风和龙卷风。 所以当冷热空气( T 变化 )相遇或浓度变化( ρ变化 :一侧多一侧少)都会造成台风或龙卷风。 三、冷空气和热空气为什么能 阻挡水汽输送 ? 当 T A ρ A / P A = T B ρ B / P B 时,空气就相当于处于平衡,即使 T B 温度低和它的浓度ρ B 低,如果同时压强 P B 也低时,那它们的 T B ρ B / P B 一样会跟水汽浓度较高的 A 地的 T A ρ A / P A 的值很接近,也就是 A 地 和 B 地处于相对平衡状态,也就是说冷空气阻拦了水汽前进的步伐! 也有很多气象学说认为这个问题是 高山 阻挡了水汽通过,实际上并不是高山阻挡水汽输送了,是高山的冷空气阻挡了水汽的流通!因为随着海拔的升高,温度及压强都在降低,那么高山的 T B ρ B / P B 一样可以很接近平原的热空气的 T A ρ A / P A ,让水汽过不去(处于相对平衡状态),也就是阻挡了空气的水汽的流通,那么被阻挡的水汽就容易形成高压带!同样的道理,热空气也一样容易阻断水汽的流通! 四、 水汽的饱和 及 雾 的形成和 雨 的降落形成 由( 2 )式知道,当 T ρ / P 一定时,水汽接近液化浓度时水汽处于饱和状态,则 m 饱 为此温度下的饱和质量,同时水汽处于液化状态时,雾就会形成。 如果凝结的水汽质量 m 大于 m 饱 饱和质量,则降雨就会容易形成。 五、 没有 森林,为什么冷空气能 迅速 南下?为什么 很难 下雨? 我们从前面( 4 )式可以知道 T A ρ A / P A > T B ρ B / P B 时,如果本地 B 没有森林,本地 B 的水汽浓度ρ B 也就会很低,随着本地温度 T B 的降低, A 地冷空气的流动力就会远远大于 B 地的,从而造成 A 地的冷空气迅速流向 B 地,同时也造成 C 地来的水汽被 B 地冷空气阻挡!也就是没有森林的情况,冷空气更容易迅速南下。 同样的道理,没有森林,本地温度会迅速升温,从而也导致上风处水汽无法输送过来,也就是说热空气一样会阻挡水汽的输送! 如果没有森林,相应本地的ρ也小,同时没有森林凝结核也少,水汽凝聚的质量 m 无法克服重力条件而降落,也即 m < m 饱 ,另外水汽即使达到饱和条件,它也很难克服重力条件降落。从我的《 水汽的水分子是如何结合的》可以知道,有凝结核的凝结的质量相当于正常凝结的质量的 6 倍,也就是 6m 。 所以只要有足够的水汽和凝结核,凝结核所凝結的水汽质量 6 倍于没有凝结核所凝结水汽的质量,他很容易大于饱和质量 m 饱 ,而形成降雨! 即: 6m ≥ m 饱 因此借助凝聚核的作用,水汽凝聚的质量可以六倍于没有凝结核的质量,即就是 6m ,这个 6m 就很容易超过饱和质量 m 饱 而降落成雨,同时大量的饱和水汽也随着降雨的带动一起沾上而下,雨就会越下越大,这时即使没有凝结核,饱和水汽也会倾盘而下。 当然海洋的生物凝结核是最多的,制造的云(含有凝结核的水汽凝结)也是最多的,但他必须不被冷空气阻断才可以到达内陆地方!但从我们上面论述可以看到,没有森林,冷空气能迅速流动,从而很容易阻断水汽流动和向内陆输送,再加上凝结核的缺少,水汽很难在内陆形成降雨!那么没有大量水汽进入内陆,就导致内陆容易出现干旱,甚至沙尘暴!同时被阻断的水汽要么改道,要么造成二地极大的浓度反差就会造成局部(特别是沿海)暴雨,甚至龙卷风和台风! 总结 从上面分析知道,沙尘,干旱,暴雨和台风最关键的是降雨,而从对流动力分析知道降雨有三种情况: 1 . 第一种 有 大量水汽 且有一定量凝结核的 暴雨或台风式 降雨 有 大量的水汽 (包括来自大量海洋水汽和本地蒸发的水汽),也就是浓度ρ高,且有 一定的凝结核 (主要来自海洋),这时大量水汽被阻而接近于饱和(湿度一般都超过 80% 以上),再加上大量带有凝结核的海洋水汽的加入导致水汽凝结的质量 m 超过饱和质量 m 饱 而降雨,这种方式的降雨一般都是暴雨,甚至台风式降雨。这种降雨一般出现在沿海地区比较多,是我们不愿意见到的,因为它容易带来灾难(台风,洪水,泥石流),而且更可怕的原因是大量海洋水汽被释放在沿海,导致内陆地区水汽不足而造成内陆出现严重的干旱或沙尘暴。 2 . 第二种 有足够的水汽和凝结核的 冷热空气交汇式 降雨 当 热空气和冷空气相交汇 时,热空气有 足够的水汽和凝结核的云 (来自于海洋生物的凝结核的云比较多),而冷空气使热空气温度降低而让相交汇的热空气达到低温时的饱和质量 m 饱 ,从而形成降雨。也就是有一定的凝结核,且有足够的水汽,且遇到低温时降雨的方式,这种方式是最多的,也是我们经常所见到的降雨,特别是缺少森林地区是唯一可以降雨的方式,也就是“靠天吃饭”。 3 . 第三种 有足够多凝结核的 森林式 降雨 当水汽 不是很足够 时(湿度不能低于 30% ),要降雨必须有 足够多的凝结核 ,而凝结核在陆地一般大部分来自于森林或者人工产生,也就是满足 6m 大于 m 饱 的降雨条件才能降雨 。而森林却是最自然的,而且随时随地都可能留住水汽。这种情况最多的是森林丰富的地区(各地的自然保护区),森林地区自成一体的成为局部气候条件。而一旦自然保护区失去森林,这些地方就只能依靠“老天”降雨的方式,也就是第二种降雨的方式,否则这些地区就只能出现干旱,甚至沙尘。 这个云南是最明显的例子!孟加拉湾上来的水汽(从孟加拉湾,印度东部和缅甸)很容易切断南下云南的冷空气,从而使得云南很难受冷空气的侵袭,让云南常年温暖,但没有冷空气同时也没有冷热交汇也就很难有第二种降雨方式!一旦云南地区森林被破坏,连第三种降雨方式也失去,云南干旱就不可避免! 2011-11-13 初稿于沈阳 2012-2-18 修正于沈阳
Global Warming May Increase the Capacity of Trees to Store Carbon ScienceDaily (May 25, 2011) — One helpful action anyone can take in response to global warming is to plant trees and preserve forests. Trees and plants capture carbon dioxide during photosynthesis, thereby removing the most abundant greenhouse gas from the atmosphere and storing some of it in their woody tissue. http://www.sciencedaily.com/releases/2011/05/110525120050.htm Yet global warming may affect the capacity of trees to store carbon by altering forest nitrogen cycling, concludes a study led by Jerry Melillo of the Marine Biological Laboratory (MBL), published recently in Proceedings of the National Academy of Sciences . The paper summarizes the results of a 7-year study at Harvard Forest in central Massachusetts, in which a section of the forest (about one-quarter of an acre) was artificially warmed about 9 o F above ambient, to simulate the amount of climate warming that might be observed by the end of the century without aggressive actions to control greenhouse gas emissions from fossil-fuel burning and deforestation. The study confirmed, as others have, that a warmer climate causes more rapid decomposition of the organic matter in soil, leading to an increase in carbon dioxide being released to the atmosphere. But the study also showed, for the first time in a field experiment, that warmer temperatures stimulate the gain of carbon stored in trees as woody tissue, partially offsetting the soil carbon loss to the atmosphere. The carbon gains in trees, the scientists found, is due to more nitrogen being made available to the trees with warmer soil. "Tree growth in many of the forests in the United States is limited by the lack of nitrogen," Melillo says. "We found that warming causes nitrogen compounds locked up in soil organic matter to be released as inorganic forms of nitrogen such as ammonium, a common form of nitrogen found in garden fertilizer. When trees take up this inorganic nitrogen, they grow faster and store more carbon." Melillo says that the biological processes that link soil warming, increased soil organic matter decay, increased nitrogen availability to trees, and increased tree growth will likely operate together in many temperate and boreal forests -- forests found in North America, Europe, Eurasia and much of the developed world. Tree growth in tropical forests is often limited by factors other than nitrogen, so lessons from this new study are not widely relevant in the tropics. While Melillo thinks that the carbon-nitrogen interactions he is studying at Harvard Forest will help us to make predictions of carbon storage in forest over the coming decades, he adds that "the carbon balance of forest ecosystems in a changing climate will also depend on other factors that will change over the century, such as water availability, the effects of increased temperature on both plant photosynthesis and aboveground plant respiration, and the atmospheric concentration of carbon dioxide." Story Source: The above story is reprinted (with editorial adaptations by Science Daily staff) from materials provided by Marine Biological Laboratory . Journal Reference : Melillo, J., Butler, S., Johnson, J., Mohan, J., Steudler, P., Lux, H., Burrows, E., Bowles, F., Smith, R., Scott, L., Vario, C., Hill, T., Burton, A., Zhouj, Y, and Tang, J. Soil warming carbon-nitrogen interactions and carbon-nitrogen budgets . PNAS , May 23, 2011 DOI: 10.1073/pnas. 1018189108
据《环境科技》(Environ. Sci. Technol.)网站2011年4月7日公布的美国9所大学与美国橡树林国家实验室以及沙漠研究所的科学家共同合作完成的研究结果,对横跨美国大陆的14个森林土壤中的Hg含量进行研究后发现,美国北部森林土壤中含Hg量竟然达到南部的森林土壤中含Hg量的16倍( Environ. Sci. Technol., DOI: 10.1021/es104384m )。根据美国环境保护署的透露,每年进入大气层的汞在5000 t到8000 t之间。而自然的来源如火山喷发等仅是其中很少一部分,大多数是来源于工业生产,特别是燃煤发电厂。排向大气层的汞有些会迁入森林,因为森林中的树木、落叶层以及土壤均会吸收汞。因此森林已经成为自工业革命以来,一直在富集着排向大气层的汞元素。正是因为如此,科学家怀疑在全球范围内,森林对大气层汞的富集可达数十万吨,但是研究人员对其汞的地理分布知之甚少,更为令人担忧的是随着气候变暖,是否会导致汞的循环加快,使更多的汞进入到大气层。科学家们希望了解汞的迁移规律,因为它完全可能从大气中或从森林土壤层进入水体,最终在水生食物链中富集。沙漠研究所的 Daniel Obrist 领导的研究小组对横跨美国大陆的14个森林,每个森林中收集12个土样,在实验室里,采用冻干、粉碎后分析其样品中的汞和碳含量。研究人员发现,总的来说,高纬度森林土壤中汞含量较低纬度的更高一些。例如,来自美国缅因州Howland森林土壤中汞平均浓度是美国佛罗里达州盖恩斯维尔(Gainesville, Fla.)森林土壤中汞含量的17倍。根据这种分析结果研究人员认为,低纬度由于日光照射充足,导致其更多的汞蒸发,这可能会导致其在土壤中滞留期缩短,而高纬度地区气温较低,甚至有些地区气候终年严寒,被吸附而富集的金属汞不易挥发,导致汞含量高也是在预料之中。关于汞与碳含量的关系,科学家发现碳含量越高,则汞浓度也较高,这可能因为汞常与有机分子结合,所以说高碳水平可能有助于解释为什么在美国北部森林土壤含有更多的汞。美国佛罗里达大学生物系博士后Sue Natali认为,在凉爽的气候条件下,有机质分解缓慢,这可能使汞积累在土壤中,但是气候变化完全有可能扰乱这种格局。不断上升的气温可能会使有机物分解率加速、使汞逸出逃到大气中,并且最终将可能造成水体污染。这个过程是一种值得特别关注的过程,因为北纬地区气候变暖速度要快于世界其他地方。研究人员同时指出,在这个问题上应该继续深入研究,他们也承认他们拥有的实验数据非常有限。 更详细的信息请浏览: Mercury Distribution Across 14 U.S. Forests. Part I: Spatial Patterns of Concentrations in Biomass, Litter, and Soil s
四个素不相识的人组成了一个团队,参加4月在Taupo举办的100公里慈善行。四个人里,有两个来自葡萄园,一个刚大学毕业(室内设计),一个生物工程研究人员。团队名字叫'Strangers in the Night'。这个周末是第一次模拟训练,在Riverhead森林越野. 四个人里只有我有空参加。是一次很好的练兵,体会一下越野的滋味。这是营地。 有的队连续两天拉练,已安营扎寨: 注册点: Oxfam的人介绍路途特征,Oxfam的宗旨: 下午分三批出发,3:30, 4:30, 5:30, 看各个队期望有多长时间夜间行军而定。我一个人当然不想夜间行(后来才知这是个多么正确的决定!)3:32分出发。 先大路爬坡,这种路属于最好走的。 一边10公里跑,另一边32,22公里越野,不要走错: 伐木与成木: 这是艰苦行军前的最好风景:在山顶一览众山小。 马上转入真正的森林道路。 原来我们行走的trail也是山地自行车(MB)的trail,而MB上午刚举办过比赛,虽然天没下雨(谢天谢地),有些路段也非常泥泞。 一不小心就会陷入泥潭,苦不堪言。我就一脚踩入泥水,滑倒,看我的手,及右下的一点血迹: 甚至没办法通过,有地方一定要淌水。还有个水塘,也是完全把路阻断。注意:我们是第一批行军,还有很多人是在夜间通过这些路段,全靠头灯! 大概有2/3的路在森林里,参天大树: 在森林转苦了,忽然看到: 真美啊: 视野开阔,这些路也很享受: 饮水也是问题。只带了600ML水,对水站不熟,不知有无供应,什么时候供应,所以省着喝。行走了两个小时已经dehydrated,才第一次喝水。还想如何把剩下的水留到6:30喝。下午天热,正是口干舌燥,撑不住时,看到: 觉得工作人员像天使一样:) 水太重要了! 她告诉已经走了12公里,用了两个小时二十分钟: 后半段虽然也有难过的路段,但泥泞路少了,这就好。这是后半段最美的风景: 跟另一组团队共同走了好几公里: 4个小时45分钟后终于到达营地,天已暗。谢天谢地没有在黑夜行军,但Oxfam就必须这样了。 走完后我的鞋袜: Course Description: With milling going on in some parts close to the base we’ll take you all the way up Barlow Road to start with (sorry about that, but don’t worry 95% of the trails are still there, and they are looking great!). Once you have made the trek up Barlow road, you’ll go left on to Trig Road for a minute or two before jumping into a cool little track off Trig Road. For the next 4km’s from this point you will generally be heading down! And we guarantee you will love this section of fast hard packed trails linked by very short gravel sections. You will then have a short climb before getting to you first drinks station. A really nice native section follows, you will enjoy this! And from there you can really get into your work on the flat trail’s and roads that follow for the next few km. Once off Campbell Road the ‘out the back loop’ is a wicked combination long downhill’s, a couple of short sharp uphill’s, and some magic view’s!! Once you pass your third drinks station, it’s a nice and flat last km or two back to base!
Strategies for Increasing Carbon Stored in Forests and Wood "Several strategies for offsetting carbon emissions have been proposed or are currently being implemented in the U.S.," says Mike Ryan from the United States Department of Agriculture, Forest Service and lead author of the paper. "Some of the important tradeoffs are worth mentioning because many people have viewed forests as a simple and uncomplicated partial solution to reducing CO2 in the atmosphere, and they are not." Mike Ryan and colleagues discuss eight strategies being used or proposed in the U.S., and the risks, uncertainties and tradeoffs of each. These include avoiding deforestation, afforestation (planting or replanting forests), decreasing harvests, increasing the growth rate of existing forests, using biomass energy from forests to reduce carbon emissions, using wood products in place of concrete or steel for building materials, implementing urban forestry and using fuel management to reduce fire threats. The tradeoffs of these strategies need to be taken into account accordingly. By reducing harvests, avoiding deforestation or afforestation, for example, we could increase the amount of forest carbon in the U.S. But the demand for forest products would still remain, so tree harvesting or other current land use may move to other areas, canceling out the carbon benefit to the atmosphere of the changes in the U.S. "The numbers are daunting because our fossil fuel use is so large," says Ryan. "Take increasing the use of wood for biomass energy: In order to offset just 10 percent of our fossil fuel use, we would need to harvest all of the annual forest production of U.S. forests. This practice also would lower the long term effects of carbon stored in forests." "To offset another 10 percent of our fossil fuel use with tree planting would require planting trees on one-third of our agricultural land," says co-author Robert B. Jackson from Duke University. These strategies are not yet cost effective and would require a price on carbon, regulation or incentives to succeed, say the authors. Another risk in relying on forests to lower atmospheric CO2 is that climate change may reduce carbon stored in forests by increasing fires, storms and insect outbreaks. "So, we need to make sure we focus on retaining the forests we have by making sure we get tree regeneration after these disturbances," says Ryan. The authors review these methods, and the cycle of forest growth, death and regeneration, and the use of wood removed from forests and how it ties into measuring carbon pools and flows. They also analyze the processes of measuring forest carbon and the science behind mechanisms proposed for increasing the amount of carbon stored in forests. "This topic could not be more relevant," says Jill Baron, Editor-in-Chief of Issues in Ecology. "The need for biological carbon storage is ever apparent, but the methods for making the most of our forest stores while not reducing other important forest ecosystem services are still underexplored. This paper, like future Issues in Ecology, provides a synthesis of the current scientific research and understanding on the topic. It should be on the desk of anyone interested in how to minimize the effects of climate change, and certainly anyone assigned with mitigating climate change through forest carbon storage." "A Synthesis of the Science on Forests and Carbon in U.S. Forests" is published in the spring 2010 edition of Issues in Ecology, a publication of the Ecological Society of America reporting the consensus on a specific issue from a panel of experts. This report, along with past and future issues, is available online at http://esa.org/science_resources/issues.php.
题目 Nutrient Cycling and Limitation: Hawai'i as a Model System 作者 Peter M. Vitousek 获奖 Winner of the 2005 Marsh Ecology Book of the Year Award, British Ecological Society 出版信息 Paper | 2004 | $52.00 / 35.95 232 pp. | 6 x 9 | 10 halftones. 84 line illus. 18 tables. 介绍 The availability or lack of nutrients shapes ecosystems in fundamental ways. From forest productivity to soil fertility, from the diversity of animals to the composition of microbial communities, nutrient cycling and limitation are the basic mechanisms underlying ecosystem ecology. In this book, Peter Vitousek builds on over twenty years of research in Hawai'i to evaluate the controls and consequences of variation in nutrient availability and limitation. Integrating research from geochemistry, pedology, atmospheric chemistry, ecophysiology, and ecology, Vitousek addresses fundamental questions: How do the cycles of different elements interact? How do biological processes operating in minutes or hours interact with geochemical processes operating over millions of years? How does biological diversity interact with nutrient cycling and limitation in ecosystems? The Hawaiian Islands provide the author with an excellent model system for answering these questions as he integrates across levels of biological organization. He evaluates the connections between plant nutrient use efficiency, nutrient cycling and limitation within ecosystems, and nutrient input-output budgets of ecosystems. This book makes use of the Hawaiian ecosystems to explore the mechanisms that shape productivity and diversity in ecosystems throughout the world. It will be essential reading for all ecologists and environmental scientists. Reviews: work began by understanding the interactive controls over nutrient limitation after forest disturbance. In Nutrient Cycling and Limitation , Vitousek explores this theme on a grand canvas, basing it on his own work and that of a small army of students and collaborators. . . . This book will reward reading and re-reading, and is an excellent introduction to biogeochemical ecology for those coming from other fields of science.--David Schimel, Nature One of the most impressive aspects of Nutrient Cycling and Limitatio is the scope of the material it covers, and the extent to which the material is integrated to provide a truly ecosystem-level overview, that is itself placed neatly within a global context. . . . he book provides a wide-ranging and authoritative coverage of a crucial topic.--Graeme Hastwell, Austral Ecology Peter Vitousek's Nutrient Cycling and Limitation makes an important contribution to the field of biogeochemistry. . . . excellent book. . . . Nutrient Cycling and Limitation is essential reading for students and scientists interested in terrestrial biogeochemistry. It is a model of good science writing and a crisp and clear introduction to some of the big ideas that intrigue ecosystem ecologists.--Jerry Melillo, Bioscience Endorsement: Peter Vitousek is tied closely to the 'aina--the land--of Hawaii, both by birth and by the successful scientific career he has nurtured over the past two decades. His personal, and sometimes passionate, presentation sweeps across habitats, across phyla and across disciplines. It is an authoritative account of his research and his vision.--David M. Karl, University of Hawaii 图书内容 TABLE OF CONTENTS: List of Tables xi List of Figures xiii Preface xix Chapter One: Introduction 1 Chapter Two: The Hawaiian Islands as a Model Ecosystem 6 Model Systems 6 Microcosms and Well-studied Systems 8 A Brief Natural History 9 The Formation of the Hawaiian Islands 9 Determinants of Climate 15 Isolation 19 Evolution, Conservation, and Culture 20 Evolution and Speciation 20 Conservation Biology 22 Cultural Evolution 22 Chapter Three: Gradients in Environmental Factors, Gradients in Ecosystems 24 The State Factor Framework 24 Environmental Gradients as Model Systems 26 Temperature 27 Precipitation 29 The Mauna Loa Matrix 30 A Substrate Age Gradient across the Hawaiian Islands 31 Age Control 35 Climate History 35 Basic Features of the Gradient 39 Chapter Four: Patterns and Processes in Long-term Ecosystem Development 42 A Theory for Nutrient Dynamics during Ecosystem Development 42 Biogeochemical Processes on the Substrate Age Gradient 45 Soil P Pools 45 C and N Pools 45 Available Nutrients 46 Foliar Nutrients 49 Forest Productivity 51 Efficiencies of Resource Use 53 Decomposition and Nutrient Regeneration 59 Soil Organic Matter Turnover 66 Plant-Soil-Microbial Feedbacks 66 Chapter Five: Experimental Studies of Nutrient Limitation and the Regulation of Nutrient Cycling 70 Fertilization Experiments 71 Nutrient Limitation 74 Nutrient Availability and Plant-Soil-Microbial Feedback 78 Tissue Nutrient Concentrations 78 Productivity 78 Resource Efficiencies 79 Decomposition 84 Nutrient Regeneration 87 Controls of Plant-Soil-Microbial Feedback 87 Chapter Six: Nutrient Inputs to Hawaiian Ecosystems: Pathways, Rates, and Controls 92 Inputs of Elements 92 Weathering 93 Concepts and Definitions 93 Approaches 94 Element Inputs via Weathering 97 Atmospheric Inputs 98 Background 98 Deposition Measurements 100 Inputs of Water 101 Nitrogen Inputs 101 Influence of an Active Volcano 102 Inputs of Other Elements 103 Long-Distance Dust Transport 105 Background 105 Methods 105 Element Inputs 106 The Fate of Dust 107 Biological N Fixation 109 Background 109 Approach 109 Rates of Fixation 110 Other Inputs 110 Combined Inputs by All Known Pathways 111 Strontium Isotopes: A Direct Test of Input Pathways 112 Chloride and Sulfate 114 Mobile Cations 114 Silicon and Aluminum 116 Nitrogen and Phosphorus 117 Chapter Seven: Nutrient Outputs: Pathways, Controls, and Input-Output Budgets 121 Output Pathways 122 Leaching 122 N-Containing Trace Gases 124 Erosion 126 Other Pathways of Loss 126 Rates and Controls of N and P Losses 128 Input-Output Budgets 133 Budget Calculations 134 Using These Element Budgets 142 Chapter Eight: Issues and Opportunities 143 Interactions of Time Scales 143 An Exploratory Model 143 Supply versus Demand 144 Plant-Soil-Microbial Feedbacks 146 Sources and Sinks 148 Inputs and Outputs 150 Interactions across Scales 152 The Regulation of Nutrient Inputs and Outputs 154 Demand-Independent Pathways of Element Loss 155 Implications of Demand-Independent Nutrient Losses 159 Stoichiometry and Flexibility 160 Within-System Element Cycling 162 Inputs and Outputs 169 Biological N Fixation 173 Differences in Populations, Species, and Diversity 177 Biological Differences and Ecosystem Functioning 177 Diversity and Ecosystem Functioning 184 Three Final Points 188 References 191 Index 219
 标签: 森林


![[转载]森林是这样控制水汽输送的](http://image.sciencenet.cn/album/201204/06/21474974yj1t5jjydj5j2q.jpg.thumb.jpg)