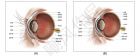
电子显微镜能使科学家看单个原子 康奈尔大学( Cornell University )的研究人员借助电子显微镜使科学家们能够看到单个原子,但即使在这个分辨率下,并非所有的东西都是清晰的。更多信息请注意浏览 康奈尔大学( Cornell University ) Tom Fleischman 2018年7月19日 为物理学家组织网提供的相关报道以及发表于《自然》( Nature )杂志的研究论文,为了便于阅读特将 Tom Fleischman撰写的相关报道 摘引于下,仅供阅读参考。 Electron microscope detector achieves record resolution July 19, 2018 by Tom Fleischman, Cornell University A ptychographic image of two sheets of molybdenum disulfide, with one rotated by 6.8 degrees with respect to the other. The distances between individual atoms range from a full atomic bond length down to complete overlap. Credit: Cornell University Electron microscopy has allowed scientists to see individual atoms, but even at that resolution not everything is clear. The lenses of electron microscopes have intrinsic imperfections known as aberrations, and special aberration correctors – like eye glasses for your microscope , said David Muller, the Samuel B. Eckert Professor of Engineering in the Department of Applied and Engineering Physics (AEP) – have been developed over the years to correct these defects. Aberration correctors only go so far, however, and to correct multiple aberrations, you need an ever-expanding collector of corrector elements. It's like putting glasses on glasses on glasses – it becomes a bit unwieldy. Muller – along with Sol Gruner, the John L. Wetherill Professor of Physics, and Veit Elser, professor of physics – have developed a method for achieving ultra-high resolution without the need for corrective lenses for their microscope. They've employed their Cornell-developed electron microscope pixel array detector (EMPAD), which was introduced in March 2017. With it they've achieved what Muller, co-director of the Kavli Institute at Cornell for Nanoscale Science, said is a world record for image resolution – in this case using monolayer (one-atom-thick) molybdenum disulfide (MoS2). Their achievement is reported in Electron Ptychography of 2-D Materials to Deep Sub-Ångström Resolution, to be published July 19 in Nature . Co-lead authors were Yi Jiang, Ph.D. '18 (physics) and Zhen Chen, postdoctoral researcher in the Muller Group. Electron wavelengths are many times smaller than those of visible light, but electron microscope lenses are not commensurately precise. Typically, Muller said, the resolution of an electron microscope is dependent in large part on the numerical aperture of the lens. In a basic camera, numerical aperture is the reciprocal of the f-number – the smaller the number, the better the resolution. In a good camera, the lowest f-number or f-stop might be a little under 2, but an electron microscope has an f-number of about 100, Muller said. Aberration correctors can bring that number down to about 40, he said – still not great. Image resolution in electron microscopy has traditionally been improved by increasing both the numerical aperture of the lens and the energy of the electron beam, which does for the microscope what light does for a camera or an optical microscope – illuminates the subject. Previous records for resolution were achieved with an aberration-corrected lens and super-high beam energy – 300 kiloelectronvolts (keV) – to obtain sub-ångström resolution. Atomic bonds are generally between 1 and 2 ångströms (Å) long – an ångström is 0.1 nanometers – so sub-ångström resolution would allow one to easily see individual atoms. The Muller group was able to reach a resolution of 0.39 Å – a new world record – and at a lower, less damaging beam energy where resolution from the aberration corrected lenses alone was 0.98 Å. Muller's group used the EMPAD and a technique known as ptychography: As the electron beam scans the sample, the detector collects both full-position and momentum distributions of the scattered electrons in overlapping steps. The image is reconstructed from the resulting 4-dimensional data set. The group used a beam energy of just 80 keV so as not to destroy the MoS2. Despite the low beam energy , the resolution using EMPAD is so good, the microscope is able to detect with startling clarity a missing sulfur atom – a defect in the lattice, Gruner said – in a 2-D material. That's astounding to me, he said. With a resolution capability smaller than the smallest atomic bond, a new test object for the EMPAD method was needed. Yimo Han, Ph.D '18, and Pratiti Deb '16, from Muller's group, stacked two sheets of MoS2, one sheet slightly askew, so that atoms from the two sheets were visible at distances ranging from a full bond length apart to lying on top of each other. It's essentially the world's smallest ruler, Gruner said. The EMPAD, which has been retrofitted on microscopes across campus, can record a wide range of intensities – from detecting a single electron to intense beams containing hundreds of thousands or even a million electrons. The analogy I like to use is, a car is coming at you at night, Gruner said. And you're looking at the lights coming at you, and you're able to read the license plate between them without being blinded. Explore further: New electron microscope sees more than an image More information: Yi Jiang et al. Electron ptychography of 2D materials to deep sub-ångström resolution, Nature (2018). DOI: 10.1038/s41586-018-0298-5
普通光学显微镜的分辨率极限只有 ~200 nm ,在应用方面显得越来越不足。为了突破这一限制,发展了单微发光体光学超分辨成像技术,其原理是通过精确地得到众多单个微小发光体(如单个荧光分子)的位置来进行成像,分辨率约几十 nm ,甚至可小于 1 nm 。当有荧光分子参与催化反应的时候,即可采用该技术研究催化活性在纳米粒子上的分布,以及动力学相关的问题。目前,该技术已经在金属纳米粒子的催化、分子筛催化、光催化等领域得到应用,且已经展现出优越的特性。 相关文献: http://www.mscatalysis.net/ 10. X. Zhou , E. Choudhary, N. M. Andoy, N. Zou, P. Chen, “Scalable Parallel Screening of Catalyst Activity at the Single-Particle Level and Sub-diffraction Resolution”, ACS Catalysis , 2013 , 3, 1448-1453. 9. Xiaochun Zhou, Nesha May Andoy, Guokun Liu, Eric Choudhary, Kyu-Sung Han, Hao Shen, Peng Chen, Quantitative Super-resolution Imaging Uncovers Reactivity Patterns on Single Nanocatalysts, Nature Nanotechnology , 2012 , 7, 237-241. 8. N. M. Andoy, X. Zhou , E. Choudary, H. Shen and P. Chen, Single-Molecule Catalysis Mapping Quantifies Site-specific Activity and Uncovers Radial Activity Gradient on Single 2D Nanocrystals, Journal of the American Chemical Society , 2013 , 135, 1845-1852
电子显微镜发展史的里程碑 诸平 据美国化学会《化学与工程新闻》(CNS)周刊网站2014年3月28日报道,科学家已经研究出新型电子显微镜,该显微镜能够观察到接近原子水平的线粒体核糖体(mitochondrial ribosome)的结构(见下图),这种显微镜发展史上具有里程碑意义的研究成果,对于结构生物学研究而言,无疑在技术支撑方面带来了革命性的新变化。下图是酵母线粒体核糖体的结构图示,与细菌核糖体(蓝色)和哺乳动物线粒体核糖体(红色)有类似的一些特性,但是有些特征只有在酵母中存在(黄色)。 Fig. 1 The structure of the yeast mitochrondrial ribosome (shown) shares some features with the bacterial ribosome (blue) and with mammalian mitochondrial ribosomes (red). Some features are present only in yeast (yellow).Credit: Alan Brown 低温电子显微镜(cryo-EM)虽然是结构生物学研究中的重要工具,但其潜力还未充分发挥出来。近期的技术进步大大提高了cryo-EM的分辨率,正在重振这一领域。在单粒子cryo-EM实验中, 大分子集合体被冷冻在一层薄薄的冰中,并用电子显微镜成像。单个集合体的数千至数百万幅图像必须经过计算机比对和合并,以获得一个三维结构。 与X射线晶体衍射相比,cryo-EM的一个明显优势就是不需要结晶,这大大拓宽了其研究领域,使生物大分子及其复合物的构象研究成为可能。运用这种方法,一些生物样品如病毒和大肠杆菌70S核糖体的三维重构图已经得到,但分辨率不是很高。 而最近英国分子生物学MRC实验室(MRC Laboratory of Molecular Biology)的科学家,他们使用单个粒子降临的cryo-EM研究酵母线粒体核糖体大亚单元的结构,0.32 nm分辨率能够使其在接近原子水平给出一个近乎完整的三维构型图像,其包括了39种蛋白质,其中有13中蛋白质是线粒体独有的,而且还有扩张的线粒体多糖体RNA(mitoribosomal RNA)片段。得到如此庞大的(3 MD即3-megadalton)生物机器近原子水平的图像,既不需要蛋白质结晶,也不需要广泛净化,所以这种分析方法被认为在电子显微镜发展史上具有里程碑意义。 这种核糖体在真核线粒体(eukaryotic mitochondria)中发现。它不同于酵母细胞质中的核糖体和其他真核生物细胞中的核糖体,也不同于细菌核糖体。由2009年诺贝尔化学奖得主万卡特拉曼•莱马克里斯南(Venkatraman Ramakrishnan)、托马斯•施泰茨(Thomas A. Steitz)和阿达•尤纳斯(Ada E. Yonath)曾经得到了核糖体三维X-射线晶体结构。新的分辨率在0.32nm的线粒体核糖体结构是由万卡特拉曼•莱马克里斯南等人合作完成。显微镜发展史上具有里程碑意义的更多信息请浏览: http://www.biodiscover.com/index.php?r=news/viewid=109096
重装Centos后,屏幕分辨率最大值远远低于实际的屏幕分辨率,因此无法通过一般命令或图形界面调整。在网上找到方法并设置成功。 参考链接: http://aaa103439.blog.163.com/blog/static/17690106720129111230424/ 主要方法(从链接地址复制,特此说明)如下: 原文: 0. telinit 3 1. remove nomodeset from kernel line in grub.conf. Just scroll to end of this line and you will see it there. 2. remove xorg.conf file ! It will load intel driver automatically 3.reboot. 译文: 0 . 执行命令 telinit 3 ,需要root权限,即退出图形界面,回到命令行界面。 1. 从文件/etc/grub.conf 的kernel行中删除“nomodeset 。只要翻到该行的末尾,就可以看到这个词。 2. 删除文件/etc/X11/xorg.conf !INTEL驱动程序会自动被加载。 3. 执行命令reboot, 重启系统。 2013/10/18 初稿 2013/10/18 为防止链接失效,复制链接中主要内容
The first document from Prof. E. Bauer on LEEM resolution 1-s2.0-0304399185901767-main Bauer LEEM resolution.pdf R. Tromp et. al. develop another one for LEEM published on Ultramicrope. 1-s2.0-S0304399111002294-main.pdf Together with Michael Altman, the predicted resolution of LEEM will be 0.5 nm. This paper is also published on Ultramicroscopy very recently.
高分辨率的激光雷达数据 将成为地形, 地貌一个重要平台和契机 受老板小口及小老板早川的邀请 , ArizonaState University, University of California, Univ. Tokyo, HiroshimaUniversity and UNAVCO, OpenTopography 大学及研究机构一些著名的学者来我们 CSIS 中心实验室访问 , 并各自做了精彩的报告 , 了解国外的一些学者研究方向 , 对自己的研究大有裨益 , 最近我也简单在做 LIDAR DEM 的相关研究 , 感觉这是一个非常有前景的方向。 激光雷达数据提供给我们亚米级别的高分辨数据,数据真有三维性及高精度的优势,特别是在人迹罕至或高密度植被覆盖的地区等传统方法不能解决的数据匮乏的地区,为我们提供一种颠覆性的解决办法,这个一数据平台和契机,是将来地学一个重要的研究领域,很有用武之地。附上报告的照片。我们中心有三台scaning lidar,有机会借用下,亲自研究下, 即使在日本也是刚刚起步,所以是一个很好的突破口。原因是:可能仪器有点贵,缺少相应的培训及流行的软件,这是一个契机。 Mike Ramon Arrowsmith (Arizona State University) Title: Tectonic geomorphology, structural geology, and paleoseismology of fault zones from high resolution topography Mike Oskin (University of California, Davis) Title: High resolution topography of active faults and topographic differencing (tentative title) Edwin Nissen (Colorado School of Mines) Title: Fault zone deformation and shallow slip from LiDAR differencing Yuichi S. Hayakawa(Univ. Tokyo) Title: Analysis of high-definition topography using TLS: waterfall, debris flow and tsunami erosion Koji Okumura (Hiroshima University) Title: A review of the mapping of faults since 1980s: plane table, TS, RTK-GPS, Lidar, and the future. Chris Crosby (UNAVCO, OpenTopography) Title: Facilitating access to high-resolution topography: Data collection support and online data distribution
深度相机Kinect 可以输出640 ×480 和320 ×240 两种分辨率的深度图像,同时也能输出红外图像或者RGB 图像( 两种图像无法同时获取) 。 Kinect 的规格说明提到,设备自带的RGB 摄像头也可以支持1280 ×1024 的图像输出, 至少维基百科是这样说的: ...the hardware is capable of resolutions up to 1280x1024 (at a lower frame rate) and other colour formats such as UYVY. The monochrome depth sensing video stream is in VGA resolution (640 × 480 pixels) with 11-bit depth, which provides 2,048 levels of sensitivity. The Kinect can also stream the view from its IR camera directly (i.e.: before it has been converting into a depth map) as 640x480 video, or 1280x1024 at a lower frame rate. 但是在OpenNI里简单地把 分辨率直接改成 nXRes=1280,nYRes=1024,nFPS=15 ,并调用下面的语句,却无法输出想要的结果。 XnMapOutputModeMyMapMode = { nXRes,nYRes,nFPS }; // 显示RGB 图像时设置输出分辨率 xn::ImageGeneratorG_RGB; G_RGB.SetMapOutputMode(MyMapMode ); 后来发现在程序里注释掉深度图像的获取和输出步骤,就可以显示了。也就是说,设备无法输出 1280 × 1024 的深度图,这样的设置会导致无法二者都无法获取。 下面例子是一个场景的深度图,分辨率为 640 × 480 ,并且用 G_Depth.GetAlternativeViewPointCap().SetViewPoint(G_RGB ); 把深度图 warp 到对应的 RGB 图像上 了。 图中的红点和数字表示该点的深度值,单位是毫米,0表示这个点没有深度数据。 下面图像显示的是对应的 640 × 480 的 RGB 图像 下面图像显示的是对应的 1280 × 1024 的 RGB 图像,可以看出图像的上下边比上图多几行内容,(博客在上传图像时改变了图像尺寸,所有图像都可以在这里下载 jpg.rar ): 切换到显示红外图像,重新编译程序,也可以输出 1280 × 1024 的红外图像。 // 在显示红外图像时对应的语句 xn::IRGeneratorG_Ir; G_Ir.SetMapOutputMode(MyMapMode ); 下面是这个场景的红外图像( 尺寸1280 ×1024) : 图像里的散乱分布的亮点,就是Kinect 用来恢复深度的结构光(Structure Light) ,这些光斑是由设备上的红外激光发射器发出的。这些古怪的pattern 用肉眼是看不到的,只能借助红外相机观察。利用红外结构光实时恢复深度,是Kinect 的技术核心,来自于一家叫Prime Sense 的以色列公司。但微软最近推出的Kinect2.0 抛弃了这种技术,取而代之的是Time Of Flight ,来自于他们前几年收购的另一家以色列公司。深度相机是基于摄影测量学中的三角测距法,根据亮点在图像中移动的位置就可以算出这点到相机的距离( 即深度) ,具体原理大家可以在网上自行搜索。 下面是分辨率切换到640 ×480 的输出,由于Kinect 输出的时候做了简单的隔点降采样,所以可以看到墙面上出现了红外激光pattern 的走样(Aliasing) 条纹,研究光学的人和摄影爱好者喜欢把它称为摩尔(Morie) 纹。为了解释这个现象,有的人还会搬出“奈奎斯特(Nyquist) ”的大名。
杂志社对投稿图片的分辨率通常有如下要求: TIFF: Colour or greyscale photographs (halftones): always use a minimum of 300 dpi. TIFF: Bitmapped line drawings: use a minimum of 1000 dpi. 第一点说的是灰度图的dpi在至少300dpi以上,比如病理图片、电泳图等; 第二点说的是点阵线性图的分辨率一般在1000dpi以上,比如用excel所作曲线或柱状图,chemdraw所画结构式等。 投稿所遇到的问题: 通常数码照片的dpi为72,而excel所作图片的dpi为200,均不能满足投稿需求,因此要更改dpi 设置 解决方法: 在photoshop新建一个A4格式的图片,在图片大小选项中将分辨率选为杂志所需的分辨率(比如1000ppi,这里可能又涉及到一个ppi和dpi的概念,其实你不用多管,简单说来,一个相当于电脑屏幕的输出(ppi),一个相当于打印机的输出(dpi),你只要ppi设为1000,打印的分辨率就为1000dpi,两者在数值上是等量的)。将excel或照片直接粘贴到新建图层中(注意,这是的图片显示的可能会很小),将图片放大到适合观看的大小,剪切所需区域,如果杂志社对图片大小有要求可以通过图片大小选项设定(例如5cm*3cm),保存为tiff格式,将保存layer前的对钩去掉,确定,采用LZW压缩,确定,即可。这样保存的图片大约为200k. dpi增大的优点: 通常我们用excel作的图贴到word或直接保存为图片,会发现,图片缩小会比较清初,但是放大后遍模糊 将 dpi增大后,虽然缩小图片感觉不如直接保存清初,但是你放大很多倍后图像仍清晰 如果原图是用“Origin”做的曲线图, 按照要求“1200 dpi (dots per inch) for black and white line art (simple bar graphs, charts, etc.)”的要求修改过程如下: (1)将所做的图用程序“Origin” (如OriginPro 7.5)打开; (2)点击菜单”File” “Export Page..” 在“保存类型”中选“Tag Image File(*.tif)”,同时在 “Show Image Options”前打勾 , 确定“保存”; (3)在TIFF Options窗口中,“DIP” 设为1200;“Color Depth” 选Monochrome;“Compression” 选LZW,最后点击“OK”即可。 (4)将所得的TIF格式图片用Photoshop打开,在菜单“图像” , “图像大小”中确认 “分辨率”为1200象素/英寸,将“宽度”设定为6000像素左右;点击“好”。 (5)“文件” , “存储为” , “格式”选为“TIFF” , ”保存“;在”图像压缩“中选”LZW“; 点击”好“;就可获得满足杂志要求的图片了! 如果图片是JPG等照片,如电镜照片等, 300 dpi for halftones (black and white photographs) 600 dpi for combination halftones (photographs that also contain line art such as labeling or thin lines) 按照上面的任一个要求,处理如下: (1)图片用Photoshop打开,在菜单“图像”中的 “图像模式” 中选择“灰度”(用于黑白图片)或者“CMYK”(用于彩色图片) (2)在“图像”中的“图像大小”设定“分辨率”为600(或300)象素/英寸,将“宽度”设定为3000像素左右;点击“好”。 (3)“文件” “存储为” “格式”选为“TIFF” ”保存“;在”图像压缩“中选”LZW“; 点击”好“;就可获得满足杂志要求的图片了! 以上信息来源于http://soft.cnzer.cn/view-30193-2.html
论 文写完之后,要严格自查并/或找一位同事评价一下,尽可能确保文章具有很强的科学性和良好的撰写方式,然后就可以投向目标期刊了。此时你应该已经挑选出最 合适的期刊,并已经写出一份有说服力的投稿信给编辑。检查目标期刊的《稿约》,确保遵循了所有要求;如果没有,那就要在投稿前做相应改正以免将来造成延 误。其中包括稿件和所有插图都保存为正确格式和所要求的分辨率。 多数期刊鼓励在线投稿,这通常需要在目标期刊注册一个投稿帐户。这是一个分步过程,通常要求输入全名、单位地址、最高学位和所有作者的详细联系信息(不仅是通讯作者)。注册之后,投稿作者把所有相关文件(包括正文、投稿信、插图文件和补充材料)上传到期刊的网上投稿系统。 一 些期刊规定以邮递方式投稿,要求提交规定数量的论文打印件和含所有文件的光盘。通常每个作者都要签署声明表示同意向杂志投稿并在论文上署名,不过有些杂志 现在也通过电子邮件进行确认。投稿过程中可能需要交纳投稿费,但是大多数情况下出版费都是论文被录用之后才会征收。任何从已发表的文献中转载插图或其他内 容都要获得许可,有时在投稿时杂志社就会要求你提交此类许可证明。若论文被录用,论文的版权就要转让给出版商;有时,在投稿时就要填写一份版权转让表。 投 稿过程有时允许你推荐或排除潜在的论文审稿人。如果没有这个过程,你也可以在投稿信中推荐或排除。期刊编辑会尽力任命独立专家为审稿人,但也知道许多领域 的实验室之间存在激烈竞争。他们很清楚:你尚未公开发表的数据具有敏感性,把它交给直接竞争对手有可能不合适。所以,他们愿意知道谁可能是“友好的”审稿 人,谁可能不那么友好。编辑们几乎肯定不会只任命你推荐的审稿人或排除所有你请求排除的人。他们会用你提供的信息来客观地决定谁应该和不应该审读你的稿 件。 在选择哪些专家可列入“推荐审稿人”时,你应该考虑那些你论文所赞成的研究或观点的作者;比如,若你的工作基于之前发表的一篇文献并发展或确 认了其结果,则该文献的资深作者就是好的候选人。你的参考文献可以帮你找出这些候选人,仔细阅读他们的论文就能知道他们的观点是否与你相符或相反。在理想 状态下,你的研究发现能支持你所推荐的本领域资深研究者所提出的观点。相同领域内的国际合作者也可成为“友好的”审稿人,不过如果你们之前共同发表过论文 可能会被编辑以偏向性理由排除。 确定谁应该被排除出审稿人行列要更为困难。但是,如果你知道有另一实验室在做同样的工作(也许你在最近召开的一次 会议上听过该实验室成员做的报告或张贴的壁报),就可以请编辑把该实验室的主要研究者排除出审稿人行列。此外,也要请编辑把观点或假设与你相反的研究者排 除在外。 当然,期刊会要求任何审稿人完全客观地评议你的稿件。而且,编辑也会在一定程度上评估你的稿件来判断审稿人的意见是否公正。如果收到的审 稿意见完全相互矛盾(如一个非常正面,另一非常负面),编辑可能会再找一个审稿人来评议直至对审稿意见满意,这会推迟你投稿的决定意见。归根结底,只要研 究的设计和实施都没有问题,结果有新颖和有趣之处,行文清楚简洁并符合《稿约》,你的论文就有最大的机会能逾越这些障碍并最终被录用。 英文原文: Submitting your paper: final checks If you have written your paper, critically self-evaluated it and/or asked a colleague to evaluate it, and believe it to be as scientifically robust and well written as possible, you are ready to submit it to your target journal. You should by now have selected the most appropriate journal for your paper and written a convincing cover letter to the editor. Check that all of the instructions in the target journal’s Guide for Authors are complied with—if any are not, then these should be addressed before the paper is submitted or they could cause delays later on. This includes ensuring that the manuscript and any figure files are saved in the appropriate file format and of the requested resolution. Most journals encourage online submission, which usually requires registering with the target journal and setting up a submission account. This is a step-by-step procedure in which details such as full names, departmental addresses, highest degrees awarded and full contact information for all authors, not just the corresponding author, are usually requested. Following registration of an account, the submitting author will be able to upload all relevant files, including manuscript file, cover letter, separate figure files and any supplementary material files, to the journal’s online submission system. Some journals request submission by post, which requires posting the requested number of identical printed copies of the manuscript along with an electronic copy of all files on a CD. Frequently, each author is required to sign a declaration agreeing to the submission to the journal of a paper bearing their name, although some journals now verify this by e-mail. During the submission process, there might be a requirement to pay any submission costs, although publication costs are not usually requested until after a manuscript is accepted. Any figures or other content that are being reproduced or modified from previously published work will require the appropriate permissions, and these are sometimes requested at the time of submission. If a manuscript is accepted, the copyrights to the manuscript will need to be transferred to the publisher; the relevant forms for copyright transfer are sometimes made available during the submission process. The submission process sometimes allows you to recommend or exclude potential reviewers of your manuscript. If not, it is usually worthwhile doing so in your cover letter. The journal editors will try to appoint independent experts as reviewers, but will also be aware that many fields are intensely competitive among labs. They will also appreciate that your unpublished data needs to be treated sensitively, and that it might not be appropriate to put that in the hands of a competitor working on the same thing. Thus, it will help them to know who might be a ‘friendly’ reviewer and who might be less friendly. The editors will almost certainly not appoint only the reviewers you suggest and exclude all those you ask to be excluded, but they will use the information you provide to make an objective decision about who should and who should not review your paper. In choosing who to recommend as a potential peer reviewer, you should consider any researchers whose hypotheses and ideas your work supports; for example, if your work builds on previously published work, extending or confirming the findings of that work, then the senior author(s) on such a study would likely be a good candidate reviewer. A look through your reference list will help you to identify such candidates, and reading their papers closely will give you an idea of whether their thoughts are in line with your own, or perhaps opposed to them. Ideally, recommend senior researchers in the field who have propounded ideas that would be supported by the findings of your study. International collaborators in the same field also represent potential ‘friendly’ reviewers, although if you have previously co-published work with those researchers the journal editors might exclude them for potentially being bias. Working out who to exclude can be more difficult, but if you know that some other lab is working closely on the same thing, perhaps because you have seen researchers from that lab speak or present a poster at a recent meeting, it would be a good idea to ask the editors to exclude the Principle Investigator of that lab as a candidate reviewer. Also ask the editors to exclude researchers whose hypotheses or ideas are known to run counter to those suggested in your manuscript. Of course, any reviewers that are appointed will be asked to be completely objective in their assessment of your manuscript. Moreover, the editors will also be able to assess your manuscript to some degree and identify if the points raised by the reviewers are fair or not. If completely polarized reports (for example, one very positive and one very negative) are received, the editors may choose to appoint additional reviewers and delay a decision on your manuscript until they are satisfied with the reports they receive. Ultimately, if you have designed and executed your study well, show something novel and interesting, and written a clear and concise manuscript complying with the instructions for authors, you will have maximized your chances of getting over the final hurdle before acceptance. Dr Daniel McGowan 分子神经学博士 理文编辑学术总监
《Nature》2012.09.06 扩充的人类调节DNA组库容量编码在转录因子足迹中 来自美国华盛顿大学领衔的研究小组报道了41种细胞和组织中DNase I足迹,揭示了成百上千万的编码DNA结合蛋白保守识别序列的短序列元件。 -2012年9月6日《自然》 中文翻译 ________________________________________ 【题目】扩充的人类调节DNA组库容量编码在转录因子足迹中 【译文】结合在基因组DNA上的调控因子保护潜在的序列以防被DNase I切割,进而形成核苷酸水平分辨率的足迹。在41种细胞和组织中利用基因组DNase I足迹分析,我们检测了不同调控区中4500万转录因子占有事件,这些调控区代表了840万不同短序列元件的不同结合。本研究表明这种小的基因组序列间隔,大约是外显子的两倍大小,编码了很大部分DNA结合蛋白保守识别序列,这些序列大约是人类顺式调控元件数量的两倍。我们发现影响等位基因染色质状态的遗传突变体在足迹中比较密集,这些元件优先地被DNA甲基化所保护。 高分辨率DNase I剪接模式反映了核苷酸水平的进化保守性,并示踪了蛋白-DNA作用表面的结晶结构,这表明转录因子结构已经在进化上被标记在人类基因组序列上了。我们鉴定了一种50碱基对的足迹,这种足迹可以清晰地界定成千上万人类启动子中转录本起源的位点。最后,我们描述了大量调控因子识别基序,它们在序列和功能上高度保守,并表现出细胞选择性占有模式,该模式类似于发育、分化和多潜能性的主要调控因子。 英文原稿 ________________________________________ : An expansive human regulatory lexicon encoded in transcription factor footprints :Shane Neph,1, 7 Jeff Vierstra,1, 7 Andrew B. Stergachis,1, 7 Alex P. Reynolds,1, 7 Eric Haugen,1 Benjamin Vernot,1 Robert E. Thurman,1 Sam John,1 Richard Sandstrom,1 Audra K. Johnson,1 Matthew T. Maurano,1 Richard Humbert,1 Eric Rynes,1 Hao Wang,1 Shinny Vong,1 Kristen Lee,1 Daniel Bates,1 Morgan Diegel,1 Vaughn Roach,1 Douglas Dunn,1 Jun Neri,1 Anthony Schafer,1 R. Scott Hansen,1, 2 Tanya Kutyavin,1 Erika Giste,1 Molly Weaver,1 Theresa Canfield,1 Peter Sabo,1 Miaohua Zhang,3 Gayathri Balasundaram,3 Rachel Byron,3 Michael J. MacCoss,1 Joshua M. Akey,1 M. A. Bender,3, 4Mark Groudine,3, 5 Rajinder Kaul1, 2 John A. Stamatoyannopoulos1, 6 et al. :Regulatory factor binding to genomic DNA protects the underlying sequence from cleavage by DNase I, leaving nucleotide-resolution footprints. Using genomic DNase I footprinting across 41 diverse cell and tissue types, we detected 45 million transcription factor occupancy events within regulatory regions, representing differential binding to 8.4 million distinct short sequence elements. Here we show that this small genomic sequence compartment, roughly twice the size of the exome, encodes an expansive repertoire of conserved recognition sequences for DNA-binding proteins that nearly doubles the size of the human cis–regulatory lexicon. We find that genetic variants affecting allelic chromatin states are concentrated in footprints, and that these elements are preferentially sheltered from DNA methylation. High-resolution DNase I cleavage patterns mirror nucleotide-level evolutionary conservation and track the crystallographic topography of protein–DNA interfaces, indicating that transcription factor structure has been evolutionarily imprinted on the human genome sequence. We identify a stereotyped 50-base-pair footprint that precisely defines the site of transcript origination within thousands of human promoters. Finally, we describe a large collection of novel regulatory factor recognition motifs that are highly conserved in both sequence and function, and exhibit cell-selective occupancy patterns that closely parallel major regulators of development, differentiation and pluripotency. 原文地址 http://www.nature.com/nature/journal/v489/n7414/full/nature11212.html Tags: NATURE nature-2012-09-06 短序列元件 调控因子 足迹 转录因子 http://m.bioku.cn/201210/nature-regulatory-factor-transcription-footprints-short-sequence/ http://www.ncbi.nlm.nih.gov/pubmed/22955618 Nature. 2012 Sep 6;489(7414):83-90. doi: 10.1038/nature11212. An expansive human regulatory lexicon encoded in transcription factor footprints. Neph S, Vierstra J, Stergachis AB, Reynolds AP, Haugen E, Vernot B, Thurman RE, John S, Sandstrom R, Johnson AK, Maurano MT, Humbert R, Rynes E, Wang H, Vong S, Lee K, Bates D, Diegel M, Roach V, Dunn D, Neri J, Schafer A, Hansen RS, Kutyavin T, Giste E, Weaver M,Canfield T, Sabo P, Zhang M, Balasundaram G, Byron R, MacCoss MJ, Akey JM, Bender MA, Groudine M, Kaul R, Stamatoyannopoulos JA. Source Department of Genome Sciences, University of Washington, Seattle, Washington 98195, USA. Abstract Regulatory factor binding to genomic DNA protects the underlying sequence from cleavage by DNase I, leaving nucleotide-resolution footprints. Using genomic DNase I footprinting across 41 diverse cell and tissue types, we detected 45 million transcription factor occupancy events within regulatory regions, representing differential binding to 8.4 million distinct short sequence elements. Here we show that this small genomic sequence compartment, roughly twice the size of the exome, encodes an expansive repertoire of conserved recognition sequences for DNA-binding proteins that nearly doubles the size of the human cis-regulatory lexicon. We find that genetic variants affecting allelic chromatin states are concentrated in footprints, and that these elements are preferentially sheltered from DNA methylation. High-resolution DNase I cleavage patterns mirror nucleotide-level evolutionary conservation and track the crystallographic topography of protein-DNA interfaces, indicating that transcription factor structure has been evolutionarily imprinted on the human genome sequence. We identify a stereotyped 50-base-pair footprint that precisely defines the site of transcript origination within thousands of human promoters. Finally, we describe a large collection of novel regulatory factor recognition motifs that are highly conserved in both sequence and function, and exhibit cell-selective occupancy patterns that closely parallel major regulators of development, differentiation and pluripotency. Comment in • Genomics: users' guide to the human genome. PMID: 22955618 Data from this publication Epigenomics Experiments, by feature type.See all experiments (277) • DNA methylation (29) • H2AK5ac (2) • H2BK120ac (2) • H2BK12ac (3) • H2BK15ac (3) • H2BK20ac (2) • H3K14ac (2) • H3K18ac (2) • H3K23ac (2) • H3K27ac (5) • H3K27me3 (24) • H3K36me3 (26) • H3K4ac (2) • H3K4me1 (17) • H3K4me2 (2) • H3K4me3 (28) • H3K56ac (2) • H3K79me1 (4) • H3K79me2 (2) • H3K9ac (14) • H3K9me1 (1) • H3K9me3 (22) • H4K20me1 (2) • H4K5ac (2) • H4K8ac (4) • H4K91ac (2) • chromatin accessibility (40) • gene expression (5) • input control (22) • small RNA analysis (4) Publication Types, MeSH Terms, Substances, Secondary Source ID, Grant Support Publication Types • Research Support, N.I.H., Extramural • Research Support, Non-U.S. Gov't • Research Support, U.S. Gov't, Non-P.H.S. MeSH Terms • DNA/genetics* • DNA Footprinting* • DNA Methylation • DNA-Binding Proteins/metabolism • Deoxyribonuclease I/metabolism • Encyclopedias as Topic* • Genome, Human/genetics* • Genomic Imprinting • Genomics • Humans • Molecular Sequence Annotation* • Polymorphism, Single Nucleotide/genetics • Regulatory Sequences, Nucleic Acid/genetics* • Transcription Factors/metabolism* • Transcription Initiation Site Substances • DNA-Binding Proteins • Transcription Factors • DNA • Deoxyribonuclease I Secondary Source ID • GEO/GSE18927 • GEO/GSE26328 September 5, 2012 Millions of DNA switches that power human genome’s operating system are discovered By Stephanie Seiler And Leila Gray Posted under: Health and Medicine, News Releases, Research, Science The locations of millions of DNA ‘switches’ that dictate how, when, and where in the body different genes turn on and off have been identified by a research team led by the University of Washington in Seattle. Genes make up only 2 percent of the human genome and were easy to spot, but the on/off switches controlling those genes were encrypted within the remaining 98 percent of the genome. Without these switches, called regulatory DNA, genes are inert. Researchers around the world have been focused on identifying regulatory DNA to understand how the genome works. Using a new technology developed with funding from the National Human Genome Research Institute’s ENCODE (ENCyclopedia Of DNA Elements) project, UW researchers created the first detailed maps of where regulatory DNA is located within hundreds of different kinds of living cells. They also compiled a dictionary of the instructions written within regulatory DNA — the genome’s programming language. Darryl Leja, NHGRI This illustration depicts DNA packed tightly into chromosomes, as well as a DNA molecule unwound to reveal its 3-D structure. The findings are reported in two papers appearing in the Sept. 5 online issue ofNature. “These breakthrough studies provide the first extensive maps of the DNA switches that control human genes,” said Dr. John A. Stamatoyannopoulos, associate professor of genome sciences and medicine at the University of Washington, and senior author on both papers. “This information is vital to understanding how the body makes different kinds of cells, and how normal gene circuitry gets rewired in disease. We are now able to read the living human genome at an unprecedented level of detail, and to begin to make sense of the complex instruction set that ultimately influences a wide range of human biology.” Here are the key results: 1) The first detailed maps of regulatory DNA switches that make up the genome’s ‘operating system’. See related stories: Encyclopedia of DNA elements compiled; UW a key force in Project ENCODE Researchers unlock disease information hidden in genome’s control circuitry The instructions within regulatory DNA are inscribed in small DNA ‘words’ that function as the docking sites for special proteins involved in gene control. In many cases, these switches are located far away from the genes that they control. To map the regulatory DNA regions, the researchers harnessed a special molecular probe — an enzyme called DNaseI — that snips the genome’s DNA backbone. Under the right conditions, these snips occur precisely where proteins are docked at regulatory DNA. By treating cells with DNase I and analyzing the patterns of snipped DNA sequences using massively parallel sequencing technology and powerful computers, the researchers were able to create comprehensive maps of all the regulatory DNA in hundreds of different cell and tissue types. They found that of the 2.89 million regulatory DNA regions they mapped, only a small fraction — around 200,000 — were active in any given cell type. This fraction is almost totally unique to each type of cell and becomes a sort of molecular bar code of the cell’s identity. The researchers also developed a method for linking regulatory DNA to the genes it controls. The results of these analyses show that the regulatory ‘program’ of most genes is made up of more than a dozen switches. Together, these findings greatly expand the understanding of how genes are controlled and how that control may differ between normal and diseased cells. 2) The first extensive map of regulatory protein docking sites on the human genome reveals the dictionary of DNA words comprise the genome’s programming language. The instructions for turning genes on and off are written in DNA switches called regulatory DNA. These switches are scattered throughout the non-gene regions of the human genome. Having mapped the locations of the regulatory DNA switches, UW researchers wanted to know what made them tick. These regions contain small chains of DNA ‘words’ that make up docking sites for special regulatory proteins involved in gene control. The human genome contains hundreds of genes that make such proteins. However, current technologies only allow such proteins to be studied one at a time. They also lack the accuracy to resolve the DNA letters to which the proteins dock. As a result, most of the actual DNA words recognized by regulatory proteins in living cells were unknown. To find them, the researchers employed a simple, powerful trick that enabled them to study all the proteins at once. Instead of trying to see proteins directly, they looked for their shadows or ‘footprints’ on the DNA. To accomplish this, they again turned to the DNaseI enzyme that snips the DNA backbone within regulatory DNA. Prior work had shown that DNaseI likes to snip DNA next to regulatory protein docking sites, but not within the docking site itself. By using next-generation DNA sequencing technology, the researchers analyzed hundreds of millions of DNA backbone breaks made when cells were treated with DNaseI. They then used a powerful computer to resolve millions of protein footprints. In total, they identified 8.4 million such footprints along the genome, some of which were detected in many cell types. Next, they compiled all of the short DNA sequences to which the proteins were docked. They analyzed them using a software algorithm that required hundreds of microprocessors working simultaneously. This revealed that more than 90 percent of the protein docking sites were actually slight variants of 683 different DNA words — essentially a dictionary of the genome’s programming language. “These findings significantly advance the understanding of how the instructions for controlling genes are written and organized throughout the genome, and how combinations of different instruction sets function together to control genes, often at great distance along the genome,” Stamatoyannopoulos said. “The broad spectrum of cell and tissue types included in these analyses provide an incredibly rich resource that can be mined immediately by researchers around the world to illuminate how the genes they are studying are controlled.” The scientists determined that genes are connected in a complex web. In this web, regulatory DNA regions typically control one or at most a few genes, but genes receive inputs from large numbers of regulatory regions. The researchers also found evidence for a combinatorial code that helps match regulatory DNA with the right genes. Another key finding was that the regulatory DNA controlling genes involved in cancer and other types of ‘immortal’ cells that can keep on growing indefinitely appears to acquire mutations at a different rate than other kinds of regulatory DNA. This result points to a previously unknown link between genome function and patterns of DNA variation in individual human genomes. The finding may have implications for understanding susceptibility to cancer. The findings reported in these papers are expanded upon in two related papers to be published simultaneously in the journals Science and Cell. In the Science paper, UW researchers further expanded the regulatory DNA maps, and compared them with genetic maps of human disease. Their studies revealed that most DNA variants associated with specific human diseases or clinical traits are located in regulatory DNA rather than in gene sequences. In the Cell paper, the researchers describe using the detailed information on regulatory protein docking sites to create a comprehensive map of how those proteins are wired. http://www.washington.edu/news/2012/09/05/millions-of-dna-switches-that-power-human-genomes-operating-system-are-discovered/
MATLAB保存生成高质量的清晰图片 saveas保存jpg格式的图像线条变粗、变模糊,整幅图片就像有一层很薄的水印盖在上面。 解决方案: (1)其实matlab的出图都是矢量图,你就直接在‘edit’里面选择copy,然后就paste到word里面,伸缩自如,保证清晰 (2)可以试试print 如要把图保存成jpeg的格式的话,可以这样 print-djpeg-r85jpegtest 其中, -djpeg是格式d表示device,jpeg是格式, -r85表示像素85dpir表示resolution,也就是分辨率的第一个字母 jpegtest是文件名 也可以 print('-djpeg','-r300',Path) 或 print(gcf,'-djpeg','-r300',Path) print( ... ) Same as above but this calls PRINT as a MATLAB function instead of a MATLAB command. The difference is only in the parenthesized argument list. It allows the passing of variables for any of the input arguments and is especially useful for passing the handles of figures and/or models to print and filenames. 注:dpi的含义 Dots Per Inch的缩写。每英寸所打印的点数或线数,用来表示打印机打印分辨率。一般来说,该值越大,表明打印机的打印精度越高。 dpi是指单位面积内像素的多少,也就是扫描精度。dpi越小,扫描的清晰度越低,由于受网络传输速度的影响,web上使用的图片都是72dpi,但是 冲洗照片不能使用这个参数,必须是300dpi或者更高350dpi。例如要冲洗4*6英寸的照片,扫描精度必须是300,那么文件尺寸应该是 (4*300)*(6*300)=1200像素*1800像素。
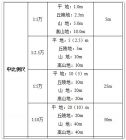
这个部分一直是比较纠结的,看到同事整理的资料,顺便分享一下! 地表面的形态是很复杂的,不同地貌类型的形态是由它的相对高度、地面坡度以及所处的地势所决定的,它们是影响等高距的主要因素。从等高距计算公式可以看出,当地图比例尺和图上等高线间的最小距离简称等高线间距确定之后,地面坡度是决定等高距的主要因素,当然等高距的大小也受到地面高度所制约。 h=M*S*tanα/1000 式中: M —地形图比例尺分母; S —等高线间的最小间距; α—地面坡度。 等高距的选择一般应考虑两种因素:图面清晰度和地貌表示的详细度。对选择等高距来说,图面清晰度指地图上等高线最小间距对图面载负的影响程度。地貌表示详细度指单位高差内等高线所通过的数量对地貌表示的影响程度。它们之间是互相影响又互相制约的统一体。所以选择分区适宜的等高距的实质是选择详细度和图面清晰度的最佳结和。 常见比比例尺、等高距和 DEM 分辨率关系如下表所示:
投稿:最后检查 论文写完之后,要严格自查并/或找一位同事评价一下,尽可能确保文章具有很强的科学性和良好的撰写方式,然后就可以投向目标期刊了。此时你应该已经挑选出最合适的期刊,并已经写出一份有说服力的投稿信给编辑。检查目标期刊的《稿约》,确保遵循了所有要求;如果没有,那就要在投稿前做相应改正以免将来造成延误。其中包括稿件和所有插图都保存为正确格式和所要求的分辨率。 多数期刊鼓励在线投稿,这通常需要在目标期刊注册一个投稿帐户。这是一个分步过程,通常要求输入全名、单位地址、最高学位和所有作者的详细联系信息(不仅是通讯作者)。注册之后,投稿作者把所有相关文件(包括正文、投稿信、插图文件和补充材料)上传到期刊的网上投稿系统。 一些期刊规定以邮递方式投稿,要求提交规定数量的论文打印件和含所有文件的光盘。通常每个作者都要签署声明表示同意向杂志投稿并在论文上署名,不过有些杂志现在也通过电子邮件进行确认。投稿过程中可能需要交纳投稿费,但是大多数情况下出版费都是论文被录用之后才会征收。任何从已发表的文献中转载插图或其他内容都要获得许可,有时在投稿时杂志社就会要求你提交此类许可证明。若论文被录用,论文的版权就要转让给出版商;有时,在投稿时就要填写一份版权转让表。 投稿过程有时允许你推荐或排除潜在的论文审稿人。如果没有这个过程,你也可以在投稿信中推荐或排除。期刊编辑会尽力任命独立专家为审稿人,但也知道许多领域的实验室之间存在激烈竞争。他们很清楚:你尚未公开发表的数据具有敏感性,把它交给直接竞争对手有可能不合适。所以,他们愿意知道谁可能是“友好的”审稿人,谁可能不那么友好。编辑们几乎肯定不会只任命你推荐的审稿人或排除所有你请求排除的人。他们会用你提供的信息来客观地决定谁应该和不应该审读你的稿件。 在选择哪些专家可列入“推荐审稿人”时,你应该考虑那些你论文所赞成的研究或观点的作者;比如,若你的工作基于之前发表的一篇文献并发展或确认了其结果,则该文献的资深作者就是好的候选人。你的参考文献可以帮你找出这些候选人,仔细阅读他们的论文就能知道他们的观点是否与你相符或相反。在理想状态下,你的研究发现能支持你所推荐的本领域资深研究者所提出的观点。相同领域内的国际合作者也可成为“友好的”审稿人,不过如果你们之前共同发表过论文可能会被编辑以偏向性理由排除。 确定谁应该被排除出审稿人行列要更为困难。但是,如果你知道有另一实验室在做同样的工作(也许你在最近召开的一次会议上听过该实验室成员做的报告或张贴的壁报),就可以请编辑把该实验室的主要研究者排除出审稿人行列。此外,也要请编辑把观点或假设与你相反的研究者排除在外。 当然,期刊会要求任何审稿人完全客观地评议你的稿件。而且,编辑也会在一定程度上评估你的稿件来判断审稿人的意见是否公正。如果收到的审稿意见完全相互矛盾(如一个非常正面,另一非常负面),编辑可能会再找一个审稿人来评议直至对审稿意见满意,这会推迟你投稿的决定意见。归根结底,只要研究的设计和实施都没有问题,结果有新颖和有趣之处,行文清楚简洁并符合《稿约》,你的论文就有最大的机会能逾越这些障碍并最终被录用。 Submitting your paper: final checks If you have written your paper, critically self-evaluated it and/or asked a colleague to evaluate it, and believe it to be as scientifically robust and well written as possible, you are ready to submit it to your target journal. You should by now have selected the most appropriate journal for your paper and written a convincing cover letter to the editor. Check that all of the instructions in the target journal’s Guide for Authors are complied with—if any are not, then these should be addressed before the paper is submitted or they could cause delays later on. This includes ensuring that the manuscript and any figure files are saved in the appropriate file format and of the requested resolution. Most journals encourage online submission, which usually requires registering with the target journal and setting up a submission account. This is a step-by-step procedure in which details such as full names, departmental addresses, highest degrees awarded and full contact information for all authors, not just the corresponding author, are usually requested. Following registration of an account, the submitting author will be able to upload all relevant files, including manuscript file, cover letter, separate figure files and any supplementary material files, to the journal’s online submission system. Some journals request submission by post, which requires posting the requested number of identical printed copies of the manuscript along with an electronic copy of all files on a CD. Frequently, each author is required to sign a declaration agreeing to the submission to the journal of a paper bearing their name, although some journals now verify this by e-mail. During the submission process, there might be a requirement to pay any submission costs, although publication costs are not usually requested until after a manuscript is accepted. Any figures or other content that are being reproduced or modified from previously published work will require the appropriate permissions, and these are sometimes requested at the time of submission. If a manuscript is accepted, the copyrights to the manuscript will need to be transferred to the publisher; the relevant forms for copyright transfer are sometimes made available during the submission process. The submission process sometimes allows you to recommend or exclude potential reviewers of your manuscript. If not, it is usually worthwhile doing so in your cover letter. The journal editors will try to appoint independent experts as reviewers, but will also be aware that many fields are intensely competitive among labs. They will also appreciate that your unpublished data needs to be treated sensitively, and that it might not be appropriate to put that in the hands of a competitor working on the same thing. Thus, it will help them to know who might be a ‘friendly’ reviewer and who might be less friendly. The editors will almost certainly not appoint only the reviewers you suggest and exclude all those you ask to be excluded, but they will use the information you provide to make an objective decision about who should and who should not review your paper. In choosing who to recommend as a potential peer reviewer, you should consider any researchers whose hypotheses and ideas your work supports; for example, if your work builds on previously published work, extending or confirming the findings of that work, then the senior author(s) on such a study would likely be a good candidate reviewer. A look through your reference list will help you to identify such candidates, and reading their papers closely will give you an idea of whether their thoughts are in line with your own, or perhaps opposed to them. Ideally, recommend senior researchers in the field who have propounded ideas that would be supported by the findings of your study. International collaborators in the same field also represent potential ‘friendly’ reviewers, although if you have previously co-published work with those researchers the journal editors might exclude them for potentially being bias. Working out who to exclude can be more difficult, but if you know that some other lab is working closely on the same thing, perhaps because you have seen researchers from that lab speak or present a poster at a recent meeting, it would be a good idea to ask the editors to exclude the Principle Investigator of that lab as a candidate reviewer. Also ask the editors to exclude researchers whose hypotheses or ideas are known to run counter to those suggested in your manuscript. Of course, any reviewers that are appointed will be asked to be completely objective in their assessment of your manuscript. Moreover, the editors will also be able to assess your manuscript to some degree and identify if the points raised by the reviewers are fair or not. If completely polarized reports (for example, one very positive and one very negative) are received, the editors may choose to appoint additional reviewers and delay a decision on your manuscript until they are satisfied with the reports they receive. Ultimately, if you have designed and executed your study well, show something novel and interesting, and written a clear and concise manuscript complying with the instructions for authors, you will have maximized your chances of getting over the final hurdle before acceptance. Dr Daniel McGowan 分子神经学博士 理文编辑学术总监
Reaching a new resolution standard with electron microscopy Robert F. Klie Nanoscale Physics Group, Department of Physics, University of Illinois at Chicago, Chicago, IL 60607, USA A new approach to reduce spherical and chromatic aberration in electron microscopy allows for low-energy imaging of single-layer boron nitride, a novel 2D nanostructure that is analogous to graphene.
 标签: 分辨率
![[转载]GMT:Example B17【绘制GTOPO30的DEM地形图】](http://image.sciencenet.cn/album/201207/18/102511w03ne81311850kek.jpg.thumb.jpg)


![[转载]发展迅速:印度遥感卫星异军突起, 全面领先中国](http://image.sciencenet.cn/album/201201/14/161909gd5rdrs5piouiknn.jpg.thumb.jpg)
![[转载]资源一号02C星传回首批成像数据](http://image.sciencenet.cn/album/201112/28/2322185z0dk200085d5yko.jpg.thumb.jpg)
![[转载]卷积物理意义的超强解释](http://image.sciencenet.cn/album/201111/21/134020y3cmlmqom9mcb4rz.jpg.thumb.jpg)