!!! Excerpted from TI The Fly-Buck Design Calculator Tool assists designers with routine calculations for the 2W TPS55010 isolated DC/DC Converter. Two versions are available to support a single or a dual output configuration. The tool helps the user select a transformer, the sense resistors, and the power diode as well as the input, output, compensation, and primary capacitors. All equations used in the tool are shown with the corresponding datasheet equation. Primary and secondary waveforms of the voltage and current are also displayed. Fly-Buck Design Calculator Tool : TPS55010Tool_DualOutput.xls and TPS55010Tool_SingleOutput.xls TPS55010: DC/DC Converter (Integrated Switch), 2.95V To 6V Input, 2W, Isolated DC/DC Converter with Integrated FETS tps55010.pdf Other useful documents: slvu494.pdf and slvu459.pdf topology
Huabing Ouyang ,B.Shen. Research on the Conversion from Design Features to Machining Features Faced on STEP-NC. IEEE Conference of 2011 3rd International Conference on Measuring Technology and Mechatronics Automation(ICMTMA),2011,3:103-106 .(EI: 20111313853572), EI : 20111313853572
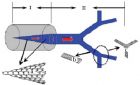
Title: Optimizing the design of nanostructures for improved thermal conduction within confined spaces, Nanoscale Res. Lett. 6 (2011)0422 Authors: Jianlong Kou, Huiguo Qian, Hangjun Lu, Yang Liu, Yousheng Xu, Fengmin Wu, Jintu Fan 2011-6-422(Nanoscale Res.Lett.).pdf Figure 1 The design sketch of the total heat conduction structure. This desgin is from the interior of an electronic device to micro space, which includes two sections: I represents the composite stru ...
Design of high strength Fe-(P, C)-based bulk metallic glasses with Nb addition Sheng-feng GUO a , , , Ye SHEN b Abstract Bulk metallic glass (BMG) rods Fe 71 Mo 5- x Nb x P 12 C 10 B 2 ( x =1, 2, 3, 4 and 5) with diameter of 1 or 2 mm were synthesized by copper mold casting. The effects of Nb substitution for Mo on the structure, thermal and mechanical properties of Fe 71 Mo 5- x Nb x P 12 C 10 B 2 alloys were studied by X-ray diffraction, differential scanning calorimetry and compressive testing. The results show that the substitution of Nb for Mo leads to a decreased glass forming ability, but with plasticity of 1.0%, the fracture strength of Fe 71 Mo 2 Nb 3 P 12 C 10 B 2 alloy increases up to 4.0 GPa. The improvement of the fracture strength is discussed in terms of the enhancement of atomic bonding nature and the favorite formation of a network-like structure due to the substitution of Nb for Mo. http://www.sciencedirect.com/science/article/pii/S1003632611610327
. B = REGRESS(Y,X) returns the vector B of regression coefficients in the linear model Y = X*B. X is an n-by-p design matrix, with rows corresponding to observations and columns to predictor variables. Y is an n-by-1 vector of response observations. REGRESS 多元线性回归——用最小二乘估计法 B = REGRESS(Y,X) , 返回值为线性模型Y = X*B的回归系数向量 X ,n-by-p 矩阵,行对应于观测值,列对应于预测变量 Y ,n-by-1 向量,观测值的响应(即因变量,译者注) = REGRESS(Y,X) returns a matrix BINT of 95% confidence intervals for B. BINT,B的95%的置信区间矩阵 = REGRESS(Y,X) returns a vector R of residuals. R,残差向量 = REGRESS(Y,X) returns a matrix RINT of intervals that can be used to diagnose outliers. If RINT(i,:) does not contain zero, then the i-th residual is larger than would be expected, at the 5% significance level. This is evidence that the I-th observation is an outlier. RINT,区间矩阵,该矩阵可以用来诊断异常(即发现奇异观测值,译者注)。 如果RINT(i,:)所定区间没有包含0, 则第i个残差在默认的5%的显著性水平比我们所预期的要大, 这可说明第i个观测值是个奇异点 (即说明该点可能是错误而无意义的,如记录错误等,译者注) = REGRESS(Y,X) returns a vector STATS containing the R-square statistic, the F statistic and p value for the full model, and an estimate of the error variance. STATS,向量,包括R方统计量,F统计量,总模型的p值(还不清楚) 和方差的一个估计(还不清楚) = REGRESS(Y,X,ALPHA) uses a 100*(1-ALPHA)% confidence level to compute BINT, and a (100*ALPHA)% significance level to compute RINT. 用100*(1-ALPHA)%的置信水平来计算BINT, 用(100*ALPHA)%的显著性水平来计算RINT X should include a column of ones so that the model contains a constant term. The F statistic and p value are computed under the assumption that the model contains a constant term, and they are not correct for models without a constant. The R-square value is one minus the ratio of the error sum of squares to the total sum of squares. This value can be negative for models without a constant, which indicates that the model is not appropriate for the data. X应该包含一个全“1”的列,这样则该模型包含常数项。 F统计量和p值是在模型有常数项的假设下计算的, 如果模型没有常数项,则计算得的F统计量和p值是不正确的。 the R-square value is one minus the ratio of the error sum of squares to the total sum of squares.(此句无法把握,请高手帮忙~~!) 若模型没有常数项,则这个值可以为负值,这也表明这个模型对数据是不合适的。 (即数据不适合用多元线性模型,译者注)If columns of X are linearly dependent, REGRESS sets the maximum possible number of elements of B to zero to obtain a "basic solution",and returns zeros in elements of BINT corresponding to the zero elements of B.如果X的列是线性相关的,则REGRESS将使B的元素中“0”的数量尽量多,以此获得一个“基本解”并且使B中元素“0”所对应的BINT元素为“0”。REGRESS treats NaNs in X or Y as missing values, and removes them.REGRESS 将X或者Y中的NaNs当作缺失值处理,并且移除它 rcoplot(r,rint) displays an errorbar plot of the confidence intervals on the residuals from a regression. The residuals appear in the plot in case order. Inputs r and rint are outputs from the regress function. he interval around the first residual, shown in red, does not contain zero. This indicates that the residual is larger than expected in 95% of new observations, and suggests the data point is an outlier. 这是个画残差的函数,红色的表示超出期望值的数据 圆圈代表残差的值,竖线代表置信区间的范围
转一下一个读者的读书笔记 http://book.douban.com/review/1450874/ 原文在: http://lijuan.yo2.cn /2008/07/22/reading- experimental-design- for-the-life-science s-chapter1-why-you-n eed-to-care-about-de sign/ http://lijuan.yo2.cn /2008/07/23/reading- experimental-design- for-the-life-science s-chapter2-starting- with-a-well-defined- hypothesis/ http://lijuan.yo2.cn /2008/07/23/reading- experimental-design- for-the-life-science s-chapter3-between-i ndividual-variation- replication-and-samp ling/ http://lijuan.yo2.cn /2008/07/25/reading- experimental-design- for-the-life-science s-chapter4-different -experimental-design s/ 还有一个flowchart在: http://lijuan.yo2.cn /2008/07/25/reading- experimental-design- for-the-life-science s-flowchart/ Chapter 1 Why you need to care about design * Experimental design is more about common sense, biological insight and careful planning. * Poor experimental designs waste time and money, also have ethical issues. * Every statistical test have slightly different assumptions, so it is essential to decide in advance how you will analyse your data when you have collected them. * The two major goals of designing experiments are to minimise random variation and account for confounding factors. 下面是新手们经常有的两个认识误区: Myth1 It does not matter how you collect your data, there will always be a statistical 'fix' that will allow you to analyse them. Myth2 If you collect lots of data something interesting will come out, and you'll be able to detect even very subtle effects. Chapter 2 Starting with a well-defined hypothesis A hypothesis is a clear statement articulating a plausible candidate explanation for observations.It should be constructed is such a way as to allow gathering of data that can be used to either refute or support this candidate explanation. For example: 1. Questions: why does chimp activity vary during the day? 2. Hypotheses: Chimp activity pattern is affected by feeding regime. 3. Predictions: The fraction of time that a chimp spends moving around will be higher in the hour aroung feeding time than at other times of day. Make sure that your experiment allows you to give the clearest and strongest evidence for or against the hypothesis. Make sure that you can interpret all possible outcomes of your experiment. Pilot study: Exploration of the study system conducted before the main body of data collection in order to refine research aims , data collection and analysis techniques. Correlational study's advantages: * we handle them with much less time; * We do not affect other functions; * We are dealing with biologically relevant variation Manipulative experiment's advantages: * without third variables; * without reverse causation; A more efficient approach might be to begin with a large correlational study to see which factors seem to be important. Once potentially influential factors had been found, manipulative studies could be used to confirm and refine these findings. There is no perfect study, but a little care can produce a good one instead of a bad one. Chapter 3 Between-individual variation,replication and sampling Whenever we carry out an experiment, we are trying to find ways to remove or reduce the effects of random variation, so that the effects that we care about can be seen more clearly. Replication involves making the same manipulations and taking the same measurements on a number of different experimental subjects. Replication is a way of dealing with the between-individual variation due to the random variation that will be present in any life science experiment. Replicate measures must be independent of each other: Techinicallly, statisticians talk about there being no correlation between the deviations of individuals within a group.If this is the case, this will have the important effect of meaning that if we examine a group of independent individuals their deviations will tend to cancel out, and the mean of the sample will close to the mean of the population. Pseudoreplication is a problem that has to be addressed by biologists and not by statisticians. Accept that sometimes pseudoreplication is unavoidable, so the key if you can't replicate fully is to be aware of the limitations of what you can conclude from your data. Number of replicates: It should be big enough to give you confidence that you will be able to detect any biologically meaningful effects that exist, but not so big that some sampling was unnecessary. * Educated guesswork: reference on previous similar studies. * Formal power analysis: statistical power is the probability that a particular experiment will detect a difference assuming that there really is a difference to be detected. (there are many computer programs that can help you) Randomisation simply means drawing random sanmples for study from the wider population of all the possible individuals that could be in your sample. Proper randomisation means that any individual experimental subject has the same chance of finding itself in each experimental group. The power of an expeiment will be affected by three main things: the effect size, the amount of random variation and the number of replicates. Chapter 4 Different experimental designs The control group must be that it differs from the treatment group in no way except for the treatment being tested. A blind procedure is one in which the person measuring experimental subjects has no knowledge of which experimental manipulation they have experienced or which treatment group they belong to. In experiments with humans, we may use a double-blinded procedure in which the experimental subjects too are kept ignorant of which treatment group they belong to. The procedures are design to remove the perception that unconscious bias might taint the results of a study. 后面讲的paired-design, cross-over design, split-plot design就不如直接看统计书了。 Chapter 5 Taking measures Calibrate your measuring instruments(including human observers.) Adopt clear definitions to reduce subjective decision-making during measurement taking. Watch out for observer drift, intra-observaer variability and inter-observer variability. Watch out for observer effects, where measuring a system influence its behaviour. Recording data effectively is a skill that you must acquire. 1. Don't try and record too much information at once; 2. Beware of shorthand codes. 3. Keep more than one copy of your data. 4. Write out your experimental protocol formally and in detail, and keep a detailed field journal or lab work. 5. Don't overwork. Chapter 6 Final thoughts
Most economic's courses are filled with explanations like the one above. This article will dicuss hand's on activities instructor's can use. This article will discuss some successful hand' s on economic's experiments I have used in my undergraduate courses as well as guidelines for designing a successful economic's experiment to be used for demonstration in college classroom, boardroom, or other teaching environment. Instructions Things You'll Need: Creative Mind Something to sketch out your ideas Group of non-economists to test a designed experiment to ensure success. (If applicable i.e. you designed a new experiment and are not sure if it will work.) Step 1 Guidelines to Follow. 1. Experiments should be quick, simple and timely. I have found that one receives the best results after a concept has been explained and the experiment is used to reinforce the material. Using an experiment to introduce an idea may confuse students and take much more time since there will be a lengthy discussion about the concept and then the rules of the game. It is best to explain the concept and use the experiment to follow up the lecture. Experiments need to be conducted on the same day the concept is introduced. Holding an experiment after the fact results in having to go through another explanation and may not flow with current lecture material. 2. Rules and the payoff you desire. Make sure these are compatible. If one has constructed a poorly thought out experiment the rules used will result in payoffs but not necessarily the ones you wanted. 3. Make sure you test the experiment on non-economists before conducting the experiment to assure that the outcome is the one that you are going to get. Undergraduates do not always look at the simple payoff matrix or result as their sole goal. Fairness or class social status may play a role in outcomes that are not modeled by the game. Well constructed games should work to minimize this. 4. Incentives. Make sure that there are adequate incentives to encourage participation. Step 2 Sample experiment 1 Concept: Diminishing marginal productivity Experiment: Popping Popcorn I have conducted this experiment a couple of different ways. The simplest way is to use a microwave. I found myself teaching economics in a physics lab and had one available. Alternatively one can use a hot plate and a disposable metal pan of popcorn (these are sold at most supermarkets next to the microwavable popcorn). The basic idea is that if one input is fixed as more and more of the other inputs are added total productivity goes up but at a decreasing rate. As the popcorn pops our productivity (popped corn) increases but is going to increase at a slower rate until it stops popping altogether. Here the capital good is fixed (metal pan, microwave or hotplate and kernels) while labor and other inputs such as electricity are variable. Allowing students to eat the popcorn afterwards also wins some instructor brownie points. Step 3 Sample experiment 2 Concept: Diminishing marginal utility Experiment: Eating bite size snickers bars Purchase a large bag of bite sized snickers. Have a student volunteer come to the front of the classroom. Next offer them one snicker's bite sized bar at a time and then ask them to rate their satisfaction after each snicker's bar is eaten on a scale of 1 to 10. Very soon the ratings of satisfaction will start to go down which demonstrates diminishing marginal utility. Step 4 Sample experiment 3 Concept: Tragedy of the commons Experiment: Collecting change from the communal coffers For this experiment I draw one large circle on a desk for each group and two smaller circles on either side. Each group is divided up into groups of two that will each take their turn at collecting change using one finger to pull one item of change from the large circle to their respective smaller circle. Everyone is told that at the end of the timed round (30 seconds is plenty of time) 10% of the remaining value of the change left in the large circle will be added. One dollar in various small domination change is placed in the large circle and the first group is allowed to start at the signal I give them. Of course the players in the first group collect all the change from the large circle and there is nothing left to gain any interest for the second group to collect. This demonstrates the tragedy of over harvesting a common resource which is rival but non-excludable.
The Book the complete text Problem Sets additional problem sets not found in the book Companion hints on how to use DrScheme Teachpacks if you encounter bugs in your Teachpacks Known Mistakes known typos and mistakes DrScheme programming environment TeachScheme! our educational outreach effort
 标签: Design