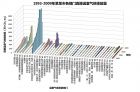
(全球温室气体减排行动的未来一直处于不明朗的状态,工业化国家和以中国为代表的发展中国家在联合国的环发大会也经常争吵不休。毫无疑问,中国的温室气体排放问题引起世界关注 。 ) Local and regional control of greenhouse gas emissions in China Lead author: Sjaak Slanina (Netherlands Energy Research Foundation) adopted from EarthPortal Introduction China, at present, has not yet openly accepted obligations to reduce greenhouse gas (GHG) emissions . This is seen by many countries as a very serious problem in view of the large contribution of this country to global greenhouse gas emissions. China officially takes the point of view that the present concentrations of greenhouse gases have been mainly produced by developed countries and that the responsibility of the developing countries, hence, is very limited. However, measures to reduce local and regional pollution problems will in fact have a large impact on Chinese greenhouse gas emissions. The Problem Figure 1. Carbon dioxide emissions in 2006. (Source: NMP ) A recent report by The Netherlands Environmental Assessment Agency (NMP), a Dutch environmental agency, stated that China is becoming the number one carbon dioxide emitter in the world. Until fairly recently that position was held by the United States of America, which means that the very rapid economic growth of China has now changed that situation; according to this report, China overtook the number one position in the year 2006 (see Figure 1). It must be kept in mind that all these statistics have a certain amount of uncertainty and that this conclusion is under heavy debate, especially from the Chinese side. The total carbon dioxide emissions of China are in the same order of magnitude as those from the United States, but if the emissions per capita of the population are examined, the picture changes (see Air pollution in China ). The emissions of carbon dioxide per capita of the population in China is much lower than that of the U.S. and about half of that of Europe. If the economic development in China continues to progress at the present rate, then the emissions per capita of the population in China will surpass that of Europe in the next 10 to 15 years or so. According to the Intergovernmental Panel on Climate Change (IPCC) and NMP the emissions per capita in Europe and China are 7 and 4 tons of carbon dioxide per capita respectively. Even if the announced abatement measures of the EU are ignored, an economic growth of 7% per year in China, a modest estimate, will lead to a doubling of the carbon dioxide emissions in about 10 years, while the emissions in Europe will increase by 20%, based on 2% growth per annum. So the emissions per capita in China will surpass those in Europe in 13 years, based on linear extrapolation with many uncertainties, of course. Effects of Climate Change in China Figure 2. Harbors threatened by oceanic level rise in the next century. (Source: IPCC) A recent evaluation by the Intergovernmental Panel on Climate Change (IPCC) has made clear that two out of the three major economic pillars of economic growth in China, namely the harbors at the Yangtze's and Pearl River Deltas, are threatened by climate change, and specifically by an increase in ocean levels (see Figure 2). The third pillar, the Beijing and Tianjin Mega-City is not particularly in danger. A recent overview indicates that a large number of people, 90 million, reside in the threatened low level coastal zones of China. The most important problem in China regarding climate change, in the view of most Chinese scientists, is not the rise in ocean levels but the change in precipitation patterns. Some models indicate that less water will fall in the already dried out northern areas, but increased precipitation will cause more problems in the already often flooded regions in the south of China. Position of Chinese Government on GHG Abatement Table 1. GDP contributions of important Chinese mega-cities. (Source: China Statistical Yearbook ) Even though it is very clear that climate change could present large difficulties in China, its government has made no formal commitment to greenhouse gas reductions for the following reasons: Only 25% or less of the present greenhouse gas concentrations are of Chinese or Asian origin, and the Chinese government is convinced that it is the duty of developed countries to first remove their large contribution to greenhouse gas levels before the Chinese government is willing to accept obligations for abatement. Furthermore, the Chinese are convinced that large economic development is essential for the stable development of China. At present about 46% of the Chinese work in agriculture , compared to 10% in South Korea and 2% in The Netherlands. If we assume that in twenty years time China will look much like South Korea, this means that at least 200 million jobs must be created for agricultural workers and therefore a strong economic development of at least 7% per year is needed to obtain social stability. While Europe and the US can handle proposed reductions by minor adjustmentse.g. use smaller cars and more public transportion, reduce meat consumption , etc., which do not necessary lead to major changes in lifestylethe situation in China is completely different. The high GDP growth rates found in Chinese mega-cities are thus seen as essential by Chinese scientists and government to ensure stable social development. And at present, the growth rates of China exceed those found in even Korea and Taiwan. Characteristics of Chinese Economic Growth Figure 3. Development of container transit in PRD harbors and in the harbor of Rotterdam. (Source: China Statistical Yearbook 2006 ) To complicate matters further, a fairly large portion of the economic growth of China, in total 47% of Chinese GDP, is generated in four rather small areas, namely the Pearl River Delta (PRD), the Yangtze River Delta, the Beijing and Tianjin mega-cities and, recently, the Shenyang-Dalian mega-cities in the northeast plains. This means that a large amount of the emissions from China originate in quite a small area of the country (see Table 1). This high density of industrial activities leads to very high local emissions and concentrations, so local abatement measures are seen as unavoidable and are, at present, implemented on a grand scale, especially in the Beijing and PRD area. The fast development of the Chinese economy is highlighted in Figure 3, where the container transit in the PRD harbor and Rotterdam is given in units of a million standard containers. Its very clear how enormous the growth has been in recent years, comparing this development rate with the growth of the largest European harbor of Rotterdam. Effects of Local/Regional Pollution Figure 4. Ozone concentrations during 2 days in 2000, European air quality standards for ozone are indicated. (Credit: Yuanhang Zhang) At present, the most pressing environmental problem in China is probably the effect of aerosols on human health (for more details, see ]). To give an example, according to recent Health Effects Institute (HEI), USA the range of extra deaths caused by aerosols in the PRD delta area is probably between 15,000 and 35,000 per year, indicating the seriousness of the problem. The second big problem in China is the increase in the concentration of photo oxidants, substances generated by the reaction of nitrogen oxides and volatile organic compounds (see Ozone ). In Figure 4, the development of ozone in Beijing during a number of days in the year 2000 is shown together with limits as issued by the European Union. Interactions between Local/Regional Pollution and Climate Change Figure 5. Backscatter and absorption of solar light by aerosols in PRD. (Credit: Meinrat Andreae, Pride Campaign) Strong interactions exist between local or regional air pollution problems and climate change and, therefore, measures taken to abate local problems will also have a strong effect on the radiative balance and climate change. A very good example, but one where local or regional measures do not influence GHG emissions , is the interaction between particulate matter and the radiative balance. If the particles are very small, with a diameter of 0.1 micrometer or less, no interaction between particles and incoming solar radiation takes place. If particles are larger than two micrometers, they do not change the intensity of incoming solar radiation very much. If particles are larger than 0.1 micrometer but smaller than 2 micrometers, then internal reflection of incoming solar radiation takes place and a strong backscatter of radiation is observed (for a more extensive explanation, see Aerosols ). If particles are composed of black carbon or soot, then all radiation is absorbed. This rather complex situation makes it difficult to characterize the interaction between particles and incoming solar radiation. In fact, quite complicated measurements are necessary to quantify this relationship. In the years 2004 and 2006, large experiments (PRIDE Campaign) were conducted in the Pearl River Delta in order to characterize the radiative forcing due to particles. The ratio between backscatter and absorption by aerosol particles, as well as the ratio as between backscatter and light reflection of the earth surface determine whether particulate matter cools by reflection or heats by absorption of solar light. These ratios are used to calculate the single scattering albedo , 0 . As a Figure 5 indicates, at a critical value of 0 between 0.8 and 0.9 cooling and light absorption are of the same order of magnitude. If 0 is above 0.9, as generally encountered in Europe and the United States, then cooling is observed. At values below 0.8 light absorption is dominant and heating will take place. The observed values of 0 in the Pearl River Delta are generally at this critical level. So heating by absorption and cooling by reflection are of the same magnitude, both about twelve watts per square meter , about four times the radiative forcing due to all the greenhouse gases . It is clear that any measures either to reduce the concentration of particulate matter or the amount of black carbon in the atmosphere will have a very large impact on the radiative balance, and hence, on climate change in this area. Increased Energy Efficiency Figure 6. GDP, energy use and SO 2 concentrations 1980 to 2000. (Credit: Thomas G. Rawski) As already discussed above, China has no official greenhouse gas abatement obligations. In order to alleviate local and regional problems, measures have been taken which also reduce greenhouse gas emissions . Twenty-five years ago, energy efficiency in power generation and industry in China was very poor. In order to reduce the high sulfur dioxide concentrations in Chinese cities, measures were taken to reduce the energy intensity of industry and electricity production . Figure 6 shows that energy use did not increase as much as GDP and that these measures led to a reduction of sulfur dioxide while also substantially reducing carbon dioxide emissions. Figure 7. Reduction of carbon dioxide emissions due to increased energy efficiency and use of renewables. (Credit: IEA ) In the same way, plans to reduce energy intensity, in order to minimize expenditures for expensive oil and pollution in Chinese mega-cities, will have an impact on greenhouse gas emissions, according to an International Energy Agency (IEA) study (see Figure 7). A total reduction of 45%, compared with the business as usual scenario, is expected due to these measures, again, without accepting international obligations. A recent World Bank study shows that the energy intensity of Chinese industries is still high, even though substantial progress has been made since 1980. There is still considerable room for improvement, especially in regards to the poor performance of trucks. Reforestation Figure 8. Reforestation in China. (Credit: Sjaak Slanina , Xin Hua) Problems with desertification , soil erosion and dust storms have induced reforestation efforts on a very large scale in China. Of course, all these new forests will capture carbon oxide. These projects will contribute to a reduction of the net carbon dioxide emissions of China, even though this was not the most important objective of these undertakings (see Figure 8). Depending on the growth rate of these forests, determined by factors like water supply and nutrients, etc., some 2 to 10% of the China's current carbon dioxide emissions could be sequestered. GHG Emissions by Country of Production or by Country of Consumption One last point to consider in terms of abatement is the question of how to divide the burden of carbon dioxide emissions. Until now greenhouse gas emissions were very simply attributed to the country where the production takes place. The question is whether that is a truly reasonable and fair solution. An alternative to this approach is now under discussion in many developing countries. The global community is dependent on the manufacture of goods, and in terms of environmental impact, these goods should be produced where social and economic benefits are maximal and environmental detriment is minimal. Therefore, greenhouse gas emissions should be allotted according to consumption , and not only according to production. This is a very intriguing question which must be addressed in the next ten years or so. Conclusion It is clear that all these measures to alleviate local and regional pollution problems contribute to abatement of greenhouse gas emissions and that local and regional scales are connected in many ways with global climate problems. References Air Science Group, Environmental Protection Department, the Government of the Hong Kong Special Administrative Region, 2006. Air Quality in Hong Kong . A report on the results from the Air Quality Monitoring Network (AQMN). HEI International Scientific Oversight Committee, 2004. Health Effects of Outdoor Air Pollution in Developing Countries of Asia: A Literature Review . Special Report 15. Health Effects Institute, Boston MA. IPCC, 2007. Climate Change 2007: The Physical Science Basis. Summary for Policymakers . Contribution of Working Group I to the Fourth Assessment Report of the Intergovernmental Panel on Climate Change. ISBN: 0521880092 . National Bureua of Statistics China, 2006. China Statistical Yearbook 2006 . National Development and Reform Commission, Peoples Republic of China, 2007. Chinas National Climate Change Programme . Netherlands Environmental Agency (NMP) et al., 2007. Milieu en Natuur compendium (MNP) . PRIDE special issue, in press. Atmospheric Environment . Rawski, Thomas G., 2006. Urban air quality in China: Historical and comparative perspectives , lecture. Shao, M., Tang, X., Zhang, Y., and W. Li, 2006. City clusters in China: air and surface water pollution . Frontiers in Ecology and the Environment , 4(7): 353-61. Zeng, N., Ding, Y., Pan, J., Wang, H., and Jay Gregg, 2008. Climate Changethe Chinese Challenge . Science , 319: 730-731.
 标签: 温室气体排放