CALL FOR PAPERS DEADLINE 31st December 2014 REGISTRATION WILL OPEN IN MARCH 2015 Human Behaviour in Fire is the study of human response when exposed to fire and other similar emergencies in buildings, structures and transportation systems. It includes an understanding of people’s awareness, beliefs, attitudes, motivations, decisions, behaviours and coping strategies and the factors that influence them. The study of human behaviour in fire is highly multidisciplinary, involving practitioners from the fields of mathematics, engineering, architecture, computer science, law, sociology, psychology, human factors, communications and ergonomics. The primary aim of human behaviour research and its translation into practice is to minimise the risk to people from fire. This is achieved by generating and collecting quantitative and qualitative data and information on human responses which can be used to develop human fire response theory for use in performance based regulatory systems, computational models, fire safety engineering design, fire safety education and management. The 6th Human Behaviour in Fire Symposium will facilitate the dissemination, open discussion and debate on diverse issues related to human behaviour in fire through a varied programme of research presentations, seminar discussions and interactive workshops. . All papers related to the field of human behaviour in fire are welcome, however the Programme Committee invites all those interested in this broad research area to join colleagues in Cambridge this autumn to exchange views and ideas in the stunning collegiate setting of Downing College. Committee Members : Karen Boyce, Univ of Ulster, UK - Chair Jason Averill, NIST, USA Dorothy Bruck, Victoria Univ of Tech, Australia Rita Fahy, NFPA, USA Carole Franks, Interscience Communications, UK Hakan Frantzich, Lund Univ, Sweden Edwin Galea, Univ of Greenwich, UK Steve Gwynne, NRCC, Canada Glenn Hedman, Univ of Illinois at Chicago, USA Morgan Hurley, SFPE, USA Erica Kuligowski, NIST, USA Brian Meachem, Worcester Polytechnic Inst, USA Daniel Nilsson, Lund Univ, Sweden Rosaria Ono, Univ of Sao Paulo, Brazil Amanda Robbins, Sereca Fire Consulting, Canada Ai Sekizawa, Tokyo Univ of Science, Japan Jim Shields, Univ of Ulster, UK Tomonori Sano, Waseda Univ, Japan Ian Thomas, Victoria Univ of Technology, Austra lia
http://www.theatlantic.com/magazine/archive/2012/09/burning-question/309057/ Burning Question Why are wildfires defying long-standing computer models? in Share 0 By Michael Behar Marc Piscotty/Reuters Clint Dawson’s bloodshot eyes evince his 14th straight day at the High Park fire’s Incident Command Post, in Fort Collins, Colorado. It is late June, and the fire has already charred 70,000 acres. Dawson’s job is to guess what it will do next. As a fire-behavior analyst, or FBAN , he runs modeling software that predicts where a fire might be headed. When fires behave themselves, such models work well. But wildfires are getting bigger: their average size has tripled since the 1980s. And bigger fires are more complex than smaller ones, presenting more challenges for forecasting software. “We are definitely tweaking our models more on this fire than usual,” Dawson tells me. Since the 1970s, modeling programs such as Farsite, FlamMap, and FSPro have become an essential part of fighting wildfires. The models, which are calibrated against how past fires have typically progressed, consider vegetation type; topography (flames prefer to travel uphill); a fire’s perimeter; and air temperature, wind, and humidity. They then predict where a fire will go, and when. The problem is that nowadays, wildfires are increasingly atypical. For one thing, wildlands aren’t what they once were, thanks in part to climate change and encroaching development. For example, Dawson’s model doesn’t factor in mountain pine beetles. Milder temperatures have led to a beetle onslaught throughout the West, leaving trees desiccated and highly flammable. More generally, extreme weather—for example, droughts that leave forests dry as tinder—means more-extreme fires. What’s more, the historical data informing the models are often many years old. The data omit recent landscape changes that radically alter a fire’s dynamics. Nor are the models sophisticated enough to factor in the presence of today’s slow-burning multi-thousand-square-foot exurban homes, which can smolder like charcoal briquettes and ignite neighboring structures. Suppression of smaller wildfires over the past century has changed forests in fundamental ways. “We’ve been so successful at excluding fire that forests are nearly continuous,” says Mark Finney, a researcher at the Missoula Fire Sciences Laboratory, who develops modeling software. Previously, when most fires were allowed to burn, wildlands were a patchwork of burned and non-burned areas. Without these natural breaks, fires can now grow much larger than they used to. All of these factors combine to spawn what F BAN s call “extreme fire behavior.” Behind Dawson, I see orange smoke mushrooming from a ridgeline high into the sky. Dawson tells me that this indicates a “megafire”—a capricious, untamable beast that frustrates F BAN s. (Colorado saw two megafires in the first half of 2012 alone.) A megafire can create severe weather of its own, befuddling models. Gusty outbursts blow counter to prevailing winds, goading flames downhill when the models predict an upslope burn. Blistering heat flash-dries foliage. In High Park, Dawson told me, “we’ve got mixed conifer up there, but in places it’s burning fast, like chaparral.” Timber stands that models say will burn slowly erupt as if doused with kerosene. Rob Seli, also based at the Missoula lab, explains that many megafires are plume-dominated. And a plume-dominated fire, he says, is “like an atom bomb going off. It can expand rapidly, in any direction. It’s the same thing that happens in a thunderstorm. And models can’t account for this behavior.” Some years from now, improved computing power will surely catch up to today’s fires, yielding models that crunch more variables with more elaborate characteristics—the flammability of different building materials, say, or the complex atmospheric physics involved in plume-dominated fires. (Even the fastest supercomputers we have now would take days to do this.) In the meantime, some experts worry that younger fire analysts lean a bit too heavily on their data-crunching skills, and have little field experience. Dawson is thankful to have spent his early career fighting fires with an ax and a shovel. While working the High Park fire, he trekked into the field every morning to supplement his digital prognosis with some analog intuition. Tim Sexton, who is a strategic planner from the National Interagency Fire Center and worked alongside Dawson, also made a point of visiting the blaze. “The model gives you a place to start. But then go out and look at the fire,” Sexton says. “Because in nature, nothing is ever exact.” Michael Behar is a writer in Boulder, Colorado.
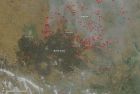
前几天在特区开会, 手机没信号, 每天只能上网15分钟. 看到了这篇文章, 不知道是否已经有人转过来了。 Anyway I will just leave a mark here. From: http://earthobservatory.nasa.gov/IOTD/view.php?id=78256 Wheat Fires in China In mid-June, agricultural fires and industrial pollution combined to leave a thick pall of haze over central China. The Moderate Resolution Imaging Spectroradiometer (MODIS) on NASA’s Terra satellite captured these true-color (top) and false-color (bottom) images of the fires and haze. Both images were acquired at 10:55 a.m. local time (02:55 UTC) on June 13, 2012. Smoke and actively burning fires (shown with red outlines) are visible in the true-color image, as well as a large burn scar. The false-color image reveals details of the burn scar that aren’t readily apparent in the true-color view. Although the burn scar looks uniform, the false-color view indicates that numerous fields with unburned vegetation (shown as green) are scattered throughout the area. The cities of Bozhou, Huaibei, and Suzhou, which appear as gray patches, were the closest cities to actively-burning fires when Terra acquired the images. This area falls within the North China Plain, a fertile and densely-populated region that’s home to about a quarter of China's cultivated land and 35 percent of the country's agricultural yields. The area’s staple crops are wheat and maize, and the two crops are generally grown in rotation. Farmers sow winter wheat in mid-October and harvest it at the end of May. In June, farmers burn the remaining plant residue to fertilize the soil for the upcoming maize crop. About 75 percent of all fires in the North China Plain occur in June. A second peak in fire activity occurs in October after the maize harvest. Smoke from agricultural burning contains a number of substances that pose a hazard to human health, notably black carbon and organic carbon. Fires also emit carbon monoxide and nitrogen oxides (NOx), volatile precursor gases that react to form ground-level ozone. The World Bank estimated in 2007 that about 350,00 to 400,000 people die prematurely each year in China because of outdoor air pollution. Since the 1990s, the number of agricultural fires in the country has decreased because the government began enacting a series of regulations aimed at prohibiting field burning. However, the practice remains common. References BBC. (2007, July 3). China 'Buried Smog Death finding' . Accessed June 13, 2012. Huang, X. (2012, Jan. 5) A High-Resolution Emission Inventory of Crop Burning in Fields in China Based on MODIS Thermal Anomalies/Fire Products. Atmospheric Environment. Li, H. (2010). Agricultural Fire Impacts on the Air Quality of Shanghai During Summer Harvesttime. Aerosols and Air Quality Research. Zhang, H (2008). A Laboratory Study of Agricultural Crop Residue Combustion in China: Emission Factors and Emission Inventory. Atmospheric Environment. 农业用火和工业污染共同造成了华中的雾霾天气。 Terra 卫星上的 MODIS 于六月 13 日当地时间上午 10 : 55 拍摄、观测到的真彩色(上图)和伪彩色(下图)影像。 文中介绍说该区域位于华北平原, 主要作物是小麦和玉米。十月中旬播种冬小麦, 来年五月底收割。 六月农民焚烧秸秆积肥,为种植玉米做准备。华北平原约 75% 的用火发生在六月;十月玉米收割完后用火数量又会显著增加。自 90 年代以来由于政府的管理, 农业用火已有减少, 但秸秆焚烧现象仍很普遍。 几个问题。 1. 卫星影像上能观测到多大范围内的秸秆焚烧现象? 2. 当时附近区域的大气环流情况如何, 污染物如何输送运移到南京 , 甚至武汉? 真彩色影像中, 红色斑点为正在燃烧的火点; 烟雾和黑褐色的过火迹地清晰可见。标出的三个城市为安徽亳州、淮北 和宿州。 伪彩色影像中, 可以看到过火迹地内部还有未燃烧的植被(显绿色)。
 标签: fire