

Evaluation of erastin synergized cisplatin anti-nasopharyngeal carcinoma effect with a glutathione-activated near-infrared fluorescent probe
,,,,,,
aDepartment of Otolaryngology, Head and Neck Surgery, The First Affiliated Hospital of Hainan Medical University, Haikou 570102, China
bKey Laboratory of Hainan Trauma and Disaster Rescue, Key Laboratory of Emergency and Trauma, Ministry of Education, Engineering Research Center for Hainan Bio-Smart Materials and Bio-Medical Devices, College of Emergency and Trauma, Hainan Medical University, Haikou 571199, China
cSichuan Provincial General Hospital of Judicial Police, Chengdu 610225, China
Received 13 April 2023, Revised 2 June 2023, Accepted 6 June 2023, Available online 7 June 2023, Version of Record 24 November 2023.
https://doi.org/10.1016/j.cclet.2023.108658
Abstract
Nasopharyngeal carcinoma (NPC), a malignant tumor originating from the nasopharynx, is one of the common malignant tumors of the head and neck. There are significant geographical differences in the incidence of nasopharyngeal carcinoma, with a high incidence in China and Southeast Asian countries. Herein, we designed and synthesized a novel near-infrared fluorescent (NIRF) probe to detect glutathione (GSH) in cellular and tumor environments using semi-naphthofluorescein (SNAFL) as the fluorescent molecular backbone and 2-fluoro-4-nitrobenzenesulfonate as the recognition moiety. Upon reaction with GSH, SNAFL-GSH emitted a fluorescence signal, and its emission wavelength at 650 nm was remarkably enhanced. The results of selectivity experiments indicated that SNAFL-GSH was able to discriminate GSH from Cys, Hcy, and H2S. Moreover, SNAFL-GSH could image both endogenous and exogenous GSH and distinguish normal and cancer cells by fluorescence signal difference. At the cellular level, cisplatin (DDP)-induced ferroptosis and inhibition of proliferation of various NPC cell lines (CNE2, CNE1, 5–8F cells) by erastin combined with DDP were visualized with the help of SNAFL-GSH. In a mouse tumor xenograft model, we successfully employed SNAFL-GSH for the evaluation of the efficacy of erastin combined with DDP in the treatment of NPC. More importantly, the probe could image cancerous tissue sections from NPC patients with an imaging depth of approximately 80 µm. It was foreseen that SNAFL-GSH offered great potential for application in the diagnosis and evaluation of the therapeutic efficacy of NPC, and these results would also provide new ideas for the clinical treatment of NPC.
Graphical abstract
A highly selective near-infrared fluorescent (NIRF) probe SNAFL-glutathione (GSH) for GSH detection based on a SNAFL fluorophore was designed and synthesized. SNAFL-GSH had the ability to differentiate cancer cells from normal cells and visualize variations in GSH concentration levels during drug erastin, cisplatin (DDP), or erastin plus DDP induction.

Numerous techniques have been employed to measure GSH in biological samples, including Raman spectroscopy, high- performance liquid chromatography (HPLC), mass spectrometry, etc . [ 17 , 18 ]. These analytical methods are not well-suited for real- time detection of GSH in live cells and in vivo due to the com- plex pre-treatment and long analysis time required. In order to improve the comprehension of GSH, there is a need to develop strategies capable of monitoring GSH in biosystems. Until now, considerable effort s have been devoted to the development of ef- fective fluorescent probes for tracking GSH in biosystems [19–22] . In light of the sensing mechanism, GSH fluorescent probes involve S-O bond cleavage [23–25] , nucleophilic aromatic substitution [26–31] , Michael addition [32–34] , disulfide bond cleavage [35] , and so on [36–40] . Some of these reported probes are still limited by long response times and poor selectivity, which makes it still challeng- ing to design fluorescent probes with high specificity and rapid response to GSH. Furthermore, there are no available fluorescent probes for dynamic visual monitoring of the efficacy of erastin syn- ergistic DDP for NPC treatment. In this contribution, we fabricated a highly selective near- infrared fluorescent (NIRF) probe for GSH detection and in vivo imaging based on a semi-naphthofluorescein (SNAFL) fluo- rophore. Because the hydroxyl group of the SNAFL fluorophore was masked by the electron-withdrawing group 2-fluoro-4- nitrobenzenesulfonyl, making its intramolecular charge transfer (ICT) hindered, SNAFL-GSH barely fluoresces in the absence of GSH. The addition of GSH triggered the release of the fluorophore, caus- ing a strong fluorescent signal. Using this probe, we monitored changes in GSH levels in cells and tumor-bearing mice. The re- sults showed that DDP induces ferroptosis in cancer cells, while erastin enhanced the therapeutic effect of DDP on tumor-bearing mice. It is well known that fluorescent probes emitting light in the near-infrared (NIR) range (650–900 nm) are more desirable for in vivo imaging [41–46] . SNAFL fluorophores featured high fluo- rescence quantum efficiency, photostability, and excellent cell per- meability and were often employed in the design of fluorescent probes [ 47 , 48 ]. By attaching 2-fluoro-4-nitrobenzenesulfonyl chlo- ride to the SNAFL fluorophore, we synthesized the NIR fluorescent probe SNAFL-GSH. Compared to the previously widely reported 2,4-dinitrobenzenesulfonate, 2-fluoro-4-nitrobenzenesulfonate ex- hibited higher selectivity for GSH [49–52] . As presented in Figs. 1 a and b, the electron-withdrawing group 2-fluoro-4-nitrobenzene sulfonyl effectively inhibited ICT in the structure of SNAFL and quenches the fluorescence emission of SNAFL-GSH. In the presence of GSH, GSH nucleophilically attacked the 2-fluoro-4-nitrophenyl group and triggered intense NIR fluorescence emission by specif- ically cleaving the C-S bond to restore the push-pull electron sys- tem in SNAFL. In addition, recording the change in fluorescence in- tensity of SNAFL-GSH at 650 nm allowed the quantification of GSH. To verify the reaction mechanism of SNAFL-GSH with GSH, mass spectrum was performed. As seen in Figs. S6 and S7 (Supporting information), the reaction of SNAFL-GSH with excess GSH resulted
in the observation of the major molecular ion peak at 437.1643, which was attributed to SNAFL. The chemical structure of SNAFL and SNAFL-GSH was confirmed by nuclear magnetic resonance ( 1 H NMR, 13 C NMR), high resolution mass spectroscopy (HRMS), and the characterization profiles were provided in the Supporting in- formation (Figs. S1–S5 in Supporting information).
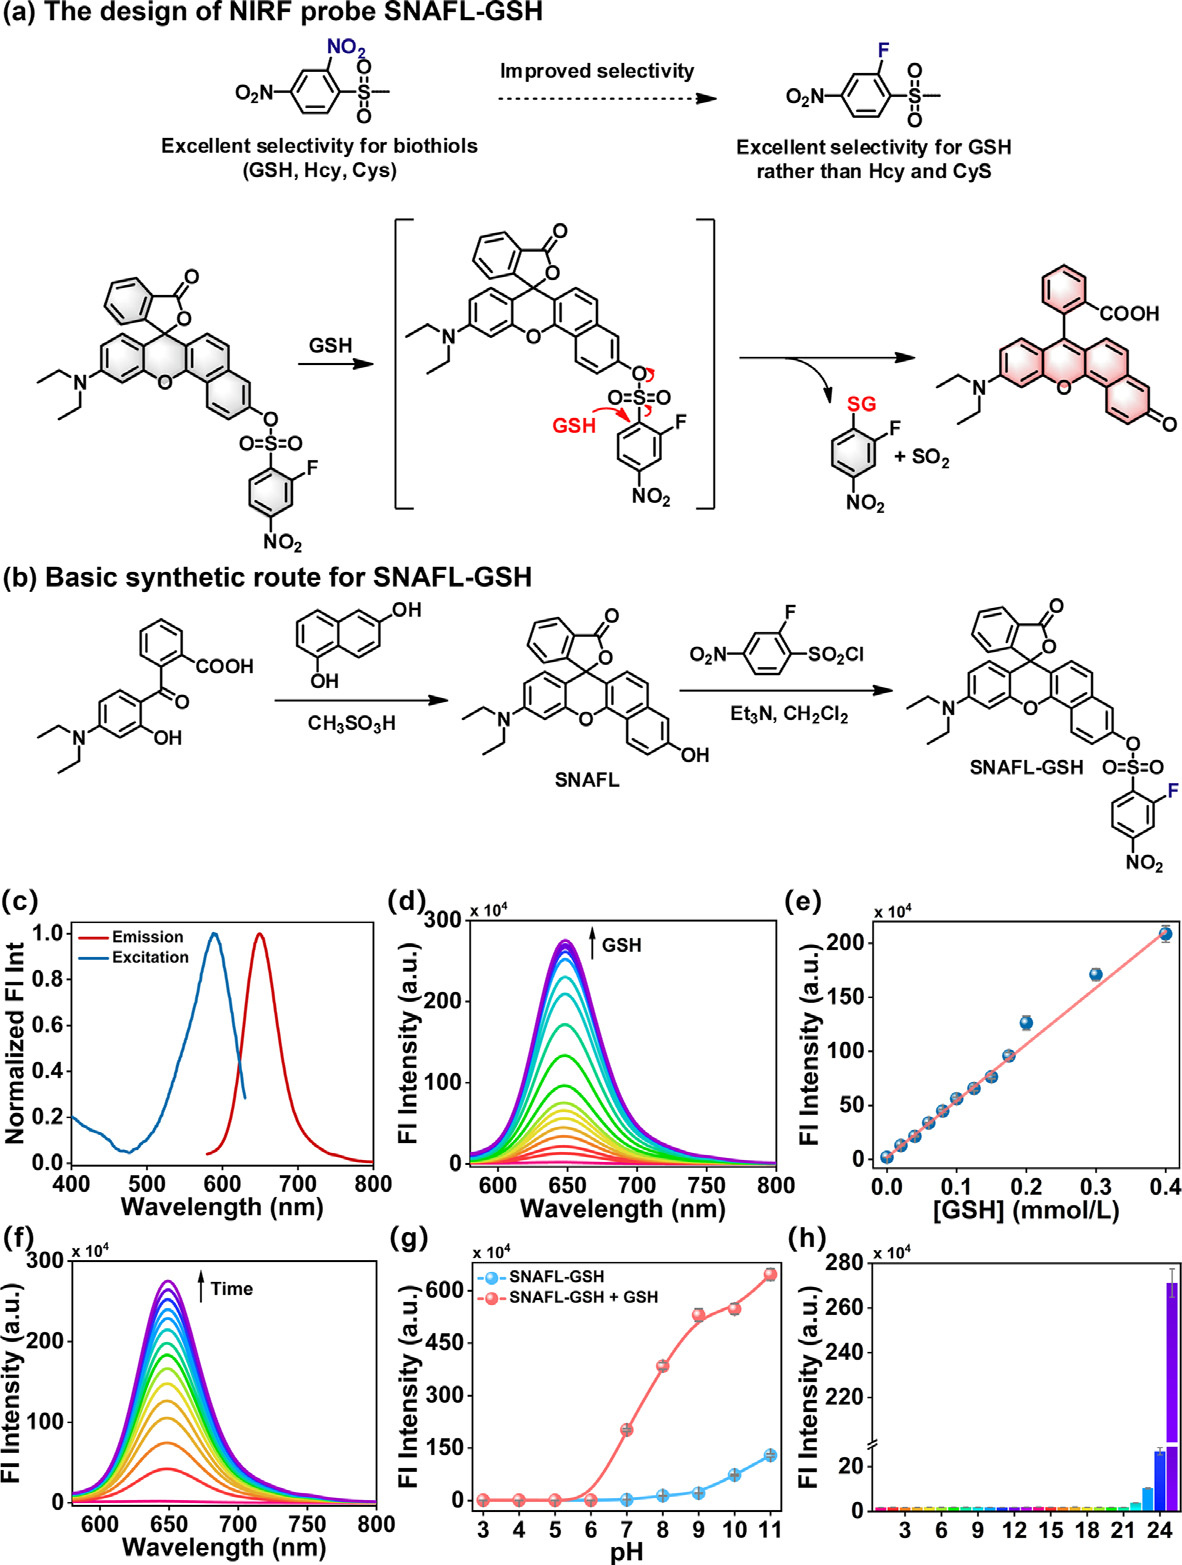
Fig. 1. (a) The design of NIRF probe SNAFL-GSH. (b) Basic synthetic route for SNAFL-GSH. (c) Normalized excitation and fluorescence emission spectra of SNAFL-GSH (10 μmol/L) in the presence of GSH (1 mmol/L). (d) The fluorescence spectra of SNAFL-GSH (10 μmol/L) with the treatment of varied levels of GSH (0–1 mmol/L). (e) Linear fitting curve of fluorescence intensities at 650 nm against GSH concentration from 0 to 0.4 mmol/L. (f) The fluorescence spectra of SNAFL-GSH with the addition of GSH (1 mmol/L) for various time from 0 min to 20 min. (g) Fluorescence intensities at 650 nm of SNAFL-GSH in the absence or presence of GSH (1 mmol/L) under different pH values (3.0–11.0). (h) Fluorescence intensities at 650 nm of SNAFL-GSH upon the treatment of different analytes. From 1 to 24: blank, Lys (1 mmol/L), Gly (1 mmol/L), Met (1 mmol/L), Trp (1 mmol/L), Pro (1 mmol/L), Leu (1 mmol/L), Ser (1 mmol/L), Val (1 mmol/L), Arg (1 mmol/L), HSO 3 −(100 μmol/L), SO 4 2 −(100 μmol/L), CO 3 2 −(100 μmol/L), NO 3 −(100 μmol/L), K + (100 μmol/L), Na + (100 μmol/L), Mg 2 + (100 μmol/L), Zn 2 + (100 μmol/L), H 2 O 2 (100 μmol/L), ClO −(100 μmol/L), GSSG (1 mmol/L), H 2 S (50 μmol/L), Hcy (50 μmol/L), Cys (200 μmol/L), GSH (1 mmol/L). The data were shown as mean ±standard deviation (s.d.) ( n = 3). λex = 560 nm, λem = 580–800 nm.
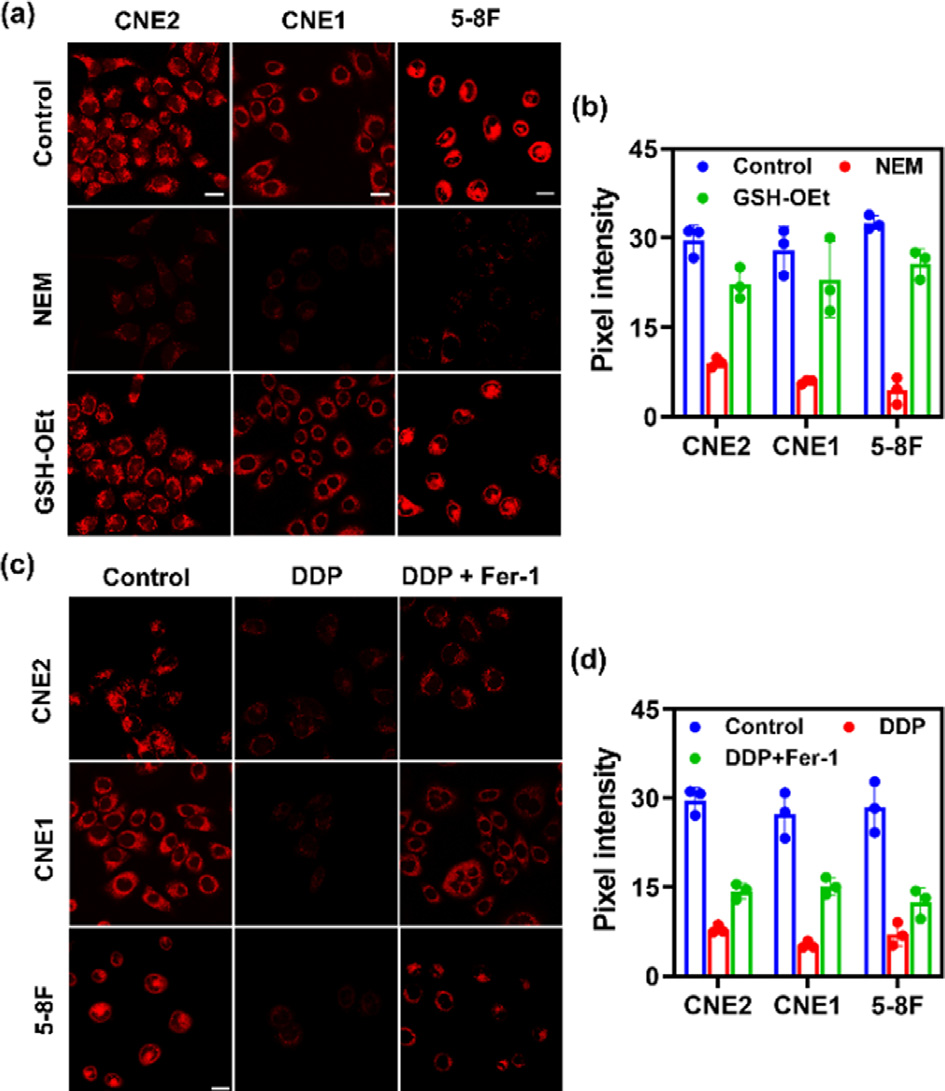
Fig. 2. Fluorescence images of GSH in various NPC cell lines (CNE2, CNE1, 5–8F cells). (a) Control group: fluorescence imaging of GSH in CNE2, CNE1, 5–8F cells with the addition of SNAFL-GSH (10 μmol/L) for 20 min; NEM group: fluorescence imaging of GSH in CNE2, CNE1, 5–8F cells with the sequential addition of NEM (1 mmol/L) and SNAFL-GSH (10 μmol/L); GSH –OEt group: fluorescence imaging of GSH in CNE2, CNE1, 5–8F cells with the sequential addition of NEM (1 mmol/L), GSH –OEt (1 mmol/L) and SNAFL-GSH (10 μmol/L). Scale bar: 20 μm. (b) Pixel inten- sity of images in (a). The data were shown as mean ±s . d. ( n = 3). Fluorescence im- ages of GSH in various cell lines (CNE2, CNE1, 5–8F cells) during DDP-induced fer- roptosis. (c) Control group: fluorescence imaging of GSH in CNE2, CNE1, 5–8F cells with the addition of SNAFL-GSH (10 μmol/L) for 20 min; DDP group: fluorescence imaging of GSH in CNE2, CNE1, 5–8F cells with the sequential addition of DDP (20 μmol/L, 24 h) and SNAFL-GSH (10 μmol/L); DDP/Fer-1 group: fluorescence imaging of GSH in CNE2, CNE1, 5–8F cells with the sequential addition of DDP (20 μmol/L) plus Fer-1 (5 μmol/L), and SNAFL-GSH (10 μmol/L). Scale bar: 20 μm. (d) Pixel inten- sity of images in (c). The data were shown as mean ±s . d. ( n = 3). λex = 561 nm; red channel: λem = 60 0–70 0 nm.
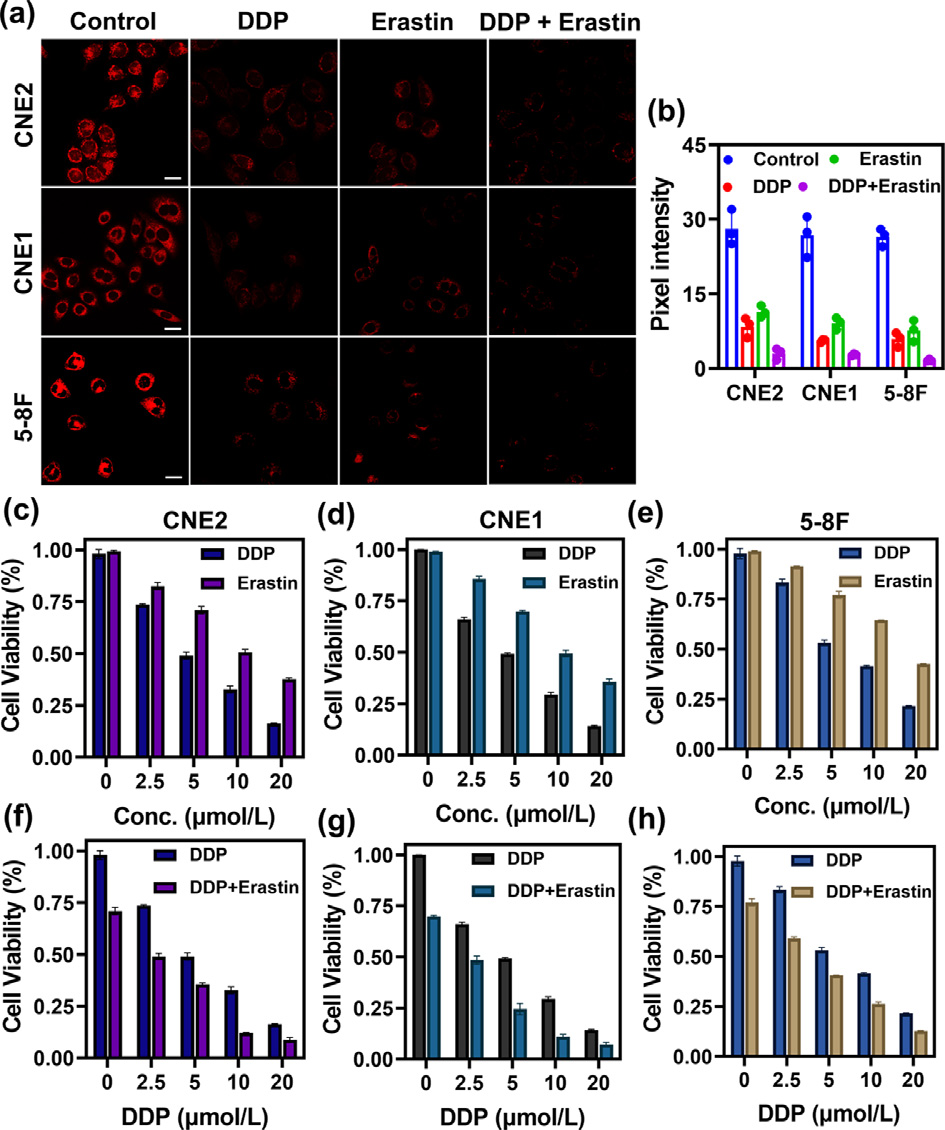
Fig. 3. Fluorescence images of GSH in various cell lines (CNE2, CNE1, 5–8F cells) under different drug treatments (DDP, erastin, DDP plus erastin). (a) Control group: fluorescence imaging of GSH in CNE2, CNE1, 5–8F cells with the addition of SNAFL- GSH (10 μmol/L) for 20 min; DDP group: fluorescence imaging of GSH in CNE2, CNE1, 5–8F cells with the sequential addition of DDP (20 μmol/L, 24 h) and SNAFL- GSH (10 μmol/L); Erastin group: fluorescence imaging of GSH in CNE2, CNE1, 5–8F cells with the sequential addition of erastin (5 μmol/L) and SNAFL-GSH (10 μmol/L); DDP/Erastin group: fluorescence imaging of GSH in CNE2, CNE1, 5–8F cells with the sequential addition of DDP (20 μmol/L) plus erastin (5 μmol/L), and SNAFL-GSH (10 μmol/L). Scale bar: 20 μm. (b) Pixel intensity of images in (a). The data were shown as mean ±s . d. ( n = 3). λex = 561 nm; red channel: λem = 60 0–70 0 nm. Erastin syn- ergizes with DDP to increase cytotoxicity to various nasopharyngeal carcinoma cells (CNE2, CNE1, 5–8F cells). (c–e) CNE2, CNE1, 5–8F cells were treated with different concentrations (0, 2.5, 5, 10, 20 μmol/L) of DDP or erastin for 24 h, respectively. (f–h) CNE2, CNE1, and 5–8F cells were treated with different concentrations (0, 2.5, 5, 10, 20 μmol/L) of DDP in the presence of erastin (5 μmol/L). The data were shown as mean ±s . d. ( n = 3).

Fig. 4. In vivo imaging of GSH levels in the process of different drug treatments. (a) NIRF images of erastin-treatment, DDP-treatment, and erastin plus DDP-treatment groups of 5–8F-tumor-bearing BALB/c mice after intratumoral injection of SNAFL-GSH (50 μmol/L, 50 μL). (b) H&E staining of tumors after erastin, DDP, erastin plus DDP treatment. Scale bar: 200 μm. (c) Quantified average fluorescence intensity in the tumor region. Data were expressed as mean ±s.d. ( n = 3). Statistical analysis was conducted with multiple t -tests ( ∗P < 0.01, ∗∗P < 0.001, ∗∗∗P < 0.001).
In summary, we designed and synthesized a novel NIRF probe SNAFL-GSH with exclusive selectivity for GSH. In in vitro experi- ments, SNAFL-GSH itself had almost no fluorescence but showed dramatic fluorescence enhancement in the presence of GSH. The enhanced fluorescence of SNAFL-GSH was generated from the cleavage of 2-fluoro-4-nitro sulfonate to release the fluorophore SNAFL. Given the low cytotoxicity, SNAFL-GSH was exploited for NIRF imaging of GSH in cells and tumor-bearing mice in vivo . SNAFL-GSH had the ability to differentiate cancer cells from nor- mal cells and visualize variations in GSH concentration levels dur- ing drug erastin, DDP, or erastin plus DDP induction. Moreover, SNAFL-GSH enabled the evaluation of antitumor drugs and imaging of human NPC tissue sections. With the assistance of SNAFL-GSH, we confirmed erastin synergized with DDP was more effective than DDP administration alone in treating tumors. Notably, SNAFL-GSH might be a particularly suitable tool for tracking the tumor treat- ment process and screening of antitumor drugs.
转载本文请联系原作者获取授权,同时请注明本文来自于法标科学网博客。
链接地址:https://m.sciencenet.cn/blog-2438823-1413716.html?mobile=1
收藏