博文
ggplot2实现散点图上文字的添加
||||
数据准备:
实现代码:
library("ggplot2")
png("./pcr.png")
data=read.table("pcr.csv",header=T)
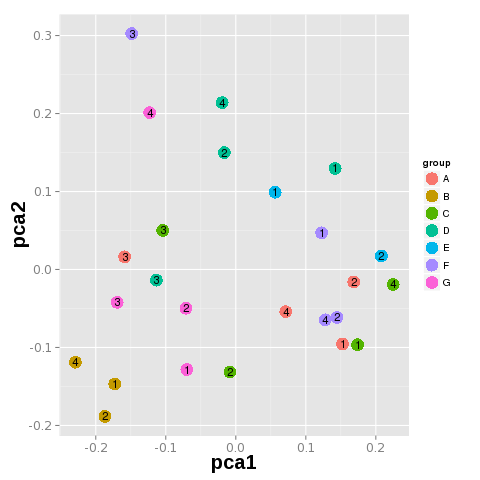
p<-ggplot(data,aes(x=pca1,y=pca2,group=group))+scale_shape_manual(values=c(0,1,2,3,4,5,6,7,8)) + geom_point(size=6,aes(colour=group))+geom_text(label=paste(data$date),colour="black",size=4)
p+theme(axis.title.x=element_text(face="bold",family="Arial",size=20),axis.title.y=element_text(face="bold",family="Arial",size=20),axis.text.x=element_text(family="Microsoft YaHei", size=12), axis.text.y=element_text (family="Microsoft YaHei",size=12))
dev.off()
最终图表
https://m.sciencenet.cn/blog-306699-1027071.html
上一篇:ggplot2实现散点折线图
下一篇:益生菌和致病菌的数据库