博文
alpha多样性指数绘图
||
#参考原文链接https://mp.weixin.qq.com/s/Cb5NqNWCqXvGsrm5BdTyDA
rm(list=ls())
install.packages("pacman")
#library(devtools)
library(pacman)
pacman::p_load(tidyverse,phyloseq,MicrobiotaProcess,ape,
patchwork,ggpubr,ggsci)
otu_mat <- read.delim2("otu_table.tsv",header=T,
sep="\t",check.names = F,row.names = 1) %>%as.matrix()
tax_mat <- read.delim("taxa.xls",header=T,row.names = 1,
sep="\t",check.names = F) %>% as.matrix()
samples_df <- read.delim("group.xls",header = T,row.names = 1,
sep="\t",check.names = F)
tree <- read.tree("rooted_tree.tre")
OTU = otu_table(otu_mat,taxa_are_rows =T)
TAX = tax_table(tax_mat)
samples = sample_data(samples_df)
ps <- phyloseq(OTU,TAX,samples,tree)
ps
alphaobj <- get_alphaindex(ps)
head(as.data.frame(alphaobj))
write.table(alphaobj,file="alpha.xls",sep="\t",col.names = NA)
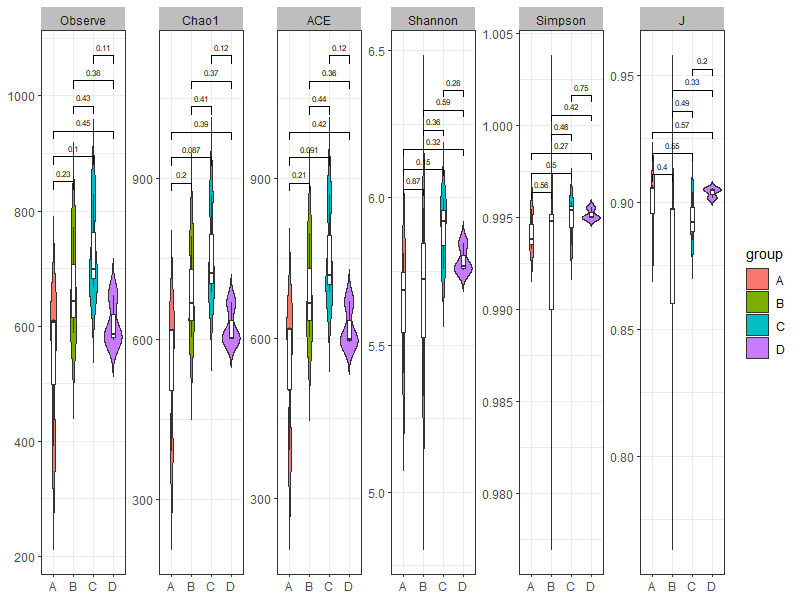
p_alpha <- ggbox(alphaobj, geom="violin",factorNames="group"
,testmethod = "t.test")+
theme(strip.background = element_rect(colour=NA, fill="grey"))
p_alpha
theme_niwot <- function(){
theme_bw()+
theme(strip.text.x = element_text(colour ="black",size=12),
axis.text.x = element_text(family = "Times",size=10),
axis.text.y = element_text(family = "Times",size=10),
legend.position = "non")}
#method:比较的方法,默认为"wilcox.test",
#其他可选方法为:"t.test"、"anova"、"kruskal.test"
my_comparisons <- list(c("A", "B"), c("A", "C"))
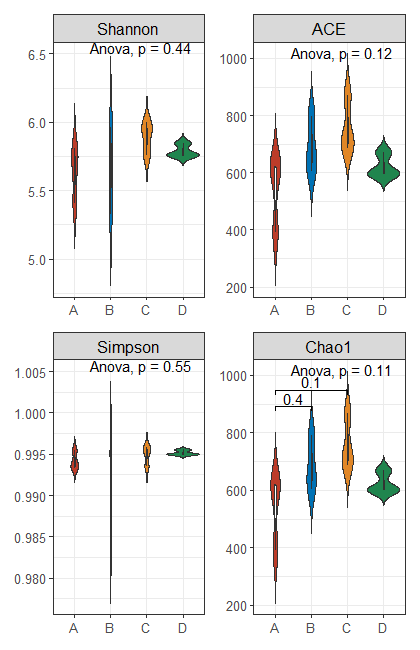
Shannon <- alphaobj %>% as.data.frame() %>%
select(Shannon,group) %>%
mutate(V4="Shannon") %>%
ggplot(aes(group,Shannon))+
geom_violin(aes(fill=group),trim=F)+
geom_boxplot(width=0.03,fill="white")+
xlab(NULL)+ylab(NULL)+
scale_fill_nejm()+
facet_grid(.~V4,scales = "free",space="free_x")+
stat_compare_means(method = "anova",label.y =6.5,label.x = 2)+
theme_niwot()
Chao1 <- alphaobj %>% as.data.frame() %>%
select(Chao1,group) %>%
mutate(V4="Chao1") %>%
ggplot(aes(group,Chao1))+
geom_violin(aes(fill=group),trim=F)+
geom_boxplot(width=0.03,fill="white")+
xlab(NULL)+ylab(NULL)+
scale_fill_nejm()+
facet_grid(.~V4,scales = "free",space="free_x")+
stat_compare_means(comparisons=my_comparisons)+ # Add pairwise
stat_compare_means(method = "anova",label.y =1000,label.x = 2)+
theme_niwot()
ACE <- alphaobj %>% as.data.frame() %>%
select(ACE,group) %>%
mutate(V4="ACE") %>%
ggplot(aes(group,ACE))+
geom_violin(aes(fill=group),trim=F)+
geom_boxplot(width=0.03,fill="white")+
xlab(NULL)+ylab(NULL)+
scale_fill_nejm()+
facet_grid(.~V4,scales = "free",space="free_x")+
stat_compare_means(method = "anova",label.y = 1000,label.x = 2)+
theme_niwot()
Simpson <- alphaobj %>% as.data.frame() %>%
select(Simpson,group) %>%
mutate(V4="Simpson") %>%
ggplot(aes(group,Simpson))+
geom_violin(aes(fill=group),trim=F)+
geom_boxplot(width=0.03,fill="white")+
xlab(NULL)+ylab(NULL)+
facet_grid(.~V4,scales = "free",space="free_x")+
scale_fill_nejm()+
stat_compare_means(method = "anova",label.y =1.005,label.x = 2)+
theme_niwot()
Shannon+ACE+Simpson+Chao1+plot_layout(ncol =2)
https://m.sciencenet.cn/blog-3448646-1270947.html
上一篇:鸢尾花PCA分析与绘图
下一篇:qiime2的richness指数