宁静致远分享 http://blog.sciencenet.cn/u/gghgiser

博文

VBA+ArcObjects读取ArcGIS中栅格像元值

已有 7265 次阅读 2010-11-14 18:26 |个人分类:科研学习|系统分类:科研笔记|关键词:学者| ArcGIS, ArcObjects, 栅格像元值

       关键词:ArcObject,ArcGIS,栅格像元值(遥感图像)读取,样带,Excel,Matlab。

       遥感影像以缩微的形式记录地表特征,已被广泛应用于区域土地覆被变化等研究当中。每幅遥感数据都是一个数据矩阵,这与很多科学软件的数据格式有共同之处(如Matlab、Excel)。任何专业软件都有其突出的有点和明显的缺陷,一般的遥感处理软件(如ERDAS或ENVI)都是针对栅格数据的,或实现矢量数据的一般功能。所以,不同软件之间高精度数据迁移转换是日常科研当中的重要任务。本文以NDVI为例,基于ArcObject+VBA在ArcGIS环境中编写程序,生成NDVI样带数据序列,为日后在Matlab中进行数据分析调定基础。

       背景:时间序列数据分析在地理学研究当中是一种常用的地理过程研究方法,GIS以其强大的能力能够有效处理空间问题,把GIS与时间序列分析方法相结合,根据其共性发展出一种空间序列分析方法。在空间序列方法中,以空间位置代表时间位置,而空间位置上的属性变量的表达方式与时间序列相一致。其实,空间序列方法有其地理学的传统名词——样带。

       需求分析:提取NDVI影像上的数据样带NDVI值,生成一维空间序列数据,使其能在EXCEL或Matlab中进行数据分析。

代码思路:

1)用线数据集Clip影像,生成样带数据,数据中只有线数据集覆盖下的范围融合NDVI值;

2)循环计算栅格影像各行数据,当像元值大于0时则记录该值,否则跳过。(AO的PixelBlock每128行跳过一次);

3)将记录好的数据保存在txt中。(Excel和Matlab支持文本数据导入。)

实现代码:

' Part 1: Define the temporary raster data.
    Dim pMxDoc As IMxDocument
    Dim pMap As IMap
    Dim pRasterLy As IRasterLayer
    Dim pRaster As IRaster
    Dim pRasBandC As IRasterBandCollection
    Dim pRasterDS As IRasterDataset
   
    Set pMxDoc = ThisDocument
    Set pMap = pMxDoc.FocusMap
    ' Get the raster from the raster layer.
    Set pRasterLy = pMap.Layer(0)
    Set pRaster = pRasterLy.Raster
   
    ' Set the raster dataset to be the first band of the raster
    Set pRasBandC = pRaster
    Set pRasterDS = pRasBandC.Item(0).RasterDataset
   
    Dim pRasterCursor As IRasterCursor
    Dim pRaster1 As IRaster2
   
    Set pRaster1 = pRasterDS.CreateDefaultRaster
    Set pRasterCursor = pRaster1.CreateCursorEx(Nothing)
  
   
    'use IRasterEdit interface
    Dim pRasterEdit As IRasterEdit
    Set pRasterEdit = pRaster1
   
    'loop through each pixel block in the raster.
    Dim pPB As IPixelBlock3
    Dim PixelBlockWidth As Long, PixelBlockHeight As Long
   Dim pTLC As IPnt
    Dim pBandCol As IRasterBandCollection
   
    Set pBandCol = pRasterDS
    '''''''''''''''
    Dim v As Double
    Dim i As Integer
    Dim j As Integer
    Dim length As Integer
    length = 0
   
    Dim VAL1(2890) As Double

    '1990=2959        ‘这里要实现计算样带中的非零值个数 
    '2000=2961
    '2005=2890
    Do
        Set pPB = pRasterCursor.PixelBlock
            For i = 0 To pPB.Width - 1
                For j = 0 To pPB.Height - 1
                    v = pPB.GetVal(0, i, j)
                    If v <> 0 Then         ’如果像元值不为零,则存入数据集中

                        VAL1(length) = v
                        length = 1 + length
                    End If
                Next j
            Next i

    Loop While pRasterCursor.Next = True
   
    MsgBox length
'
    Dim l As Integer

    l = length

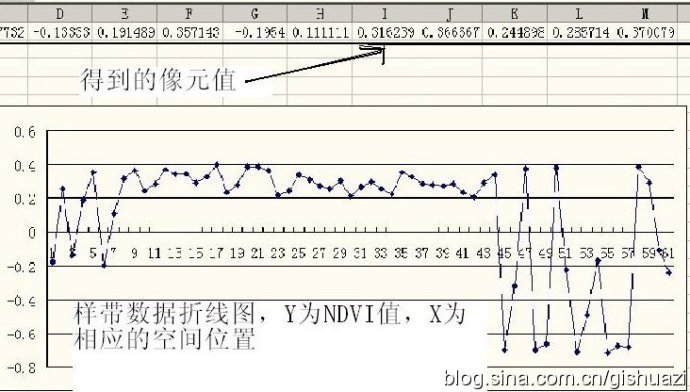
    Open "c:ndvi05.txt" For Output As #1      ‘记入文本
    For i = 0 To l - 1 Step 1
        Print #1, "," & VAL1(i);

    Next i

    Close #1
'
End Sub


相关截图:

1)ArcGIS图示效果


2)Excel数据显示(其中一段)


3)Matlab中显示效果(整个数据样带)


原文于新浪博客 2010-10-21


https://m.sciencenet.cn/blog-500362-383732.html

上一篇:人生四行
下一篇:下一步研究工作:城市热环境

0

发表评论 评论 (0 个评论)

数据加载中...
扫一扫,分享此博文

Archiver|手机版|科学网 ( 京ICP备07017567号-12 )

GMT+8, 2024-5-18 08:15

Powered by ScienceNet.cn

Copyright © 2007- 中国科学报社

返回顶部