博文
英国专家引用了我的论文,并同样发出了流感大流行的预警!
||||
昨天收到一个英国专家发的一封邮件,通知我他编的书引用了我的论文,并且将全球即将发生流感大流行的预警信息发到了世界卫生组织,美国CDC, 英国卫生部和中国CDC。希望流感大流行的太阳黑子学说能够持续引起世界的关注和科学界的重视,以便于全球能够早日建立基于宇宙空间环境监测的流感大流行预警系统,及早加强应对和减轻大流行对人类的危害!
流感大流行的科学解释
http://blog.sciencenet.cn/blog-529903-1093648.html
http://blog.sciencenet.cn/blog-529903-1149106.html
Cold Climates and Extremes of Solar Activity Portend Pandemic Flu Outbreaks
The odds of a pandemic flu outbreak are small, and yet pandemics happen more frequently around 11-year sunspot minima and maxima, and during cold climate phases (see Figure 14.1).
According to the scientific literature, there were 24 pandemics and 29 major or regional influenza epidemic outbreaks between 1500 and 2009.[i],[ii],[iii],[iv],[v],[vi] There were three pandemics during the 20th century—in 1918, 1957, and 1968, and one in the 21st century (2009)—so far, that is.
To investigate pandemic flu outbreaks and their association with climate change and solar activity, I conducted my own epidemiological study. This study utilized Greenland ice core and Northern Hemisphere climate data, and influenza pandemic and epidemic outbreak data compiled from the scientific literature between 1500 (or 1700) and today.
The standout finding across the different solar activity, cosmic ray, and climate-related data studied (collectively “solar activity and climate parameters”), was that 76 percent of all influenza-A pandemic and major regional epidemic outbreaks during the Little Ice Age took place at a peak or trough in these solar activity and climate parameters, or within a year of one.
Half of influenza-A pandemics and epidemics (22/45) between 1610 and 2000 occurred when both the Northern Hemisphere temperature and total solar irradiance anomalies were negative, which corresponded with the troughs of the Little Ice Age’s grand solar minimum periods. In other words, grand solar minima pose increased risk for pandemic influenza-A outbreaks.
[i] B. Lina, 2008, “History of Influenza Pandemics.” In: Raoult D., Drancourt M. (eds) Paleomicrobiology. Springer, Berlin, Heidelberg. https://doi.org/10.1007/978-3-540-75855-6_12.
[ii] E. Tognotti, 2009, “Influenza pandemics: a historical retrospect.” Journal of Infection in Developing Countries, 3:331-334. doi: https://doi.org/10.3855/jidc.239.
[iii] C. Potter, 2001, “A history of influenza.” Journal of Applied Microbiology, 91: 572-579. doi:10.1046/j.1365-2672.2001.01492.x.
[iv] J.K. Taubenberger and D.M. Morens, “1918 Influenza: the Mother of All Pandemics.” Emerging Infectious Diseases. 2006;12(1):15-22. doi:10.3201/eid1201.050979.
[v] Edwin D. Kilbourne, Influenza. Chapter 1; History of Influenza. Springer Science & Business Media, 6/12/2012 - Medical. ISBN 978-1-4684-5239-6.
[vi] Svenn-Erik Mamelund, “Influenza, Historical.” December 2008. International Encyclopedia of Public Health, First Edition (2008), vol. 3, pp. 597-609. DOI: 10.1016/B978-012373960-5.00372-5.
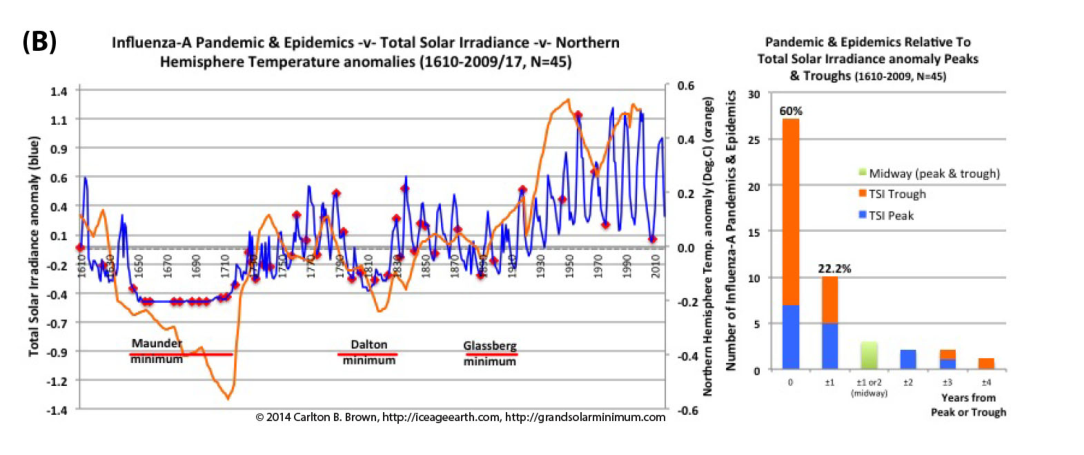
Figure 14.1 (A-B). Historical pandemic and epidemic influenza-A epidemiological data used in Figures 5.1 A-B and citations C to F were extracted from six scientific publications reviewing the history of influenza (see citation), providing a general consensus on pandemic flu outbreaks (and major regional epidemics) back to 1500. Climate and solar activity data started in either 1500 or 1700 and the end dates varied, meaning the number of pandemic events varied (N = 35 to 53). A) Seventy-four percent of influenza pandemics and epidemics (26/35) since 1700 CE occurred at or within one year of the peak or trough in sunspot numbers, increasing to 89 percent (31/35) within two years. The average sunspot number for pandemics occurring at sunspot number troughs was 12 (18 for pandemics
occurring within one year of a sunspot number trough). The 2018 sunspot number was 22. 1463 Conclusion A: Based on sunspot numbers, we are approaching a high-risk period for pandemic flu. B) Between 1610 and 2000, eighty-two percent of influenza pandemics and epidemics (37/45)
occurred at or within one year of a peak or trough in the total solar irradiance anomaly. Sixty-four percent (29/45) of influenza pandemics and epidemics occurred during a negative Northern Hemisphere temperature anomaly. Half of outbreaks (22/45) occurred when both the Northern
Hemisphere temperature and total solar irradiance anomaly were negative, which corresponds with the trough of grand solar minimum periods. Negative anomalies resulted when the temperature or irradiance value was less than the 1610-2000 average for that parameter. Conclusion B: Grand
solar minimum periods associated with a colder climate pose increased risks for pandemic flu outbreaks.

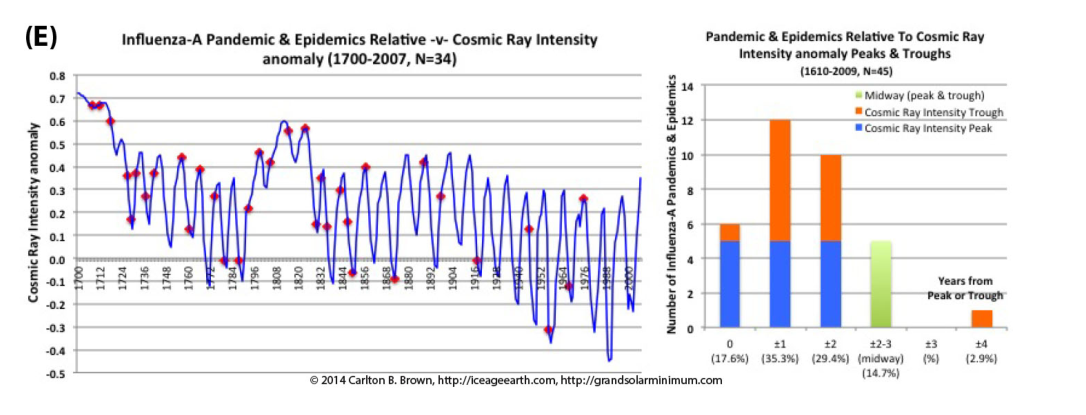
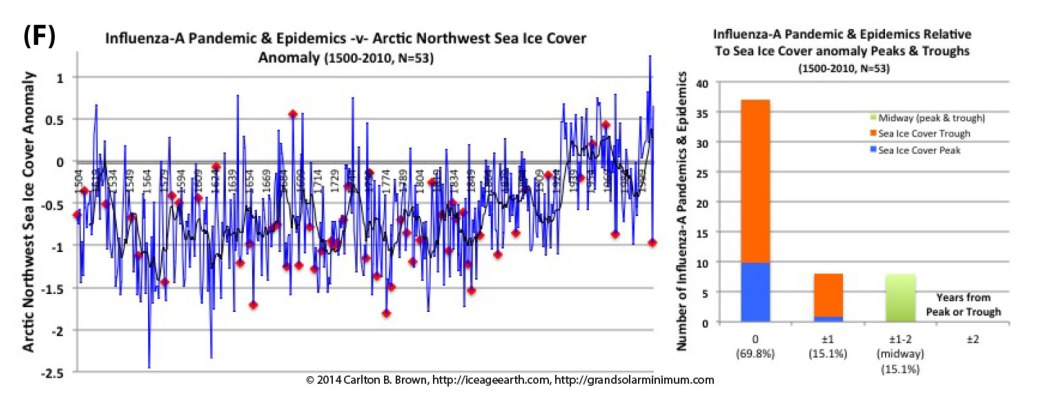
Figures 14.1.C to 14.1.F. The percentage of influenza pandemic and epidemic outbreaks occurring at or within one year of the peak or trough are: C) Beryllium-10 concentration anomaly, 85 percent (44/52) since 1500. D) Total solar irradiance anomaly, 82 percent (37/45) since 1500. E) Cosmic ray intensity anomaly, 53 percent (18/34) since 1700. F) Sea-ice cover anomaly, 85 percent (45/53) since 1500. Arctic algal growth declines when increasing sea-ice blocks the sunlight reaching the ocean floor. Anomalies were calculated relative to the 1961-1990 average for total solar irradiance, cosmic ray intensity, and sea-ice cover, whereas the anomaly is calculated relative to the 1960-1985
average for the Beryllium-10 concentration. 1464
The Arctic Circle, Migrating Birds, and Viral Mutation
There is a small amount of scientific literature available on influenza-A viral mutation and solar activity, and their links to pandemic flu outbreaks.
My research summary for pandemic flu outbreaks presented above indicates that there is a range of climate- and solar-related parameters associated with normal population health i.e., fewer pandemics. Extremes of these parameters appear to be associated with more pandemics and major regional influenza epidemics.
Using similar methods, the above research findings broadly replicate other researchers’ data for pandemic flu outbreaks (sunspot numbers). One researcher determined that the relationship between pandemic flu outbreaks since 1700 and the peaks and troughs of sunspot numbers during the 11-year cycle (± 1 year) was statistically significant compared with other times of the 11-year solar cycle. 1465 My research builds on this researcher’s data with a broader array of solar activity and climate-related parameters, all showing the same peak and trough relationship with high frequency (see Figure 14.1.A-C).
According to other publications, influenza pandemics, 1466,1467 influenza-A viral mutation, 1468 and Ebola hemorrhagic fever outbreaks in Africa 1469 were all associated with the peaks and troughs of the 11-year sunspot cycle. Interestingly, some of the earliest mutations of the surface proteins of
influenza-A viruses, which helped create today’s family of viral strains, coincided with two grand solar minima during the Little Ice Age. According to scientists using advanced methods of genetic analysis, these influenza-A viral mutations took place between 1672 and 1715 CE (Maunder
Minimum), and between 1825 and 1868 CE (Dalton minimum). 1470 This adds further support to the hypothesis that grand solar minima represent high-risk times for influenza-A virus mutation and pandemics.
Influenza-A viral genomes are known to be responsive to earth’s magnetism (geomagnetism). This geomagnetism is known to alter influenza-A viral gene expression (switching on and off) and protein synthesis. 1471 High- energy cosmic rays are guided by earth’s magnetic field into the polar
regions, 1472 thus concentrating their effects in the Arctic, which migrating birds visit annually. This would putatively provide a source of concentrated ionizing radiation and magnetism to which migrating bird populations and their vulnerable egg embryos are exposed. The ioninizing radiation and magnetism could in turn help mediate viral mutation processes.
This research data is suggestive of a causal relationship, and highlights environmental risk factors and potential biological mechanisms that could contribute to avian influenza-A virus mutation. Drug regulators, government, and WHO could modify their perception of risk based on this epidemiological information. This could then help them make the decision to implement pre-pandemic immunization for the willing, at risk public (see the discussion below).

https://www.researchgate.net/publication/328726073_Revolution_Ice_Age_Re-Entry.
https://m.sciencenet.cn/blog-529903-1150349.html
上一篇:为什么说北半球即将到来的流感季仍然会很严重?
下一篇:万事俱备,只欠东风:厄尔尼诺即将引发流感大流行?