博文
[转载]python中plot各种linestyles
|||
refer to: https://matplotlib.org/examples/lines_bars_and_markers/linestyles.html
lines_bars_and_markers example code: linestyles.py
"""==========Linestyles==========This examples showcases different linestyles copying those of Tikz/PGF."""import numpy as npimport matplotlib.pyplot as pltfrom collections import OrderedDictfrom matplotlib.transforms import blended_transform_factorylinestyles = OrderedDict(
    [('solid',               (0, ())),
     ('loosely dotted',      (0, (1, 10))),
     ('dotted',              (0, (1, 5))),
     ('densely dotted',      (0, (1, 1))),

     ('loosely dashed',      (0, (5, 10))),
     ('dashed',              (0, (5, 5))),
     ('densely dashed',      (0, (5, 1))),

     ('loosely dashdotted',  (0, (3, 10, 1, 10))),
     ('dashdotted',          (0, (3, 5, 1, 5))),
     ('densely dashdotted',  (0, (3, 1, 1, 1))),

     ('loosely dashdotdotted', (0, (3, 10, 1, 10, 1, 10))),
     ('dashdotdotted',         (0, (3, 5, 1, 5, 1, 5))),
     ('densely dashdotdotted', (0, (3, 1, 1, 1, 1, 1)))])plt.figure(figsize=(10, 6))ax = plt.subplot(1, 1, 1)X, Y = np.linspace(0, 100, 10), np.zeros(10)for i, (name, linestyle) in enumerate(linestyles.items()):
    ax.plot(X, Y+i, linestyle=linestyle, linewidth=1.5, color='black')ax.set_ylim(-0.5, len(linestyles)-0.5)plt.yticks(np.arange(len(linestyles)), linestyles.keys())plt.xticks([])# For each line style, add a text annotation with a small offset from# the reference point (0 in Axes coords, y tick value in Data coords).reference_transform = blended_transform_factory(ax.transAxes, ax.transData)for i, (name, linestyle) in enumerate(linestyles.items()):
    ax.annotate(str(linestyle), xy=(0.0, i), xycoords=reference_transform,
                xytext=(-6, -12), textcoords='offset points', color="blue",
                fontsize=8, ha="right", family="monospace")plt.tight_layout()plt.show()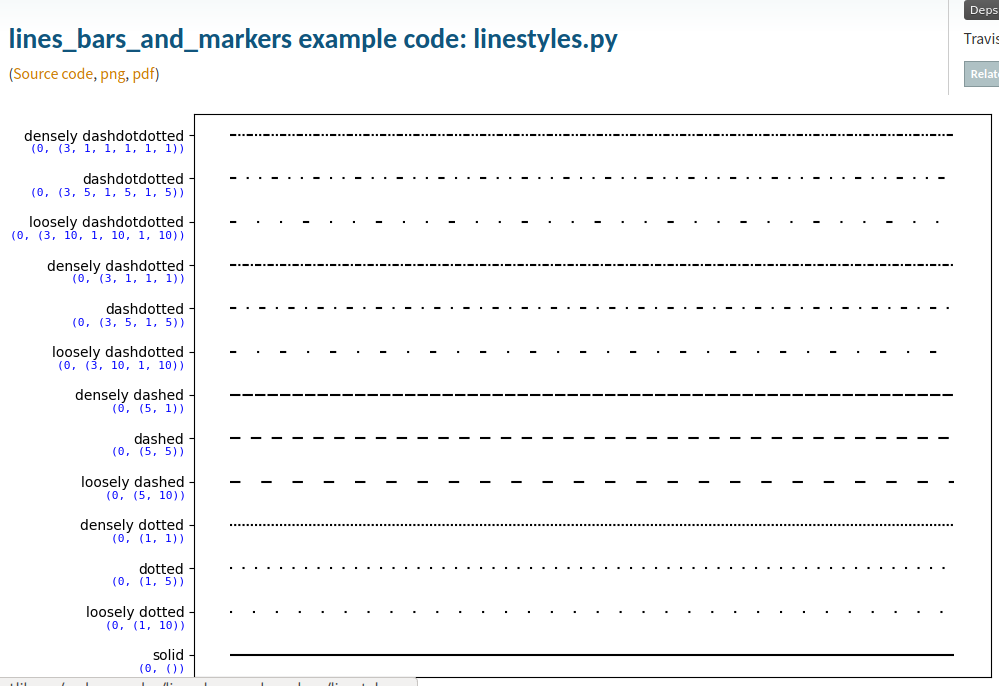
https://m.sciencenet.cn/blog-587102-1268263.html
上一篇:python plot横线和竖线
下一篇:[转载]python抽样方法详解及实现
扫一扫,分享此博文