博文
[转载]Multi Image
|||
refer to: https://matplotlib.org/stable/gallery/images_contours_and_fields/multi_image.html#multi-image
Make a set of images with a single colormap, norm, and colorbar.
from matplotlib import colorsimport matplotlib.pyplot as pltimport numpy as npnp.random.seed(19680801)Nr = 3Nc = 2fig, axs = plt.subplots(Nr, Nc)fig.suptitle('Multiple images')images = []for i in range(Nr):
    for j in range(Nc):
        # Generate data with a range that varies from one plot to the next.
        data = ((1 + i + j) / 10) * np.random.rand(10, 20)
        images.append(axs[i, j].imshow(data))
        axs[i, j].label_outer()# Find the min and max of all colors for use in setting the color scale.vmin = min(image.get_array().min() for image in images)vmax = max(image.get_array().max() for image in images)norm = colors.Normalize(vmin=vmin, vmax=vmax)for im in images:
    im.set_norm(norm)fig.colorbar(images[0], ax=axs, orientation='horizontal', fraction=.1)# Make images respond to changes in the norm of other images (e.g. via the# "edit axis, curves and images parameters" GUI on Qt), but be careful not to# recurse infinitely!def update(changed_image):
    for im in images:
        if (changed_image.get_cmap() != im.get_cmap()
                or changed_image.get_clim() != im.get_clim()):
            im.set_cmap(changed_image.get_cmap())
            im.set_clim(changed_image.get_clim())for im in images:
    im.callbacks.connect('changed', update)plt.show()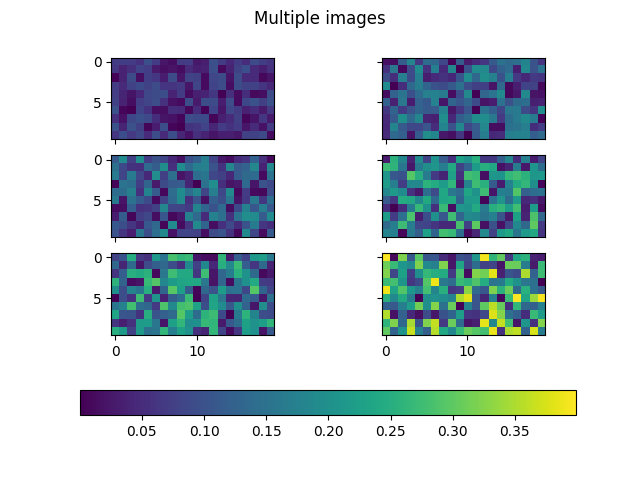
References
The use of the following functions, methods, classes and modules is shown in this example:
https://m.sciencenet.cn/blog-587102-1322757.html
上一篇:[转载]Creating adjacent subplots
下一篇:[转载]Interpolations for imshow