博文
[转载]matplotlib隐藏刻度线、标签和边线
|||
refer to: https://blog.csdn.net/weixin_43326122/article/details/107292857
https://www.delftstack.com/zh/howto/matplotlib/how-to-hide-axis-text-ticks-and-or-tick-labels-in-matplotlib/
一般情况
以下ax默认由plt.gca()或plt.subplots()获得
隐藏所有刻度线和标签
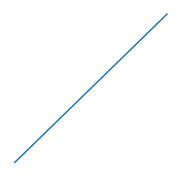
隐藏刻度线和标签
![plt.yticks([])结果](https://img-blog.csdnimg.cn/20200715184405122.png)
隐藏刻度线

隐藏边线

https://m.sciencenet.cn/blog-587102-1325589.html
上一篇:arXiv-2022.2.5
下一篇:[转载]matplotlib隐藏刻度线、标签和边线
扫一扫,分享此博文