博文
谈谈gnuplot(九):输出 eps 图片
||||
到目前为止,我们所有的gnuplot作图都只是输出到电脑屏幕上。如果要在我们的文档里使用这些图片,我们必须把它们以某种文件格式存储下来。前面已经介绍过,gnuplot里面控制图像输出方式的命令是 terminal。我们这次就讲一下如何把图片输出为 eps 文件。
之所以首先选择 eps,是因为大量科学技术文档使用 LaTeX 来编辑排版,而 eps 是 LaTeX 最常用的图片格式,支持高质量的矢量图形,并且可以方便的转换为 pdf、svg 等其他常用格式。
首先,让我们看看如何设置 terminal。在gnuplot里输入下面的命令:
gnuplot> set terminal postscript eps
这里的 terminal 其实是 postscript,而 eps 是作为 postscript 的一个参数。这并不奇怪,因为 eps 本来就是 postscript 衍生出来的。输入这个命令之后,gnuplot会自动返回下面的信息:
gnuplot> set xlabel "Month"
gnuplot> set ylabel "Precipitation (mm)"
gnuplot> set xrange [0.5:12.5]
gnuplot> set xtics 1,1,12
gnuplot> set output "precipitation.eps"
gnuplot> plot "precipitation.dat" using 1:2 w lp pt 5 title "Beijing", "precipitation.dat" using 1:3 w lp pt 7 title "Shanghai"
gnuplot> set output
gnuplot> set term wxt
这里我们没有使用中文标签,因为在 postscript 使用中文字体并不容易。以后我们会介绍如何绕过这个障碍。
第五行有一个新命令:set output。这没什么多说的,就是指定输出文件的文件名。第七行还有一个 set output,但是后面没有跟任何文件名。这其实是告诉gnuplot,这个文件已经输出完毕,可以关闭了。另外也可以用 unset output,其实是相同作用。之所以这么做,是因为有些 terminal 支持多页文件,所以在画完图之后,gnuplot并不自动关闭文件,等待你输入下一页内容,除非你手动关闭,切换 terminal,或者退出gnuplot程序。
最后,别忘了把 terminal 切换回屏幕显示,这样可以避免一些意想不到的事情发生。注意:我们又用缩写了!
下面让我们来看看生成的 eps 文件吧:
这个图像可能并不是我们想要的。有几个地方我们想要修改一下:
gnuplot> set terminal postscript eps color solid linewidth 2 "Helvetica" 20
gnuplot> set output "precipitation-color.eps"
gnuplot> replot
gnuplot> set output
gnuplot> set term wxt
这里我们用 color 参数表示我们要彩色图,solid 表示我们要实线不要虚线,linewidth 参数指定2倍线宽,而最后指定使用 Helvetica 20 号字体。让我们来看看新生成的 eps 文件:
这里的字体为 postscript level 2字体,共有35种。除了 Helvetica,常用的还有 Times-Roman。如果硬要多记两个字体名字,就记住 Courier 和 Symbol 吧。Courier 是编程时常用的等宽字体,而 Symbol 字体可以用来显示希腊字母。如果你实在好奇还有哪些其它字体,可以看看下面的网页链接:
http://xfig.org/userman/attributes.html#font-panel
https://m.sciencenet.cn/blog-373392-498797.html
上一篇:再次呼吁科学网博客增加数学公式支持
下一篇:谈谈gnuplot(十):输出 pdf 和 png 图片
之所以首先选择 eps,是因为大量科学技术文档使用 LaTeX 来编辑排版,而 eps 是 LaTeX 最常用的图片格式,支持高质量的矢量图形,并且可以方便的转换为 pdf、svg 等其他常用格式。
首先,让我们看看如何设置 terminal。在gnuplot里输入下面的命令:
gnuplot> set terminal postscript eps
这里的 terminal 其实是 postscript,而 eps 是作为 postscript 的一个参数。这并不奇怪,因为 eps 本来就是 postscript 衍生出来的。输入这个命令之后,gnuplot会自动返回下面的信息:
![]()
gnuplot> set xlabel "Month"
gnuplot> set ylabel "Precipitation (mm)"
gnuplot> set xrange [0.5:12.5]
gnuplot> set xtics 1,1,12
gnuplot> set output "precipitation.eps"
gnuplot> plot "precipitation.dat" using 1:2 w lp pt 5 title "Beijing", "precipitation.dat" using 1:3 w lp pt 7 title "Shanghai"
gnuplot> set output
gnuplot> set term wxt
这里我们没有使用中文标签,因为在 postscript 使用中文字体并不容易。以后我们会介绍如何绕过这个障碍。
第五行有一个新命令:set output。这没什么多说的,就是指定输出文件的文件名。第七行还有一个 set output,但是后面没有跟任何文件名。这其实是告诉gnuplot,这个文件已经输出完毕,可以关闭了。另外也可以用 unset output,其实是相同作用。之所以这么做,是因为有些 terminal 支持多页文件,所以在画完图之后,gnuplot并不自动关闭文件,等待你输入下一页内容,除非你手动关闭,切换 terminal,或者退出gnuplot程序。
最后,别忘了把 terminal 切换回屏幕显示,这样可以避免一些意想不到的事情发生。注意:我们又用缩写了!
下面让我们来看看生成的 eps 文件吧:
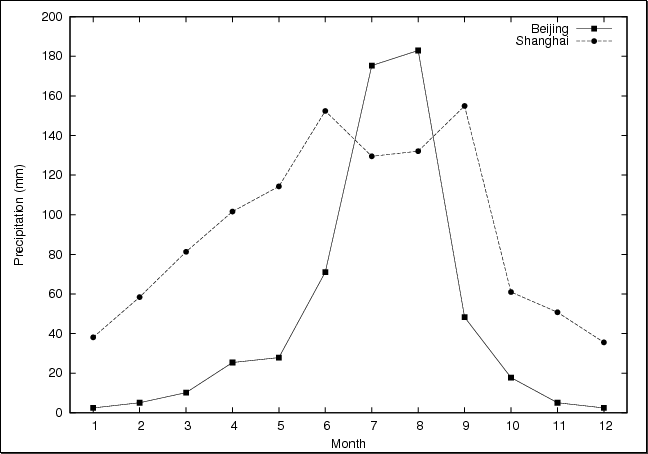
这个图像可能并不是我们想要的。有几个地方我们想要修改一下:
- 这个图是黑白的!我们想要彩色图。
- 有一组连线是虚线。这也难怪,黑白图如果不用虚线,还真分辨不出来。但我们想要彩色实线。
- 让直线稍微加粗一点。
- 标签文字显得小了些,我们想要大一点的字体。
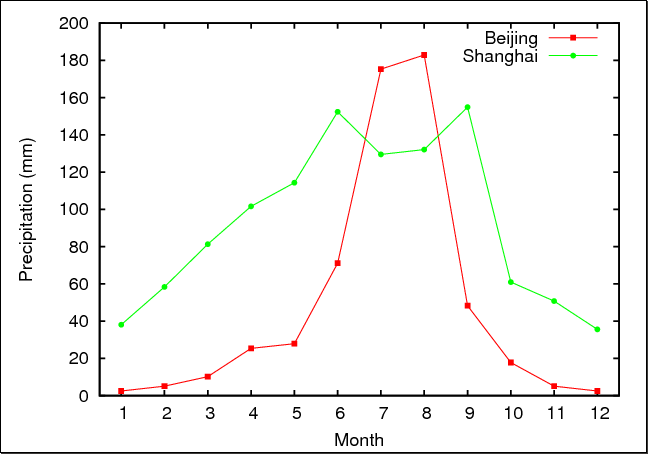
gnuplot> set terminal postscript eps color solid linewidth 2 "Helvetica" 20
gnuplot> set output "precipitation-color.eps"
gnuplot> replot
gnuplot> set output
gnuplot> set term wxt
这里我们用 color 参数表示我们要彩色图,solid 表示我们要实线不要虚线,linewidth 参数指定2倍线宽,而最后指定使用 Helvetica 20 号字体。让我们来看看新生成的 eps 文件:
这里的字体为 postscript level 2字体,共有35种。除了 Helvetica,常用的还有 Times-Roman。如果硬要多记两个字体名字,就记住 Courier 和 Symbol 吧。Courier 是编程时常用的等宽字体,而 Symbol 字体可以用来显示希腊字母。如果你实在好奇还有哪些其它字体,可以看看下面的网页链接:
http://xfig.org/userman/attributes.html#font-panel
https://m.sciencenet.cn/blog-373392-498797.html
上一篇:再次呼吁科学网博客增加数学公式支持
下一篇:谈谈gnuplot(十):输出 pdf 和 png 图片