博文
谈谈gnuplot(十七):边框和坐标轴
||||
我们现在所有绘图的坐标刻度均标在图像边框上,无论上下左右。这样做的好处是函数或数据图线清楚,不会和坐标标注混在一起。其实,我们小时候数学课上最早学习坐标系的时候,都是让 X 轴和 Y 轴正交于原点,而刻度标注在坐标轴上。这样的图像在定性表现函数关系,尤其有一定对称性的函数关系时,比较一目了然。
让我们来看看怎样用 gnuplot 得到这样的效果。
gnuplot> set term wxt enhanced font "Times New Roman,16"
gnuplot> gauss(x) = exp(-pi*x*x)
gnuplot> set title "函数 e^{-πx^2}"
gnuplot> set samples 500
gnuplot> set xrange [-3:3]
gnuplot> set yrange [-0.2:1.2]
gnuplot> unset key
gnuplot> unset border
gnuplot> set zeroaxis lt -1 lw 2
gnuplot> set xtics axis -2,1,2
gnuplot> set ytics axis 0,1,1
gnuplot> plot gauss(x) lw 3
例子中的参数前面都介绍过,如果不记得了,可以复习一下“坐标取值范围及刻度”和“点线风格”等章节。这里的图像已经很像模像样了,除了标签位置还不那么理想,而且坐标轴没有箭头。幸好,我们上一讲刚刚谈到过箭头,下面来试试做一下微调:
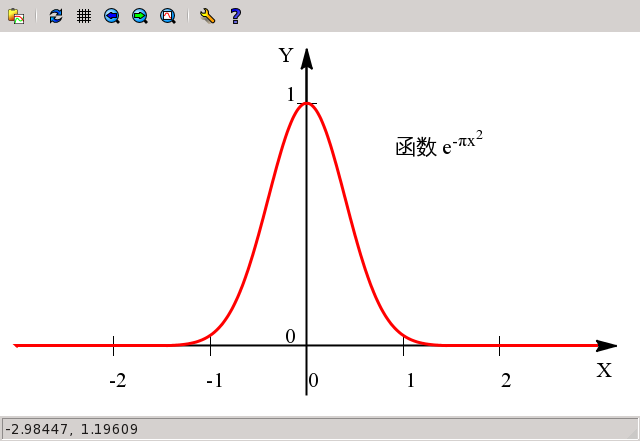
gnuplot> set title "函数 e^{-πx^2}" offset 12,-5
gnuplot> set xtics axis -2,1,2 offset 0.4,0
gnuplot> set ytics axis 0,1,1 offset 0,0.4
gnuplot> set arrow 1 from 2,0 to 3.2,0 filled size 0.2,15,60 lw 2
gnuplot> set arrow 2 from 0,1 to 0,1.22 filled size 0.2,15,60 lw 2
gnuplot> set rmargin 4
gnuplot> set label 1 "X" at 3.0,-0.1
gnuplot> set label 2 "Y" at -0.3,1.2
gnuplot> replot
这里有几个命令同时用到了新的参数:offset。它的作用就是把命令里提到的标签文字平移一段距离。在这里,offset 默认的坐标系统是 character。我们慢慢会体会到这种做法的好处,它使得我们很多时候改变字体大小,而不必重新设置 offset。
另外,set rmargin 命令用于设置图像右边空白宽度,单位也是 character。一般情况下,四边空白宽度都是自动设置的。现在我们在右边增加了箭头,而绘图显示区域不会因此自动扩大,这样会导致箭头无法完整显示,所以要手动改一下设置。相应的,上、左、下边的空白宽度,分别由 tmargin,lmargin,bmargin 参数控制。
https://m.sciencenet.cn/blog-373392-502991.html
上一篇:谈谈gnuplot(十六):箭头
下一篇:谈谈gnuplot(十八):图例
让我们来看看怎样用 gnuplot 得到这样的效果。
- 用 unset border 命令把边框去掉;
- 用 set zeroaxis 命令画出正交于原点的坐标轴;
- 在设定坐标刻度时加上 axis 参数,这样刻度会出现在坐标轴上面,而不是边框上。
gnuplot> set term wxt enhanced font "Times New Roman,16"
gnuplot> gauss(x) = exp(-pi*x*x)
gnuplot> set title "函数 e^{-πx^2}"
gnuplot> set samples 500
gnuplot> set xrange [-3:3]
gnuplot> set yrange [-0.2:1.2]
gnuplot> unset key
gnuplot> unset border
gnuplot> set zeroaxis lt -1 lw 2
gnuplot> set xtics axis -2,1,2
gnuplot> set ytics axis 0,1,1
gnuplot> plot gauss(x) lw 3
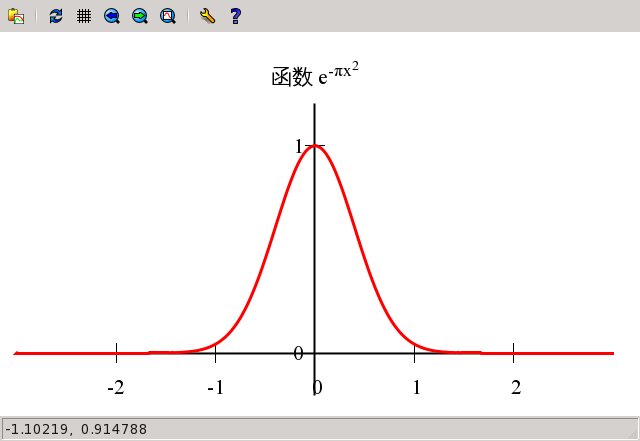
例子中的参数前面都介绍过,如果不记得了,可以复习一下“坐标取值范围及刻度”和“点线风格”等章节。这里的图像已经很像模像样了,除了标签位置还不那么理想,而且坐标轴没有箭头。幸好,我们上一讲刚刚谈到过箭头,下面来试试做一下微调:
gnuplot> set title "函数 e^{-πx^2}" offset 12,-5
gnuplot> set xtics axis -2,1,2 offset 0.4,0
gnuplot> set ytics axis 0,1,1 offset 0,0.4
gnuplot> set arrow 1 from 2,0 to 3.2,0 filled size 0.2,15,60 lw 2
gnuplot> set arrow 2 from 0,1 to 0,1.22 filled size 0.2,15,60 lw 2
gnuplot> set rmargin 4
gnuplot> set label 1 "X" at 3.0,-0.1
gnuplot> set label 2 "Y" at -0.3,1.2
gnuplot> replot
这里有几个命令同时用到了新的参数:offset。它的作用就是把命令里提到的标签文字平移一段距离。在这里,offset 默认的坐标系统是 character。我们慢慢会体会到这种做法的好处,它使得我们很多时候改变字体大小,而不必重新设置 offset。
另外,set rmargin 命令用于设置图像右边空白宽度,单位也是 character。一般情况下,四边空白宽度都是自动设置的。现在我们在右边增加了箭头,而绘图显示区域不会因此自动扩大,这样会导致箭头无法完整显示,所以要手动改一下设置。相应的,上、左、下边的空白宽度,分别由 tmargin,lmargin,bmargin 参数控制。
https://m.sciencenet.cn/blog-373392-502991.html
上一篇:谈谈gnuplot(十六):箭头
下一篇:谈谈gnuplot(十八):图例