博文
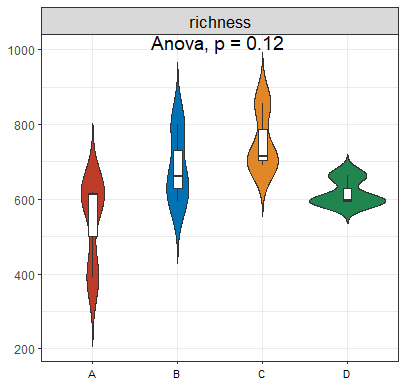
qiime2的richness指数
||
#原文链接https://mp.weixin.qq.com/s/nB7cPb0ij0srVc_v_KG0AQ
rm(list=ls())
library(tidyverse)
library(magrittr)
library(ggsci)
library(ggpubr)
otu <- read.delim("otu_table.tsv",header = T,sep="\t",
check.names = F,row.names = 1)
richness <- NULL
for (i in seq_len(ncol(otu))) {
richness <- c(richness,which(otu[,i] !=0) %>% length())
}
names(richness) <- otu %>% colnames()
richness <- richness %<>% data.frame(sample= names(.),value = .)
richness
#p <- richness %<>% data.frame(names(.),.) %>%
# set_colnames(c("sample","value"))
group <- read.delim("group.xls",header = T,sep="\t",check.names = F)
colnames(richness)[1] <- colnames(group[1])
full_join(richness,group) %>%
mutate(V4="richness") %>%
ggplot(aes(group,value,fill=group))+
scale_fill_nejm()+
geom_violin(trim=FALSE)+
geom_boxplot(width=0.1,fill="white")+
facet_grid(. ~V4,scales = "free",space="free_x")+
xlab(NULL)+ylab(NULL)+
theme_bw()+
theme(legend.position = "none",
axis.text.x=element_text(angle =0,hjust=0.5,vjust=0.5,
colour = "black",size=8),
strip.text.x = element_text(colour ="black",size=13))+
stat_compare_means(method = "anova",label.y =1000,label.x = 2,size=5)
https://m.sciencenet.cn/blog-3448646-1270950.html
上一篇:alpha多样性指数绘图
下一篇:差异分析检验流程