博文
tableau绘制的两幅作品
||||
https://public.tableau.com/zh-cn/s/gallery/history-us
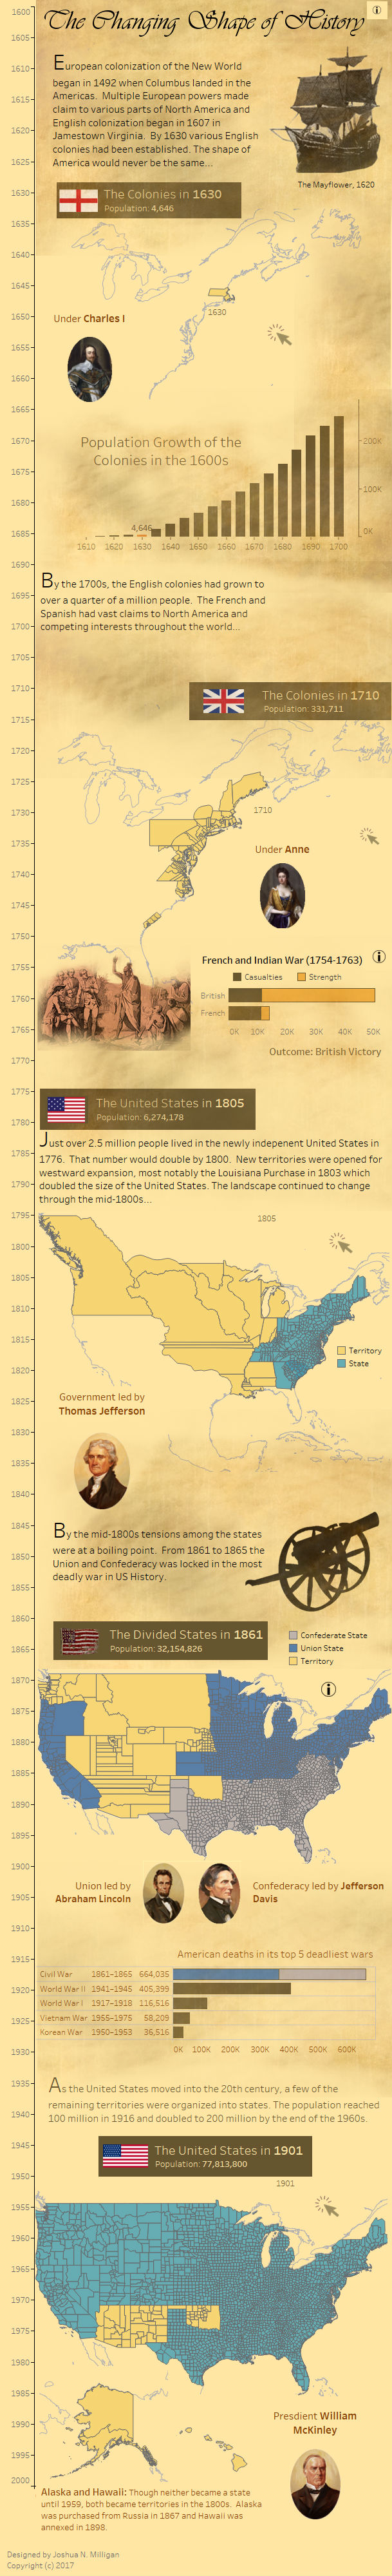
The History of the US
作者: Joshua N. Milligan
最初发布: vizpainter.com
Joshua Milligan created this viz for the IronViz "Geospatial" feeder competition - and won!
Use the timeline sliders to see how the map of the US changed over time.
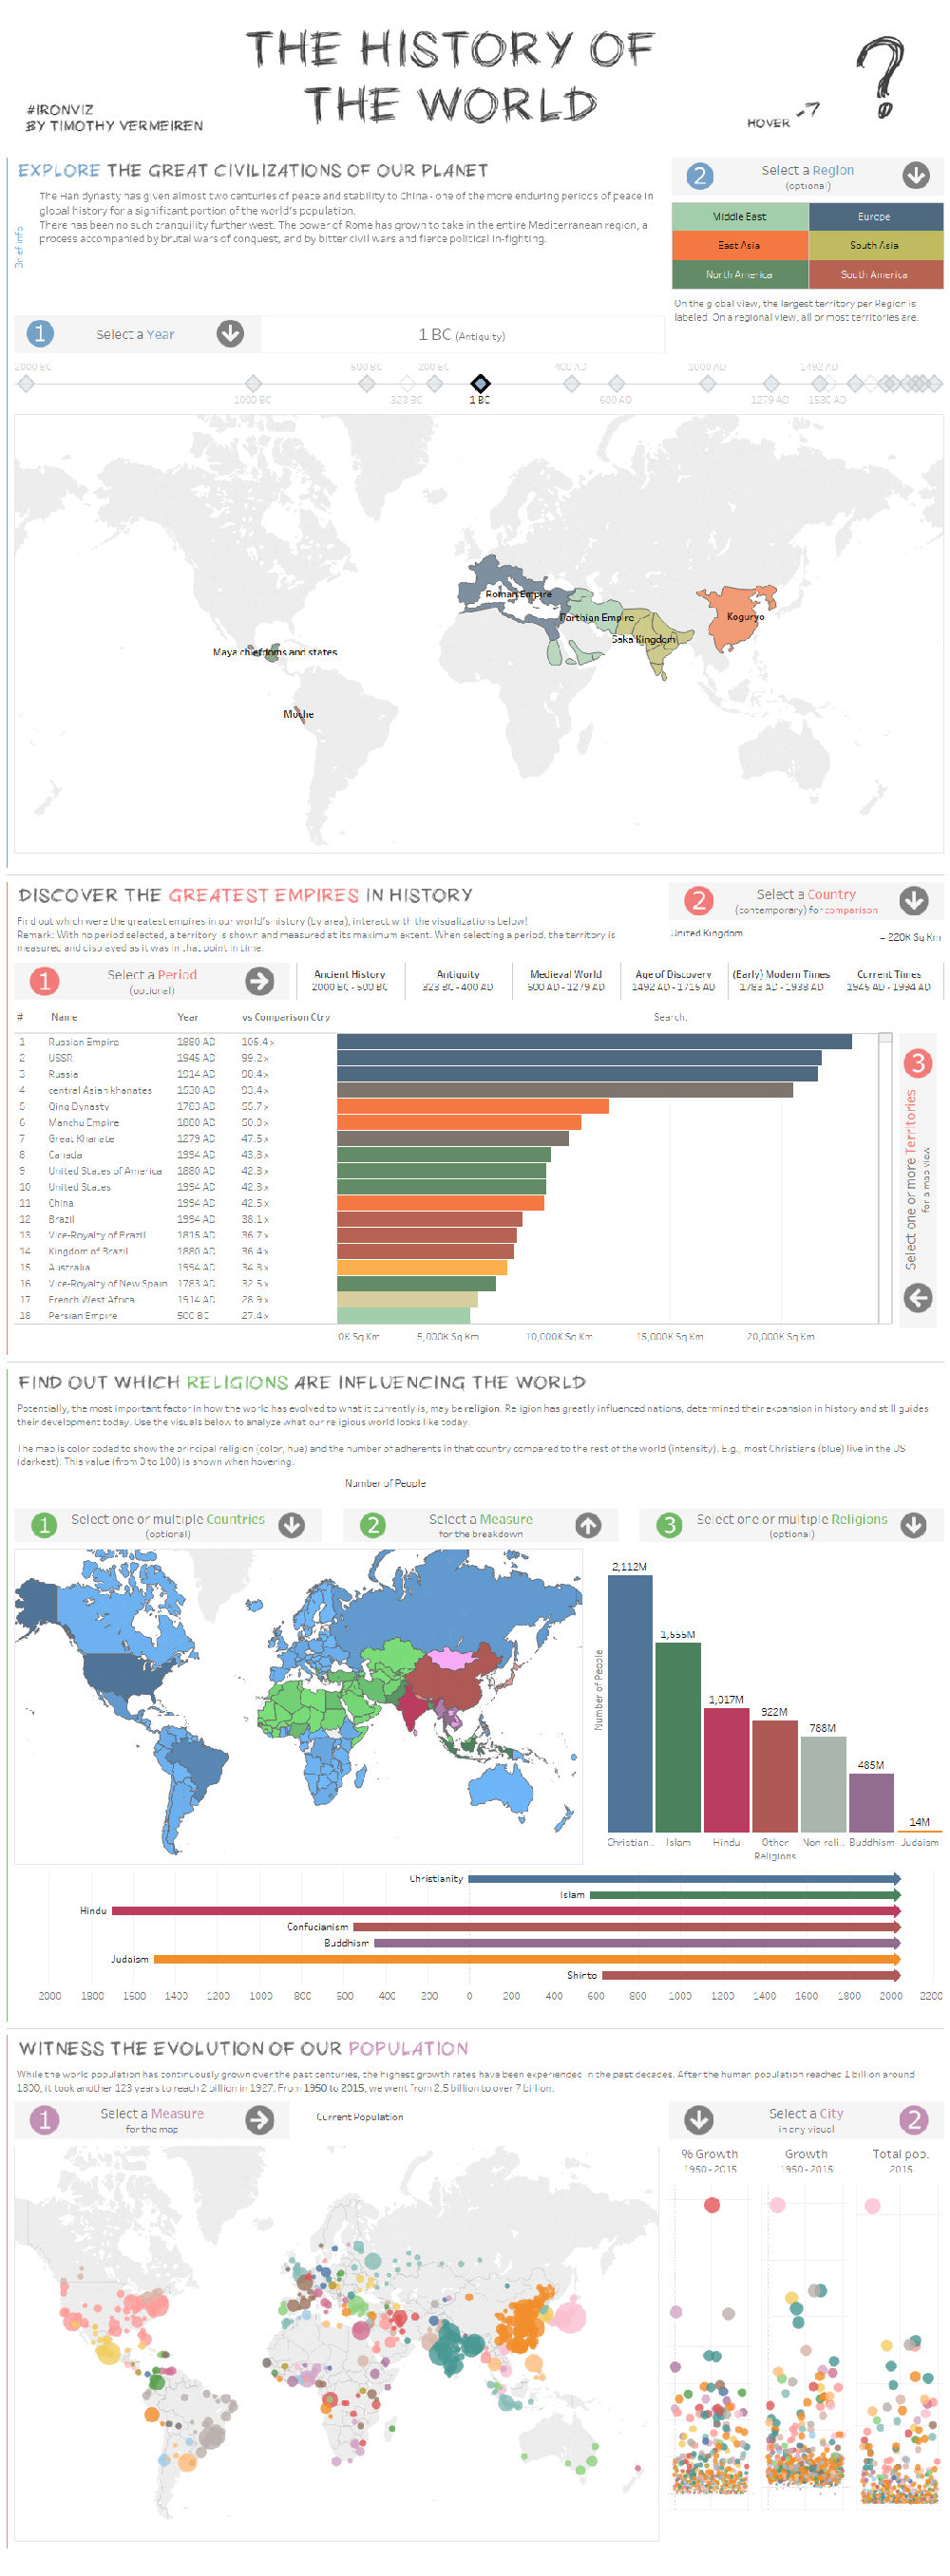
https://public.tableau.com/zh-cn/s/gallery/history-world
History of the World
作者: Timothy Vermeiren
最初发布: Bizstory.be
Timothy Vermeiren's visualization shows civilizations and religions' geographic reach over time. It won the popular Twitter vote in this year's first Iron Viz feeder contest.
Timothy has included plenty of indications about what to do. Hover over the "?" for sources, select an option to filter the charts whenever he invites you to.
https://m.sciencenet.cn/blog-113146-1050233.html
上一篇:2017大数据版图
下一篇:心智模式