博文
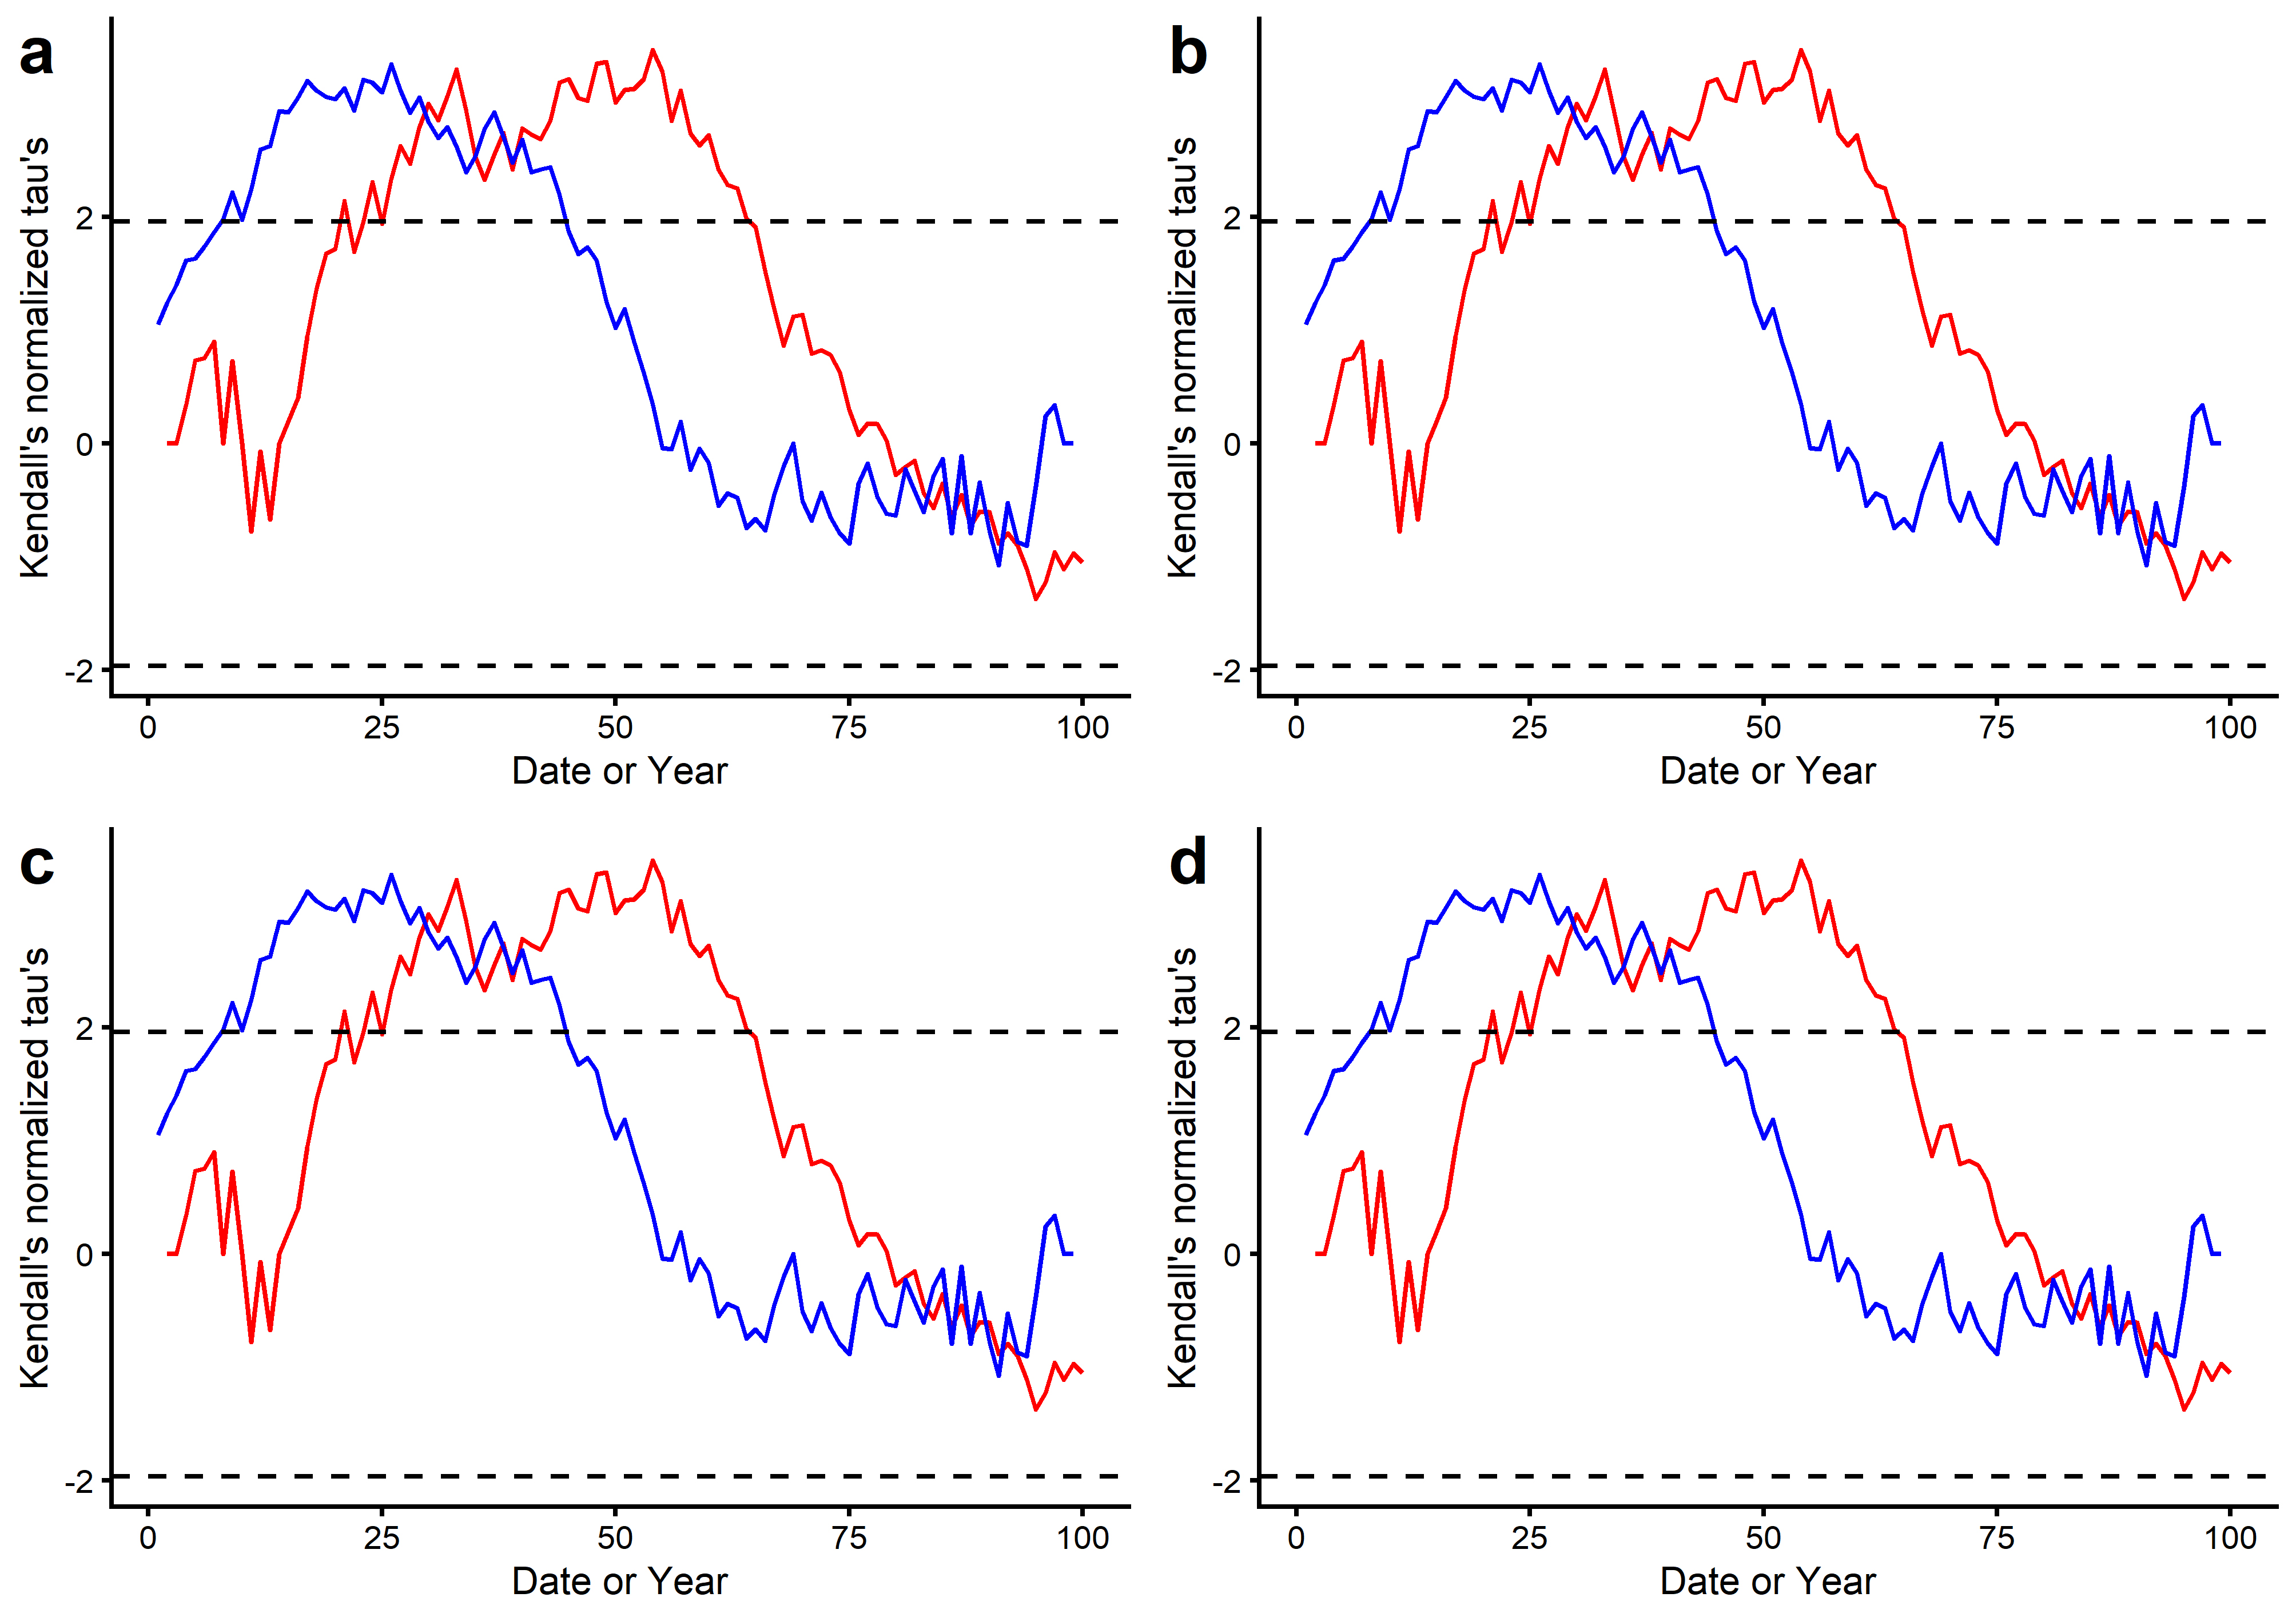
利用R进行时间序列Mann-Kendall突变检测
|||
library(tidyverse)
library(pheno)
library(rkt)
library(cowplot)
x <- runif(100,min = -3,max = 3)
seqMK.series <- seqMK(x) %>% as.data.frame() %>%
mutate(date=seq_along(prog))
G <- ggplot(data = seqMK.series, aes(x = date, y = prog)) +
geom_line(color = "red") +
geom_line(aes(y = retr), color = "blue") +
geom_hline(yintercept = c(-1.96, 1.96), linetype = "dashed") +
labs(x="Date or Year",y= "Kendall's normalized tau's") +
cowplot::theme_cowplot(font_size = 8,line_size = 0.5)
G.list <- plot_grid(G,G,G,G,nrow = 2,labels = letters)
Taotao::preview.ggplot(G.list,width = 17,height = 12)
https://m.sciencenet.cn/blog-3427939-1230000.html
上一篇:利用R绘制指定区域的DEM图
下一篇:利用R进行通径分析
扫一扫,分享此博文