博文
[转载]matplotlib命令与格式:标题(title),标注(annotate),文字说明(text)
|||
refer to : https://www.cnblogs.com/Rvin/p/9303901.html
1.title设置图像标题
(1)title常用参数
fontsize设置字体大小,默认12,可选参数 ['xx-small', 'x-small', 'small', 'medium', 'large','x-large', 'xx-large']
fontweight设置字体粗细,可选参数 ['light', 'normal', 'medium', 'semibold', 'bold', 'heavy', 'black']
fontstyle设置字体类型,可选参数[ 'normal' | 'italic' | 'oblique' ],italic斜体,oblique倾斜
verticalalignment设置水平对齐方式 ,可选参数 : 'center' , 'top' , 'bottom' ,'baseline'
horizontalalignment设置垂直对齐方式,可选参数:left,right,center
rotation(旋转角度)可选参数为:vertical,horizontal 也可以为数字
alpha透明度,参数值0至1之间
backgroundcolor标题背景颜色
bbox给标题增加外框 ,常用参数如下:
boxstyle方框外形
facecolor(简写fc)背景颜色
edgecolor(简写ec)边框线条颜色
edgewidth边框线条大小
(2)title例子:
plt.title('Interesting Graph',fontsize='large',fontweight='bold') 设置字体大小与格式
plt.title('Interesting Graph',color='blue') 设置字体颜色
plt.title('Interesting Graph',loc ='left') 设置字体位置
plt.title('Interesting Graph',verticalalignment='bottom') 设置垂直对齐方式
plt.title('Interesting Graph',rotation=45) 设置字体旋转角度
plt.title('Interesting',bbox=dict(facecolor='g', edgecolor='blue', alpha=0.65 )) 标题边框
面向对象api例子:
import matplotlib.pyplot as plt
x=[1,2,3,4,5]
y=[3,6,7,9,2]
fig,ax=plt.subplots(1,1)
ax.plot(x,y,label='trend')
ax.set_title('title test',fontsize=12,color='r')
plt.show()
2.annotate标注文字
(1)annotate语法说明 :annotate(s='str' ,xy=(x,y) ,xytext=(l1,l2) ,..)
s 为注释文本内容
xy 为被注释的坐标点
xytext 为注释文字的坐标位置
xycoords 参数如下:
figure points points from the lower left of the figure 点在图左下方
figure pixels pixels from the lower left of the figure 图左下角的像素
figure fraction fraction of figure from lower left 左下角数字部分
axes points points from lower left corner of axes 从左下角点的坐标
axes pixels pixels from lower left corner of axes 从左下角的像素坐标
axes fraction fraction of axes from lower left 左下角部分
data use the coordinate system of the object being annotated(default) 使用的坐标系统被注释的对象(默认)
polar(theta,r) if not native ‘data’ coordinates t
extcoords 设置注释文字偏移量
| 参数 | 坐标系 |
| 'figure points' | 距离图形左下角的点数量 |
| 'figure pixels' | 距离图形左下角的像素数量 |
| 'figure fraction' | 0,0 是图形左下角,1,1 是右上角 |
| 'axes points' | 距离轴域左下角的点数量 |
| 'axes pixels' | 距离轴域左下角的像素数量 |
| 'axes fraction' | 0,0 是轴域左下角,1,1 是右上角 |
| 'data' | 使用轴域数据坐标系 |
arrowprops #箭头参数,参数类型为字典dict
width the width of the arrow in points 点箭头的宽度
headwidth the width of the base of the arrow head in points 在点的箭头底座的宽度
headlength the length of the arrow head in points 点箭头的长度
shrink fraction of total length to ‘shrink’ from both ends 总长度为分数“缩水”从两端
facecolor 箭头颜色
bbox给标题增加外框 ,常用参数如下:
boxstyle方框外形
facecolor(简写fc)背景颜色
edgecolor(简写ec)边框线条颜色
edgewidth边框线条大小
bbox=dict(boxstyle='round,pad=0.5', fc='yellow', ec='k',lw=1 ,alpha=0.5) #fc为facecolor,ec为edgecolor,lw为lineweight
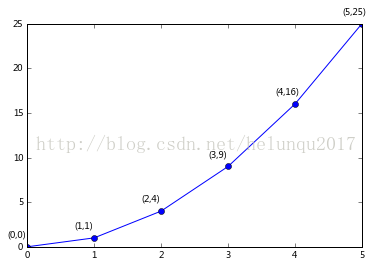
(2)案例
import matplotlib.pyplot as plt
import numpy as np
x = np.arange(0, 6)
y = x * x
plt.plot(x, y, marker='o')
for xy in zip(x, y):
plt.annotate("(%s,%s)" % xy, xy=xy, xytext=(-20, 10), textcoords='offset points')
plt.show()
plt.annotate('local max', xy=(2, 1), xytext=(3, 1.5),arrowprops=dict(facecolor='black', shrink=0.05))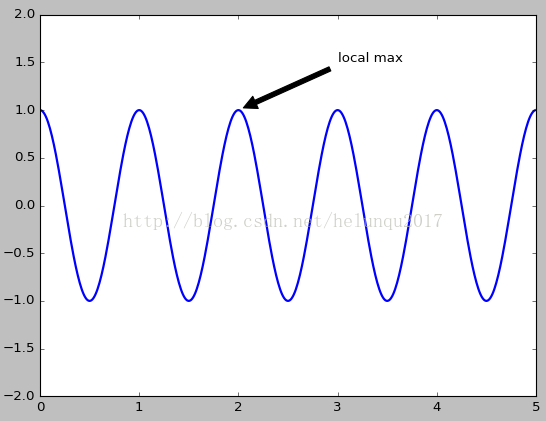
3.text设置文字说明
(1)text语法说明
text(x,y,string,fontsize=15,verticalalignment="top",horizontalalignment="right")
x,y:表示坐标值上的值
string:表示说明文字
fontsize:表示字体大小
verticalalignment:垂直对齐方式 ,参数:[ ‘center’ | ‘top’ | ‘bottom’ | ‘baseline’ ]
horizontalalignment:水平对齐方式 ,参数:[ ‘center’ | ‘right’ | ‘left’ ]
xycoords选择指定的坐标轴系统:
figure points points from the lower left of the figure 点在图左下方
figure pixels pixels from the lower left of the figure 图左下角的像素
figure fraction fraction of figure from lower left 左下角数字部分
axes points points from lower left corner of axes 从左下角点的坐标
axes pixels pixels from lower left corner of axes 从左下角的像素坐标
axes fraction fraction of axes from lower left 左下角部分
data use the coordinate system of the object being annotated(default) 使用的坐标系统被注释的对象(默认)
polar(theta,r) if not native ‘data’ coordinates t
arrowprops #箭头参数,参数类型为字典dict
width the width of the arrow in points 点箭头的宽度
headwidth the width of the base of the arrow head in points 在点的箭头底座的宽度
headlength the length of the arrow head in points 点箭头的长度
shrink fraction of total length to ‘shrink’ from both ends 总长度为分数“缩水”从两端
facecolor 箭头颜色
bbox给标题增加外框 ,常用参数如下:
boxstyle方框外形
facecolor(简写fc)背景颜色
edgecolor(简写ec)边框线条颜色
edgewidth边框线条大小
bbox=dict(boxstyle='round,pad=0.5', fc='yellow', ec='k',lw=1 ,alpha=0.5) #fc为facecolor,ec为edgecolor,lw为lineweight
(2)案例
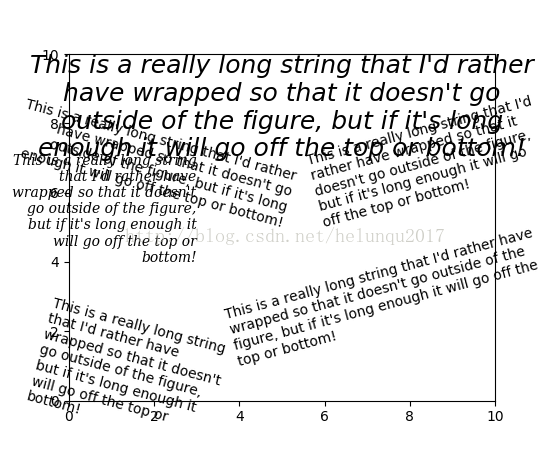
文字格式与位置:
import matplotlib.pyplot as plt
fig = plt.figure()
plt.axis([0, 10, 0, 10])
t = "This is a really long string that I'd rather have wrapped so that it"\
" doesn't go outside of the figure, but if it's long enough it will go"\
" off the top or bottom!"
plt.text(4, 1, t, ha='left', rotation=15, wrap=True)
plt.text(6, 5, t, ha='left', rotation=15, wrap=True)
plt.text(5, 5, t, ha='right', rotation=-15, wrap=True)
plt.text(5, 10, t, fontsize=18, style='oblique', ha='center',va='top',wrap=True)
plt.text(3, 4, t, family='serif', style='italic', ha='right', wrap=True)
plt.text(-1, 0, t, ha='left', rotation=-15, wrap=True)
plt.show()
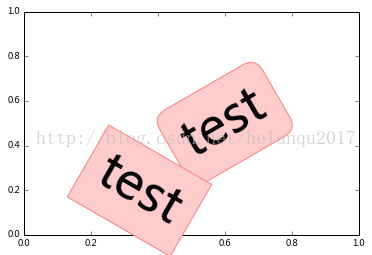
花式文本框:
import matplotlib.pyplot as plt
plt.text(0.6, 0.5, "test", size=50, rotation=30.,ha="center", va="center",bbox=dict(boxstyle="round",ec=(1., 0.5, 0.5),fc=(1., 0.8, 0.8),))
plt.text(0.5, 0.4, "test", size=50, rotation=-30.,ha="right", va="top",bbox=dict(boxstyle="square",ec=(1., 0.5, 0.5),fc=(1., 0.8, 0.8),))
plt.draw()
plt.show()
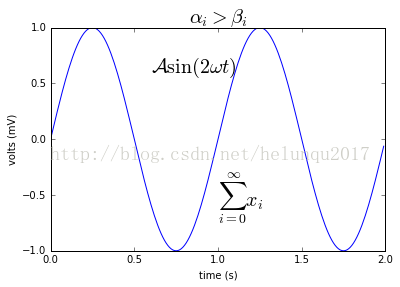
数学公式:
plt.title(r'$\alpha_i > \beta_i$', fontsize=20)
plt.text(1, -0.6, r'$\sum_{i=0}^\infty x_i$', fontsize=20)
plt.text(0.6, 0.6, r'$\mathcal{A}\mathrm{sin}(2 \omega t)$',fontsize=20)
https://m.sciencenet.cn/blog-587102-1246337.html
上一篇:[转载]matplotlib命令与格式:tick_params参数刻度线样式设置
下一篇:Python中设置坐标轴的粗细